Unlike traditional reports, benchmarking metrics in GA4 offer a real-time comparison against competitors by analyzing aggregated industry data.
Google Analytics updates these benchmarks daily, making sure you always have access to fresh, relevant insights.
In this guide, we’ll explore how GA4 benchmarking metrics work, how to enable them, and how to use them to make better business decisions.
Bonus Content: For daily performance tracking, learn more about the key GA4 metrics like user acquisition, engagement rate, bounce rate, session duration, conversion rate, and revenue trends.
What Is Benchmarking In Google Analytics 4 (GA4)?
Benchmarking metrics in Google Analytics (GA4) allow businesses to compare their performance against industry peers.
This feature provides key insights into how your website or app performs in areas like user acquisition, engagement, retention, and monetization.
Google Analytics groups similar businesses based on industry type and digital behavior, ensuring that your benchmarks are meaningful and relevant.
How to Access Benchmarking in Google Analytics 4 (GA4)
To access GA4 benchmarking metrics , you must first enable the benchmarking feature in your Google Analytics settings.
Without this setting turned on, benchmarking data will not be available in your reports.
Step-by-Step Guide to Enable Benchmarking in GA4
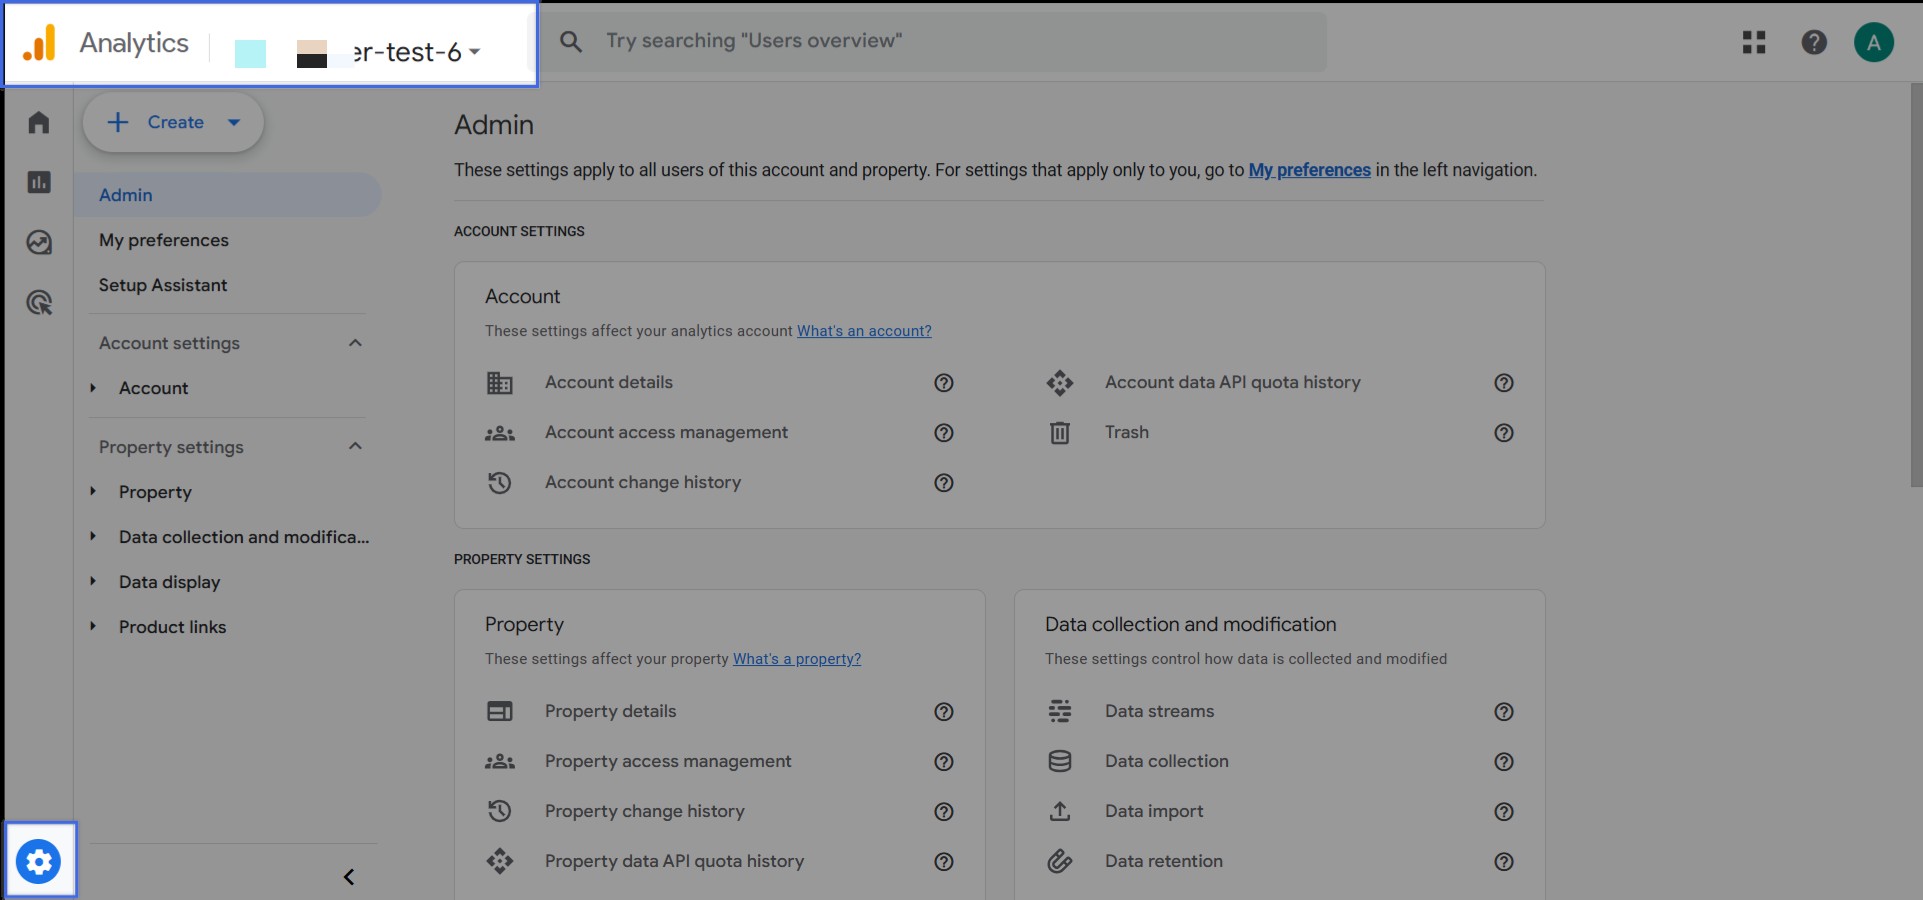
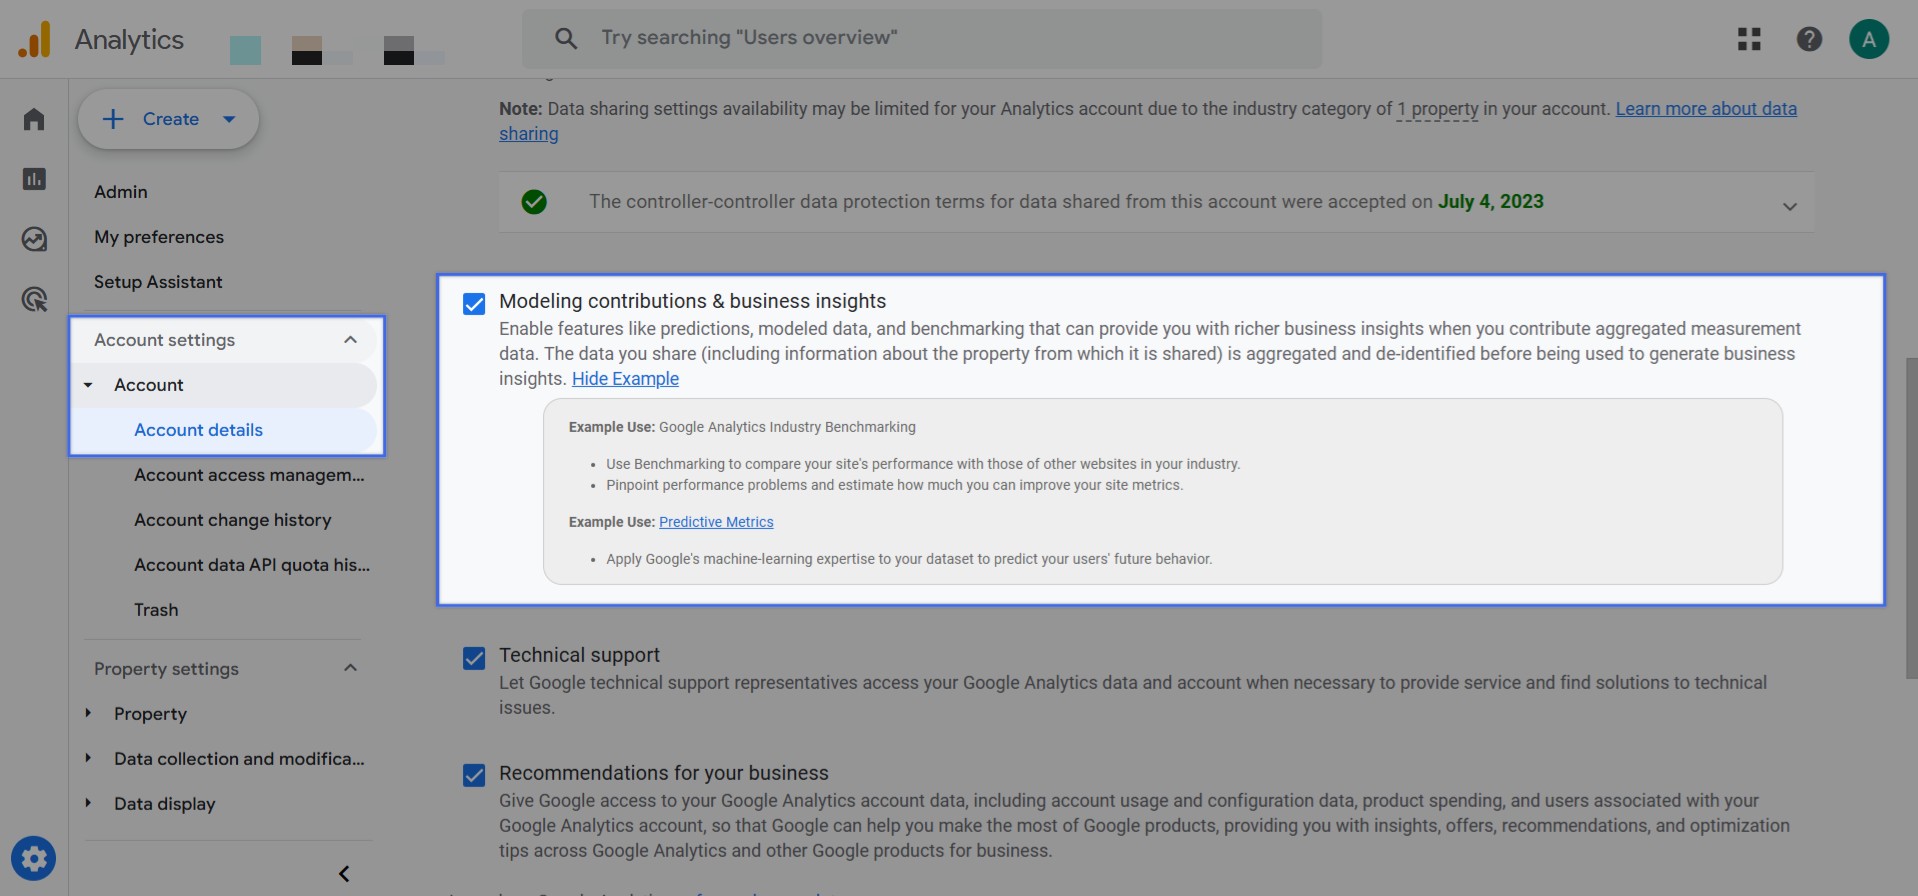
Once enabled, your account will start collecting benchmarking metrics in GA4.
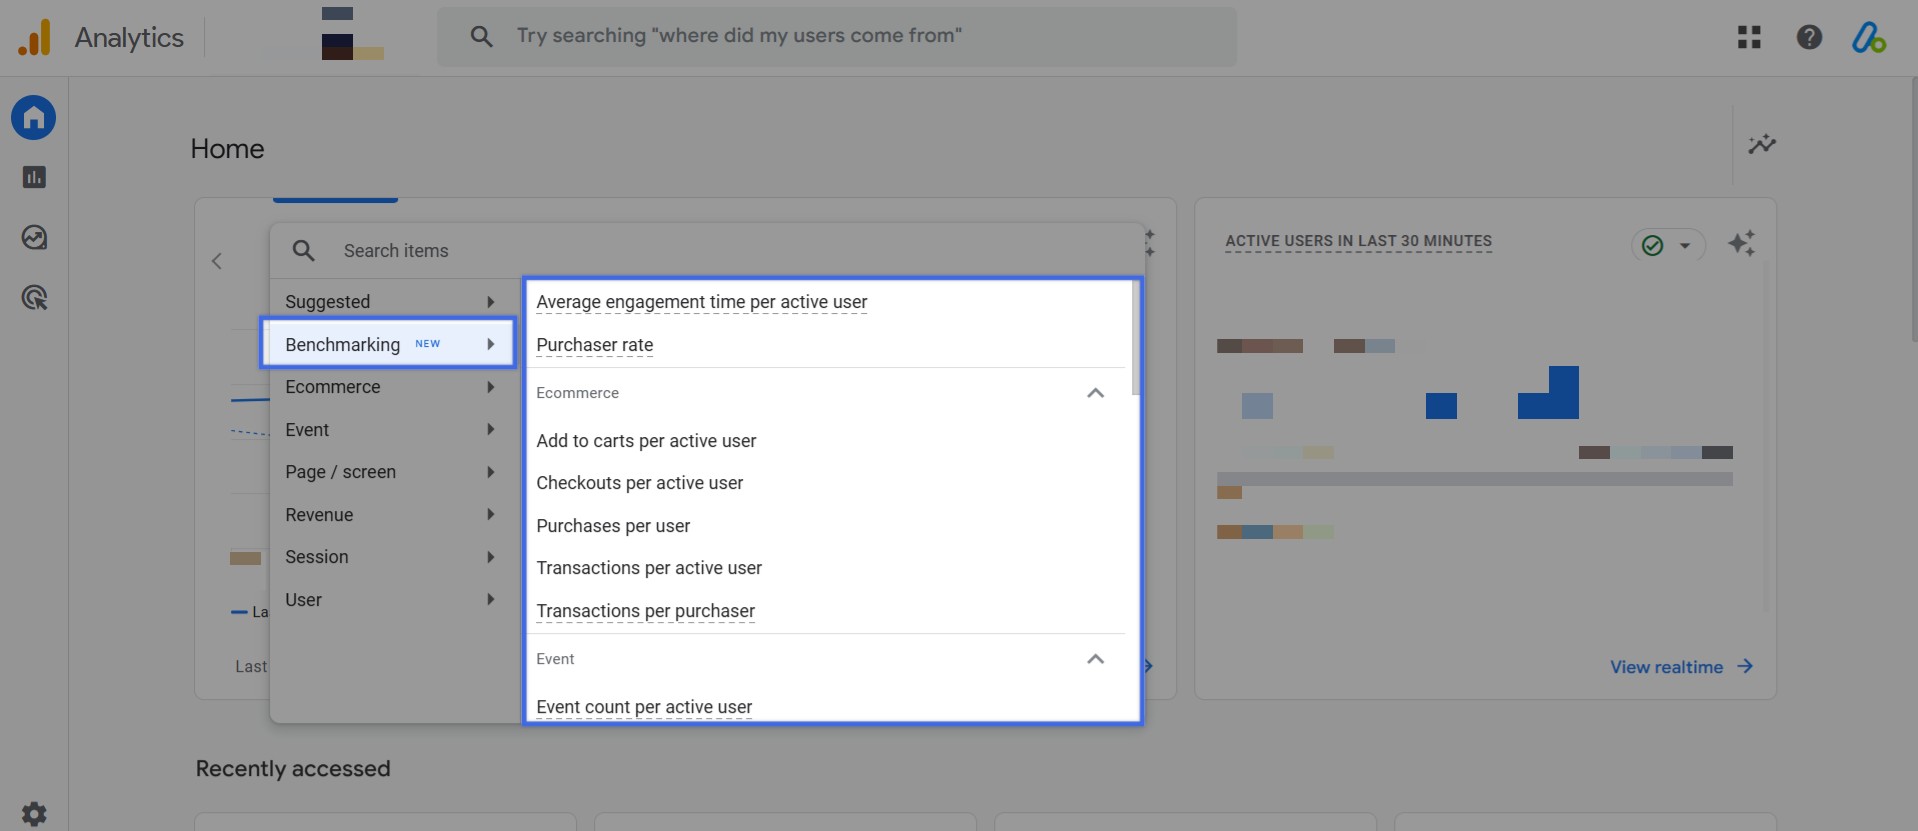
Categories and Available Benchmarking Metrics
Once you enable GA4 benchmarking metrics, you can track performance across four key categories: Acquisition, Engagement, Retention, and Monetization .
Here are the key GA4 benchmarking metrics along with their explanations:
1. Acquisition Metrics
These metrics show how well your business attracts new users compared to competitors.
- New user rate – Percentage of new visitors to your site or app.
2. Engagement Metrics
Understand how users interact with your content.
- Engagement rate – Percentage of sessions that include user interactions.
- Sessions per user – How frequently users return.
- Average session duration – The average time a user stays on your site.
- Views per session – How many pages or screens a user visits per session.
3. Retention Metrics
Measure how well your business retains users over time.
- Bounce rate – Percentage of users who leave after viewing only one page.
- Daily Active Users / Monthly Active Users (DAU/MAU) – Shows how often users return.
4. Monetization Metrics
Track revenue-related performance.
- Average revenue per user (ARPU) – How much revenue is generated per visitor.
- Transactions per user – How frequently users make purchases.
- First-time purchaser rate – Percentage of new users who complete a purchase.
With over 30+ benchmarking metrics in GA4, businesses can analyze trends and make informed decisions to improve their performance.
Check out the official Google document about the benchmarking metrics in Google Analytics 4 for more information.
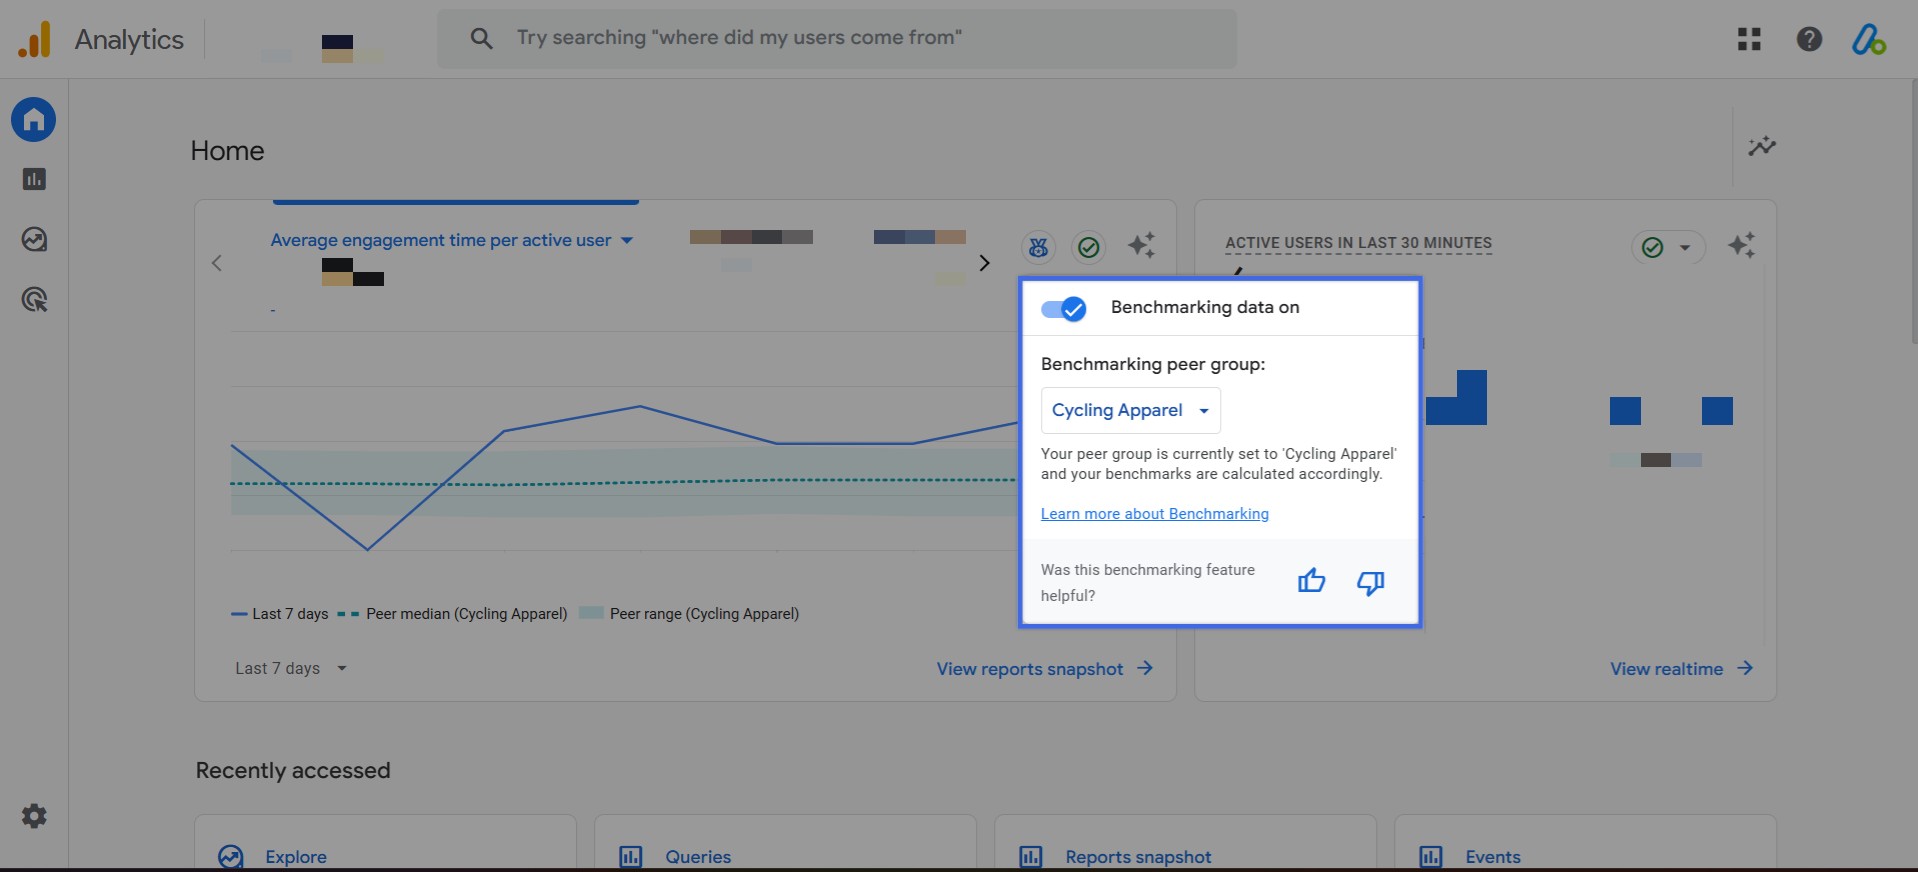
Understanding Peer Groups in Google Analytics 4 (GA4)
To make GA4 benchmarking metrics more accurate, Google Analytics groups businesses into peer groups based on industry type and digital behavior.
This ensures that your benchmarks are relevant and provide meaningful comparisons.
What Are Peer Groups in GA4?
A peer group is a set of businesses with similar characteristics. Google Analytics determines your default peer group based on:
- The industry category you selected during setup.
- Signals from your website URL and app attributes.
For example, if you run an online clothing store, your default peer group might be Shopping > Apparel .
How to Change Your Peer Group in GA4
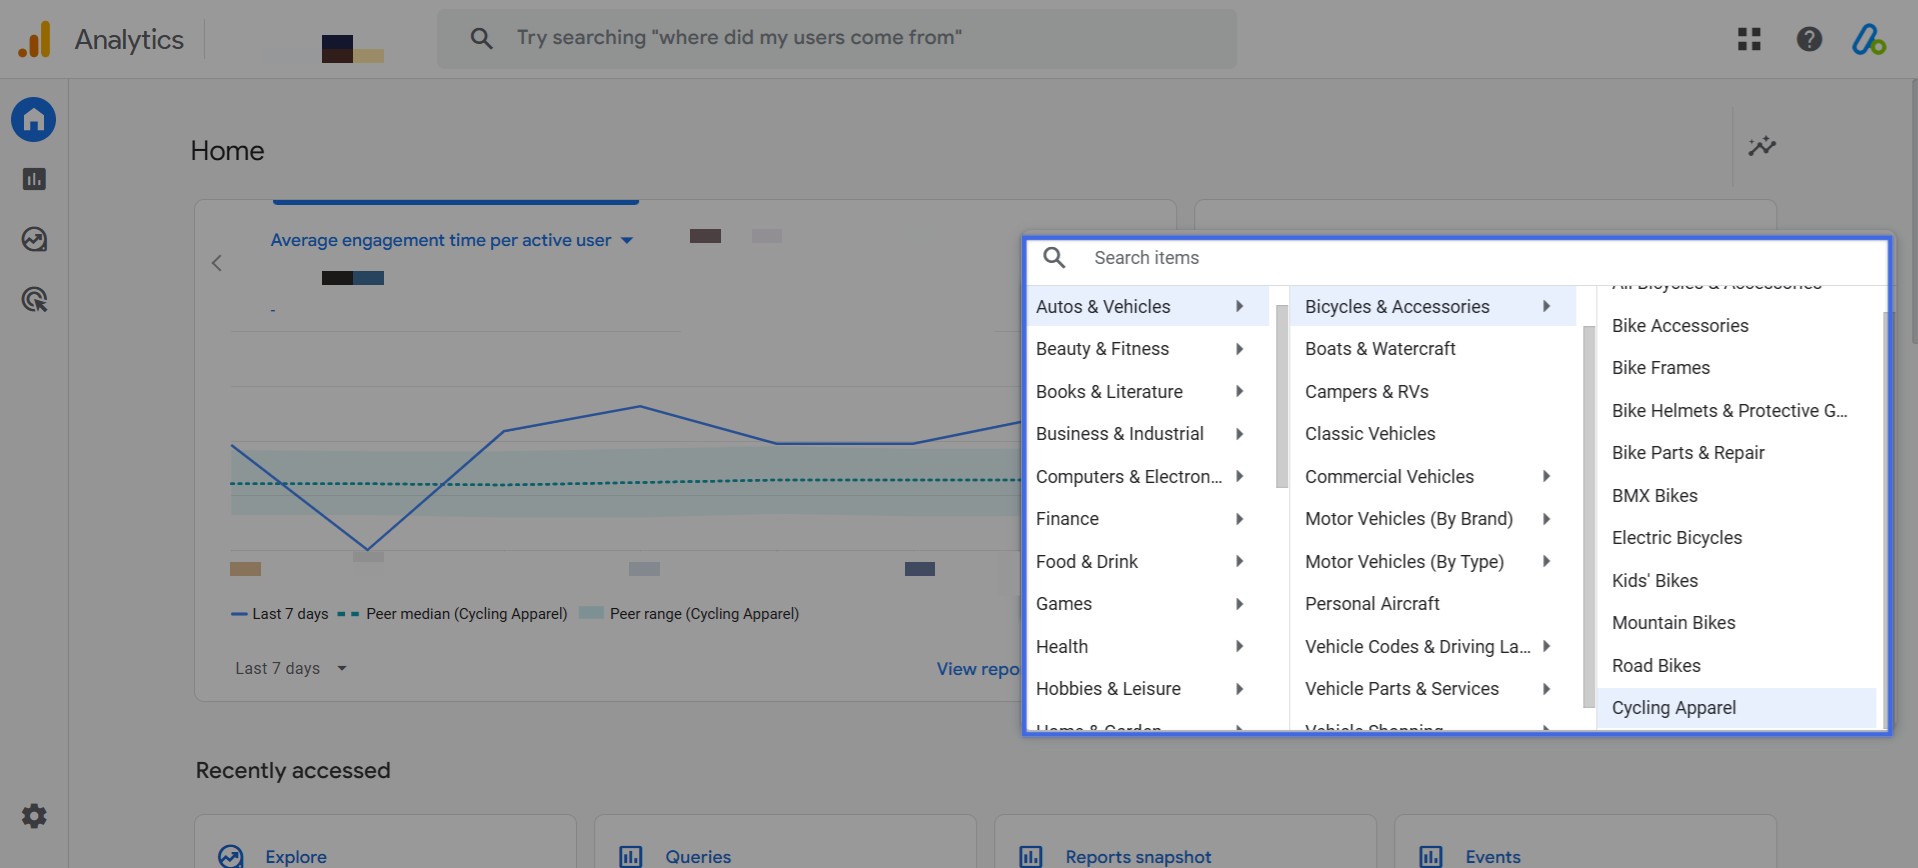
List of Peer Group Categories in GA4
GA4 offers a variety of industries to choose from, including:
- Shopping (Apparel, Electronics, Beauty, etc.)
- Food & Drink
- Travel & Transportation
- Finance
- Health
- Arts & Entertainment
- Many more…
You can also select subcategories for a more refined comparison.
For example:
- Shopping > Apparel > Footwear > Athletic Shoes
How to Use Benchmarking Data To Grow Your Business
Enabling GA4 benchmarking metrics is just the first step.
The real value comes from using the data to improve performance, optimize strategies, and stay ahead of competitors.
Here’s how you can apply benchmarking metrics in GA4 to different areas of your business.
1. Acquisition: Improve New User Growth
- Example Scenario: Your new user rate is lower than the 25th percentile in your peer group.
- Insight: Your competitors are attracting more first-time visitors.
- Action: Invest in SEO, paid ads, and social media campaigns to drive more traffic.
2. Engagement: Increase User Interaction
- Example Scenario: Your engagement rate is below the 25th percentile, while your event count per user is low.
- Insight: Users visit multiple pages but interact less with key elements like buttons, forms, or videos.
- Action: Improve on-page engagement by adding:
- Clear CTAs to guide users toward key actions.
- Interactive elements like quizzes, surveys, or embedded videos.
- Personalized content recommendations to encourage deeper exploration.
3. Retention: Reduce Bounce Rate
- Example Scenario: Your bounce rate is significantly higher than competitors.
- Insight: Users leave quickly, possibly due to slow loading times or irrelevant content.
- Action: Improve p age speed, content relevance, and UX design to keep visitors engaged.
4. Monetization: Boost Revenue per User
- Example Scenario: Your ARPU (Average Revenue Per User) is below the 25th percentile.
- Insight: Competitors are making more money per visitor.
- Action: Use upselling, loyalty programs, and better product recommendations to increase revenue.
How To Analyze GA4 Benchmarking Data
Once you access GA4 benchmarking metrics, the next step is understanding what the data means.
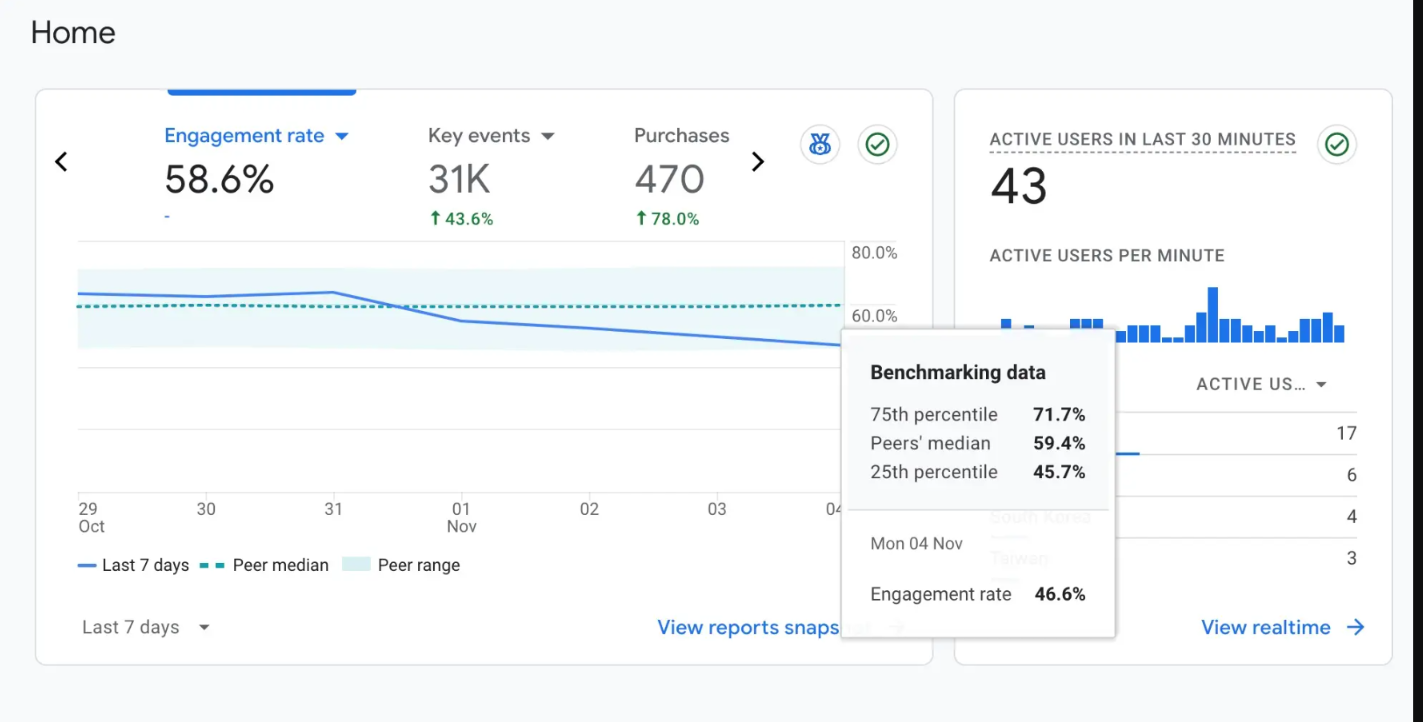
GA4 makes this easy by using percentile comparisons and visual trendlines to show how your performance compares to similar businesses.
GA4 Benchmarking Percentiles
GA4 benchmarking uses three percentile groups to compare your performance:
- 75th Percentile (Top Performers) – The best in your industry. Achieving this level means you’re outperforming 75% of your competitors.
- 50th Percentile (Median) – The industry average. If your metric is here, your performance is typical for your peer group.
- 25th Percentile (Low Performers) – The bottom quarter of businesses in your industry. Falling here indicates room for improvement.
How to Analyze GA4 Benchmarking Percentiles
- If your metric is above the 75th percentile , you’re ahead of most competitors. Identify what’s working and scale those efforts .
- If you’re at the median (50th percentile) , your performance is average. Look for small optimizations to gain a competitive edge.
- If your metric is below the 25th percentile , prioritize improvements in that area, whether it’s user acquisition, engagement, or monetization.
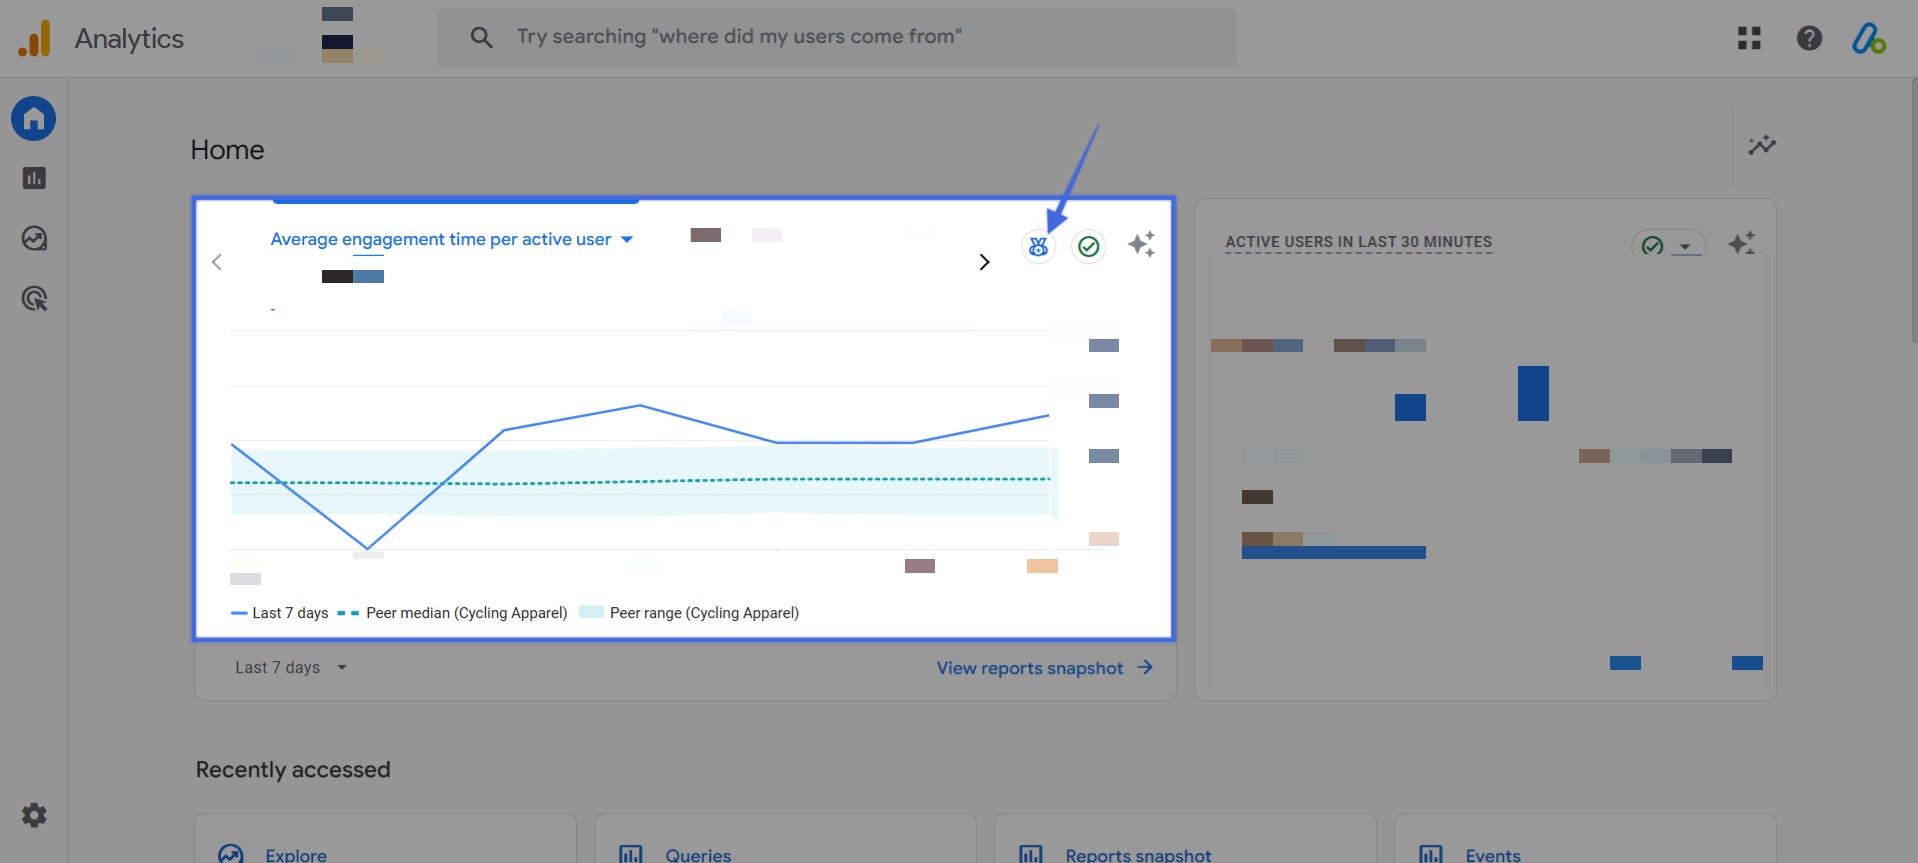
Using Trendlines to Track Progress
GA4 visualizes benchmarking data with trendlines that compare:
- Your performance (solid line)
- Industry median (dotted line)
- Benchmark range (shaded area for 25th-75th percentiles)
You can hover over the trendline to view specific data points over time, making it easy to track progress and adjust strategies accordingly.
Benefits vs. Limitations of GA4 Benchmarking Metrics
GA4 benchmarking metrics can give you great insights into how your business stacks up against the competition. But like anything, it’s not perfect. There are clear benefits, but also some limitations you should keep in mind.
Let’s break it down so you can make the most of the GA4 benchmarking metrics:
Advantages of Benchmarking Metrics in GA4 |
D rawbacks of Benchmarking Metrics in GA4 |
|
Data refreshes every 24 hours, keeping benchmarks up to date. |
You can’t track today’s performance; benchmarks are based on past data. |
|
Your performance is measured against businesses in a similar field. |
GA4 assigns peer groups, so you can’t compare directly with specific competitors. |
|
Your data is encrypted and combined with others, ensuring privacy. |
Some industries may be too broad, making comparisons less precise. |
|
See where you stand with 25th, 50th (median), and 75th percentile benchmarks. |
A low ranking doesn’t always mean failure; external factors like seasonality can influence results. |
|
Pinpoints areas where your site or app can improve. |
Benchmarks represent aggregated data, which may not align with niche markets. |
Benefits of GA4 Benchmarking Metrics
1. Daily Data Updates: GA4 refreshes benchmarking data every 24 hours, ensuring that you always have access to up-to-date industry comparisons.
2. Industry-Specific Comparisons: Benchmarks are based on peer groups that match your business type, allowing for more relevant performance comparisons.
3. Privacy Protection: All benchmarking data is encrypted and anonymized, so businesses can access insights while maintaining data privacy.
4. Percentile-Based Insights: GA4 compares your performance against three key benchmarks:
- 25th percentile (low) – Indicates potential areas for improvement.
- 50th percentile (median) – Represents typical industry performance.
- 75th percentile (high) – Shows top-performing businesses in your sector.
5. Actionable Insights for Growth: Helps businesses i dentify strengths, spot weaknesses, and optimize performance across acquisition, engagement, retention, and monetization.
Limitations of GA4 Benchmarking Metrics
1. Limited Customization: GA4 assigns a default peer group based on industry and site attributes, but this may not always be a perfect match for your business. Unlike competitor analysis tools, GA4 does not allow custom competitor selection.
2. Data Accuracy and Relevance: Benchmarks are based on aggregated industry data, which may not reflect unique business models, niche markets, or seasonal trends. Also, ğeer groups can be too broad, making some comparisons less meaningful.
3. No Real-Time Data Availability: GA4 does not provide same-day benchmarking data, making it less useful for real-time campaign monitoring. The daily update ensures fresh data but does not account for sudden performance changes.
4. Risk of Misinterpretation: A low percentile ranking does not always indicate failure—context matters. Businesses need to analyze multiple metrics together rather than relying on a single benchmark for decision-making.
Should I Use GA4 Benchmarking Metrics?
Despite some limitations, GA4 benchmarking metrics are still a valuable tool for tracking industry trends, optimizing strategies, and improving performance. To get the most out of benchmarking:
- ✔ Use it as a reference point, not an absolute measure of success.
- ✔ Compare multiple metrics together for a well-rounded analysis.
- ✔ Continuously track trends and adjust strategies based on data-driven insights.
Conclusion: GA4 Benchmarking Metrics
GA4 benchmarking metrics give businesses a clear way to compare their performance against industry peers.
With daily updates and over 30 key metrics, it provides valuable insights into acquisition, engagement, retention, and monetization.
No matter your business type, GA4 benchmarking metrics help you compare with industry peers, spot improvement areas, and set data-driven goals.
