Conversion rate is a helpful way to see how many visitors to your website are taking the actions you want them to take, like making a purchase or signing up for more information.
Essentially, it helps you understand how well your site is performing in terms of meeting its goals.
If many users interact with the site and do what they are expected to (for example, adding something to cart), it means that the conversion rate is high.
If only few people convert after having visited your website – this indicates low conversion rate and shows where you should make improvements in order to engage more individuals.
What is a Conversion (Key Event) in Google Analytics 4 (GA4)?
🚨 Important Note : GA4 conversions are now called Key Events. For further information, please take a look at this document on Key Events in Google Analytics 4 .
A conversion is referred to as an important action that a visitor takes on a website or a landing page. Some examples of conversions include:
- Adding a product to a cart / making a purchase
- Creating an account / Registering
- Downloading a file
- Watching a video
- Clicking a specific link
- Booking an appointment
- Filling out a form / Engaging in live chat
- Submitting a review / Participating in a survey
- Subscribing to a newsletter
What is a Conversion Rate in Google Analytics 4 (GA4)?
The conversion rate represents the percentage of visitors who complete at least one action out of the total number of visitors. It is a key metric used to measure the effectiveness of a website or landing page in achieving its goals.
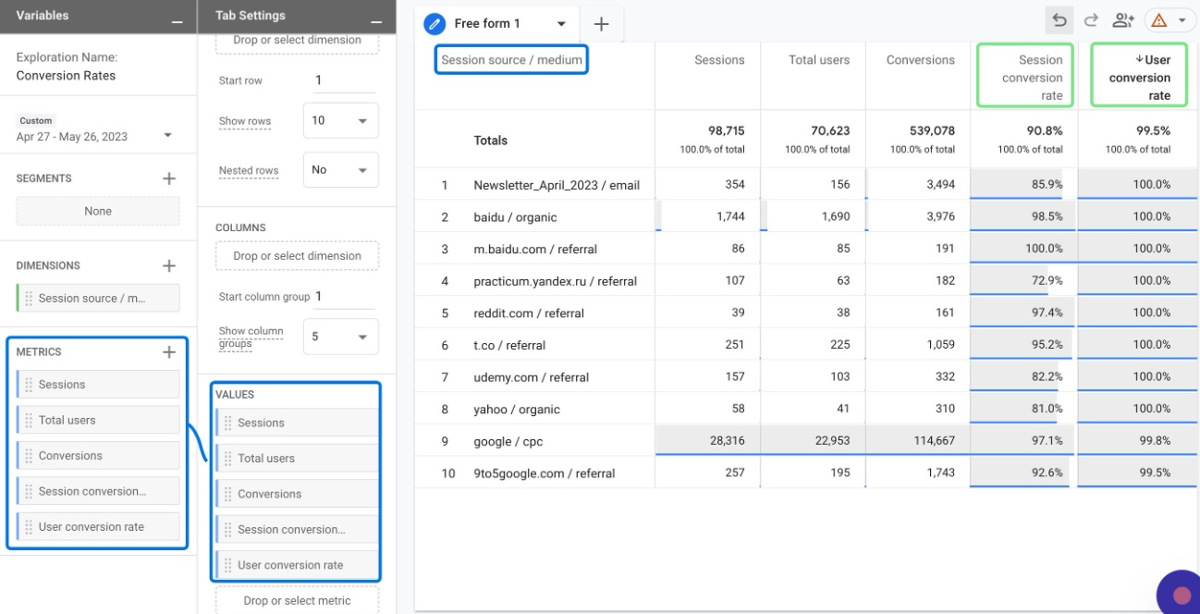
In Google Analytics 4, there are two types of conversion rates:
- Session Conversion Rate: This is the percentage of sessions that result in at least one conversion out of all sessions. A session begins when a user visits your website and ends when they leave or do not interact for approximately 30 minutes. Learn more about GA4 Sessions .
- User Conversion Rate: This is the percentage of individual users who complete at least one conversion during their visit to the site.
How Google Analytics 4 (GA4) Calculates Conversion Rate?
In Google Analytics 4, the conversion rate is calculated by dividing the number of conversions by the total number of sessions. A conversion occurs when a user completes a predefined goal, such as making a purchase or submitting a form.
Unlike Universal Analytics, GA4 allows you to set up multiple conversion events per session, giving you more flexibility in measuring different types of user behaviors.
Besides, GA4 introduces the concept of engagement rate , which is similar to conversion rate but includes additional user actions as part of the calculation, such as scrolling or clicking on a link. In this way, you can see how often users engage with your website or app.
What is Session Conversion Rate in Google Analytics 4 (GA4)?
It is one of the key metrics used in Google Analytics 4 to measure the percentage of sessions that result in at least one conversion out of all sessions.
Let's illustrate the Session Conversion Rate using an example:
- Conversion Event: Newsletter Sign-up
- Session Source: Paid Advertising
- Total Number of Sessions: 5000
- Number of Sessions with Newsletter Sign-ups: 200
- Session Conversion Rate (Paid Advertising) = (200 / 5000) * 100 = 4%
In this scenario, you had a total of 5000 sessions originating from paid advertising campaigns. Out of these sessions, 200 resulted in newsletter sign-ups.
Therefore, the Session Conversion Rate for paid advertising will be 4%.
It's worth noting that Session Conversion Rate is different from User Conversion Rate, which is the percentage of users who complete at least one conversion.
User Conversion Rate is also a useful metric to track, as it gives an indication of how effective a website or landing page is in converting unique visitors into customers.
If your goal is to convert the visitor or user only once, you can set up a conversion event that fires only once per user. In GA4, this can be done by enabling the Conversion modeling feature.
What is User Conversion Rate in Google Analytics 4 (GA4)?
A successful conversion by a user increases the user conversion rate noticeably. But once that conversion is made, the user's conversion rate stays the same as long as they keep visiting your website because they already converted.
Let's consider an example to illustrate the concept of User Conversion Rate with specific conversion events and session sources:
Imagine you have an e-commerce website selling clothing and accessories. If a user make a purchase, you will of course consider this purchase event as a key event.
- Conversion Event: Making a Purchase
- Session Source: Organic Search
- Total Number of Users: 10,000
- Number of Users who Made a Purchase: 500
- User Conversion Rate (Organic Search) = (500 / 10,000) * 100 = 5%
In this case, out of 10,000 users who arrived at your website through organic search, 500 users successfully made a purchase. Therefore, the User Conversion Rate for organic search sessions is calculated to be 5%.
Keep in mind that if the same user makes several purchases, in other words, if multiple conversions occur within the same session, they still count as a single conversion.
How to Find Conversion Rates in Google Analytics (GA4)?
Now, let's shift our attention back to how you can easily visualize the conversion rates in GA4. Follow our step-by-step tutorial to learn how to see conversion rates data in Google Analytics 4.
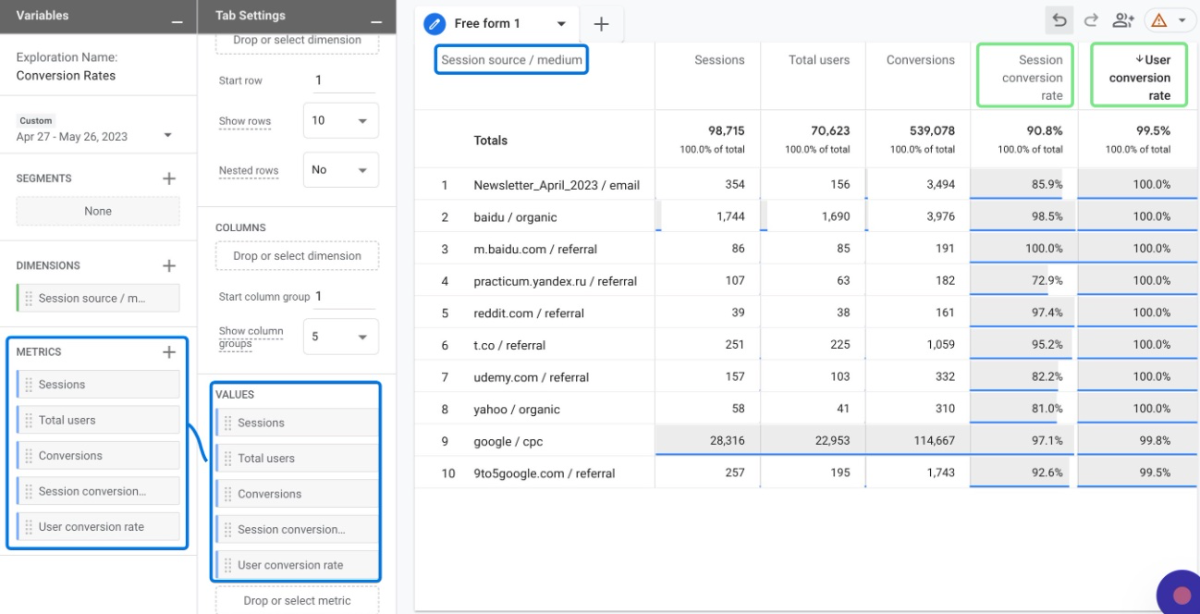
Log in to your Google Analytics account: https://analytics.google.com/analytics
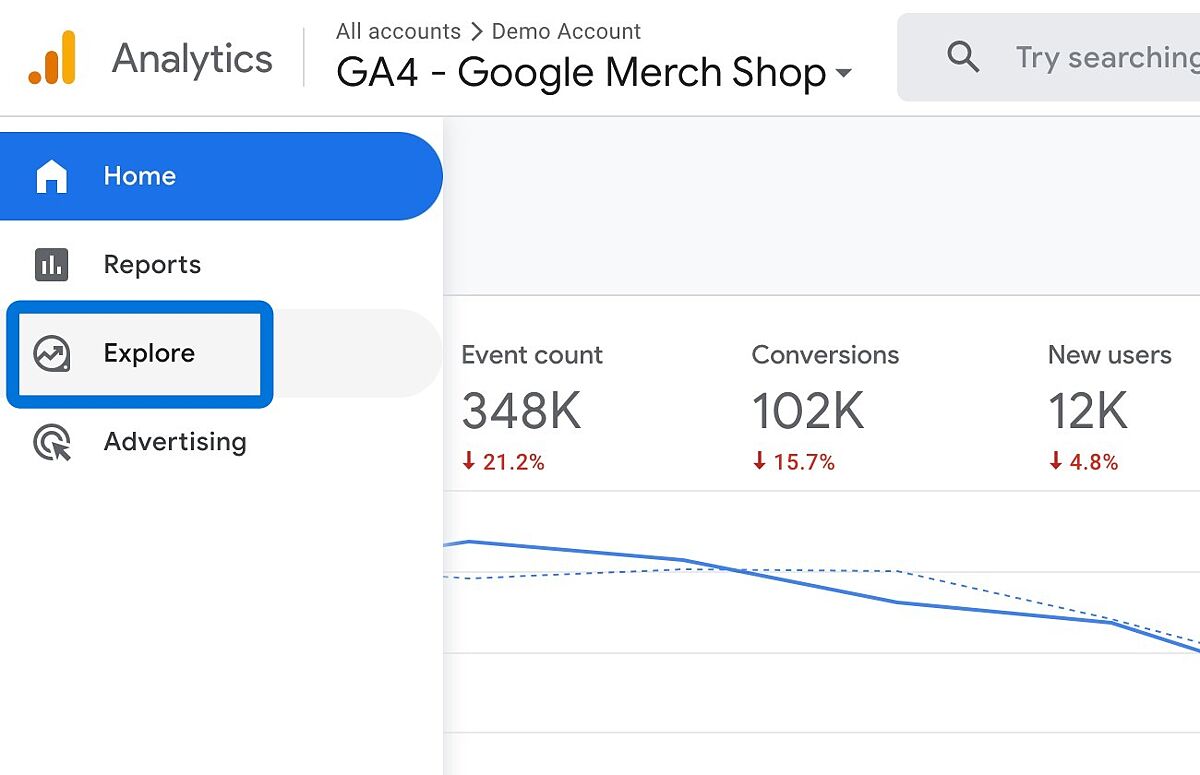
Click on Blank or Free form.
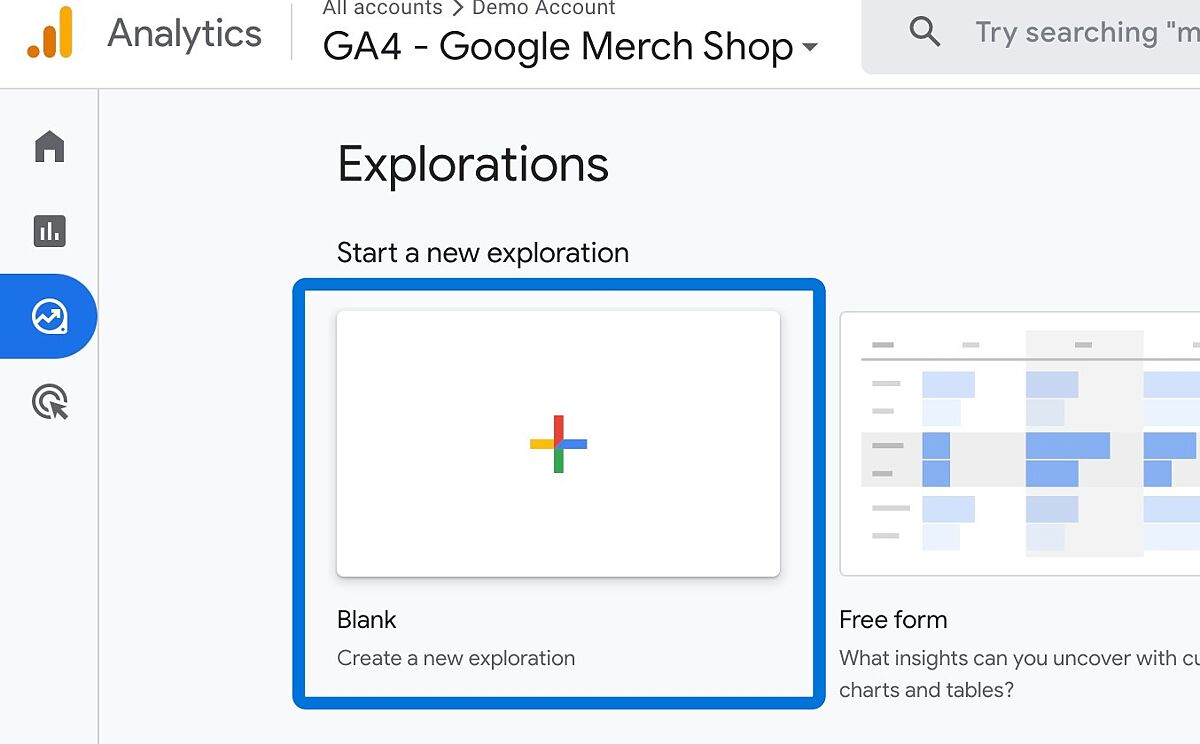
Follow these steps to add a necessary dimension:
Click on the plus button located near the "Dimensions" section. Type "Session" in the search bar. You have the flexibility to choose any of the available dimensions related to sessions. However, the most popular ones are "Session Source Medium" and "Session Default Channel Grouping." Select the desired dimension by clicking on it. Finally, click on the "Import" button to import the chosen dimension.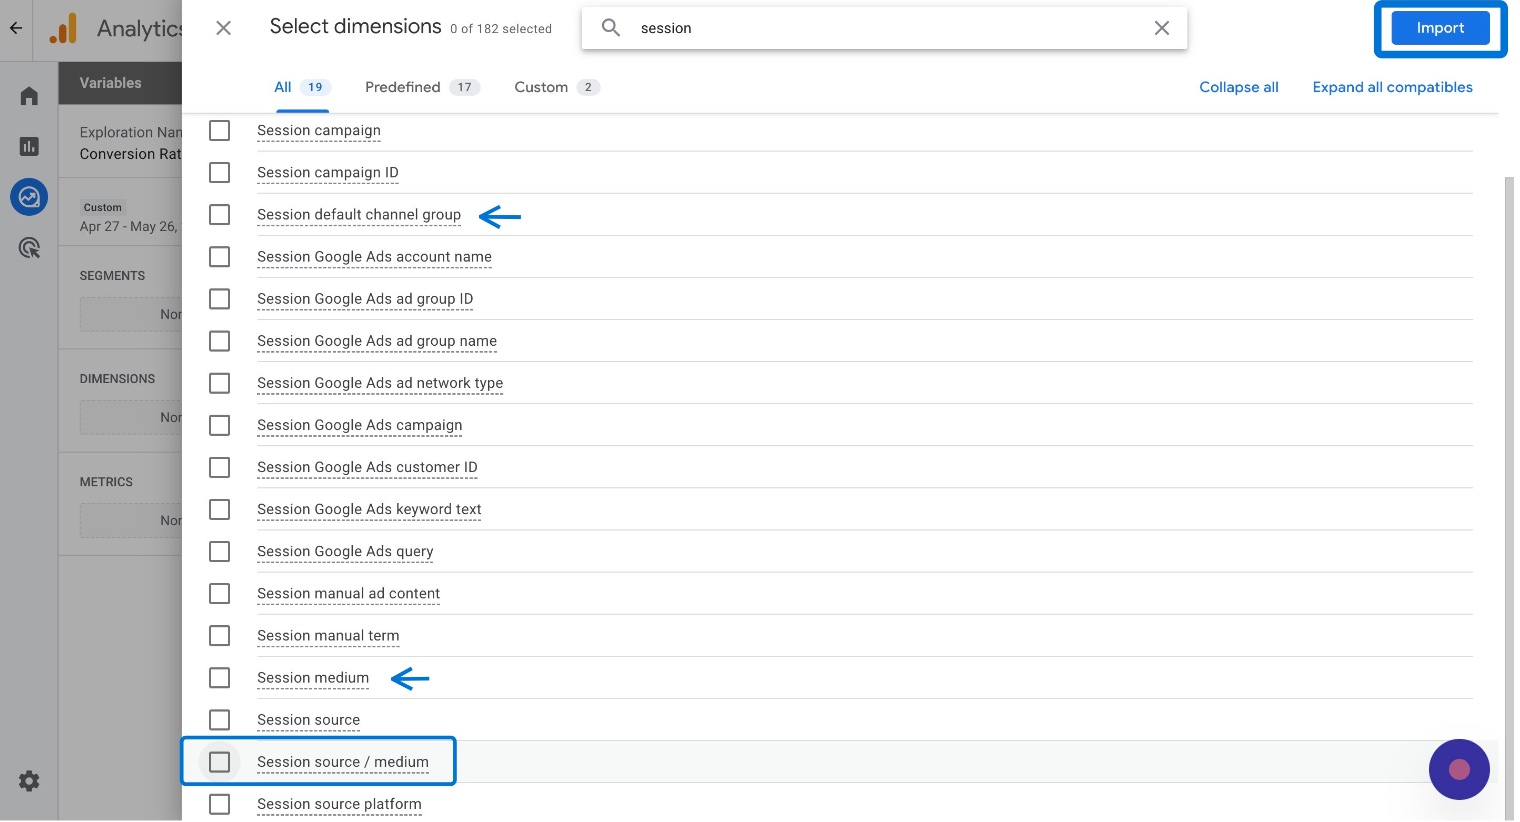
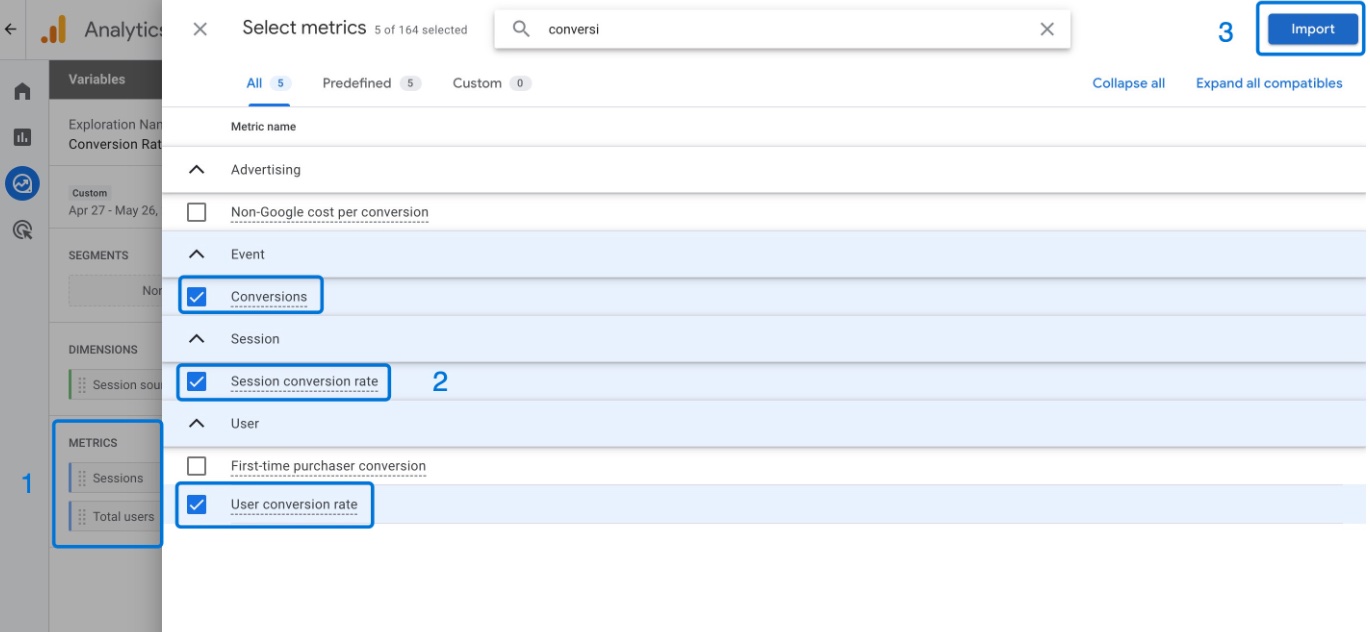
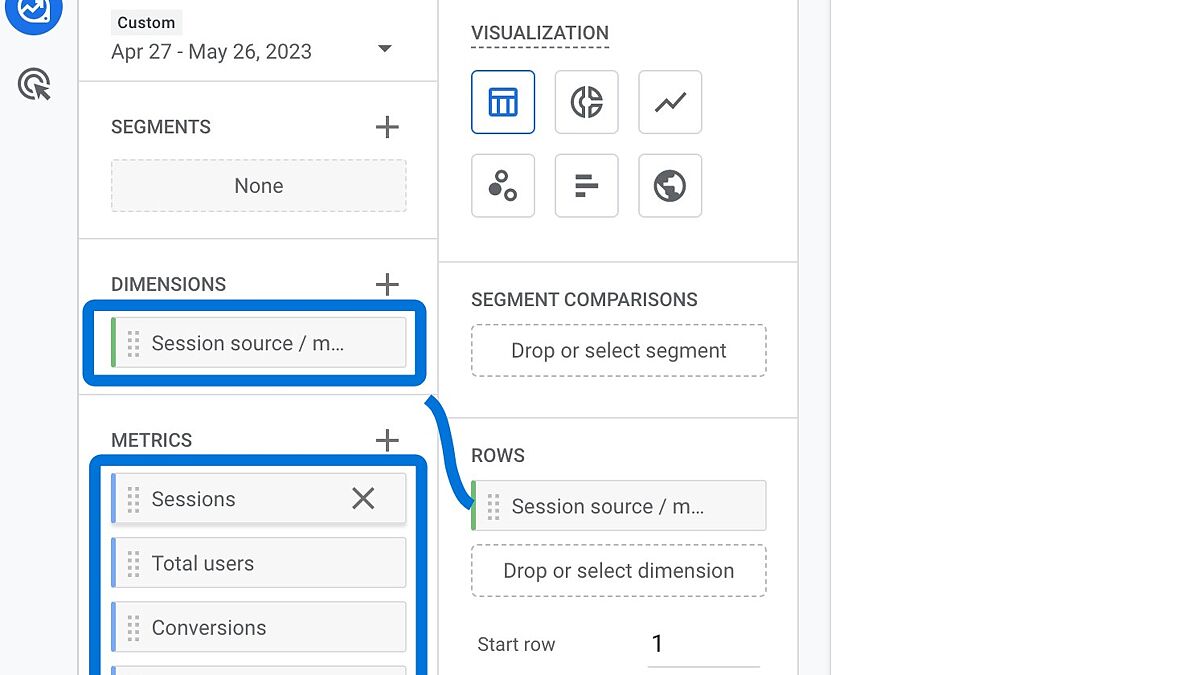
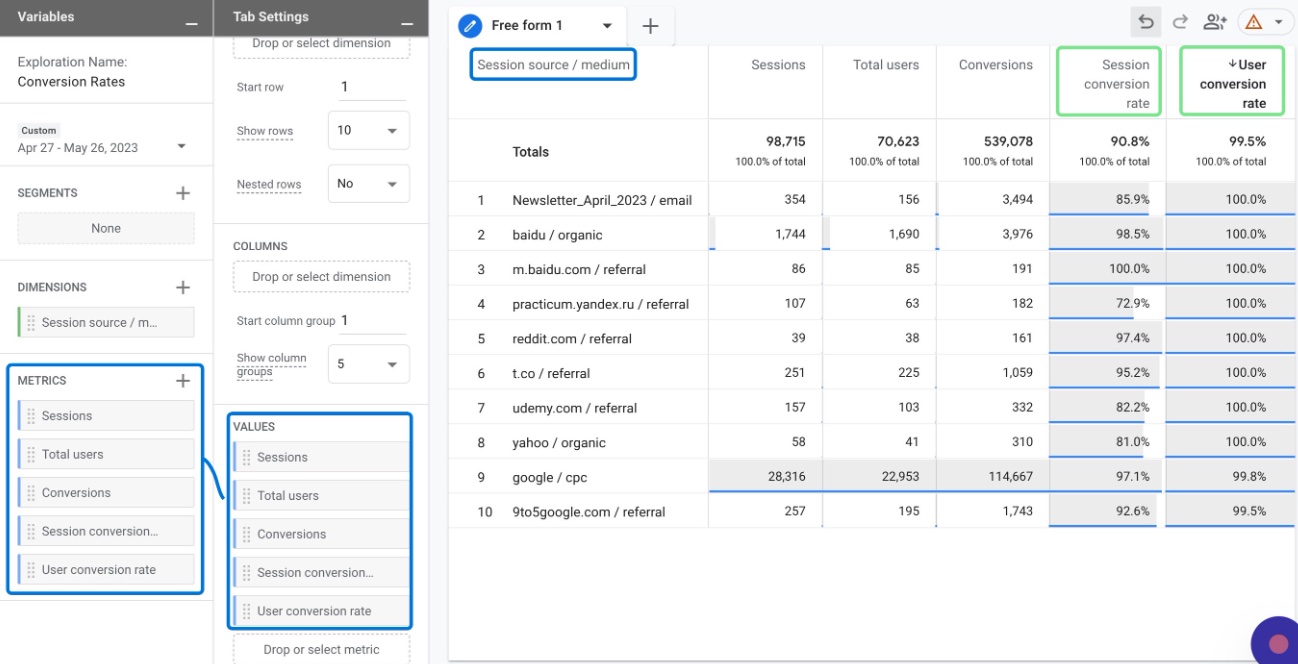
Conclusion: Conversion Rates in Google Analytics (GA4)
Understanding conversion rates in Google Analytics 4 helps you measure how effectively your website turns visitors into customers or leads.
By tracking both session conversion rates and user conversion rates, you gain insight into different aspects of your site's performance.
Session conversion rates show you how effective individual visits are, while user conversion rates reveal how many people eventually complete your key events.
