Key Google Analytics 4 (GA4) metrics hold the secret to your website's performance, but choosing which Google Analytics metrics to track overwhelms many beginners.
When you're not monitoring the most important GA4 metrics daily, you're leaving growth opportunities on the table.
This guide simplifies Google Analytics 4 (GA4) for beginners, highlighting the most important metrics in Google Analytics and how to use them.
10 Important Metrics To Track in Google Analytics (GA4) Every Day
Here are the top 10 most important metrics to track in GA4 daily:
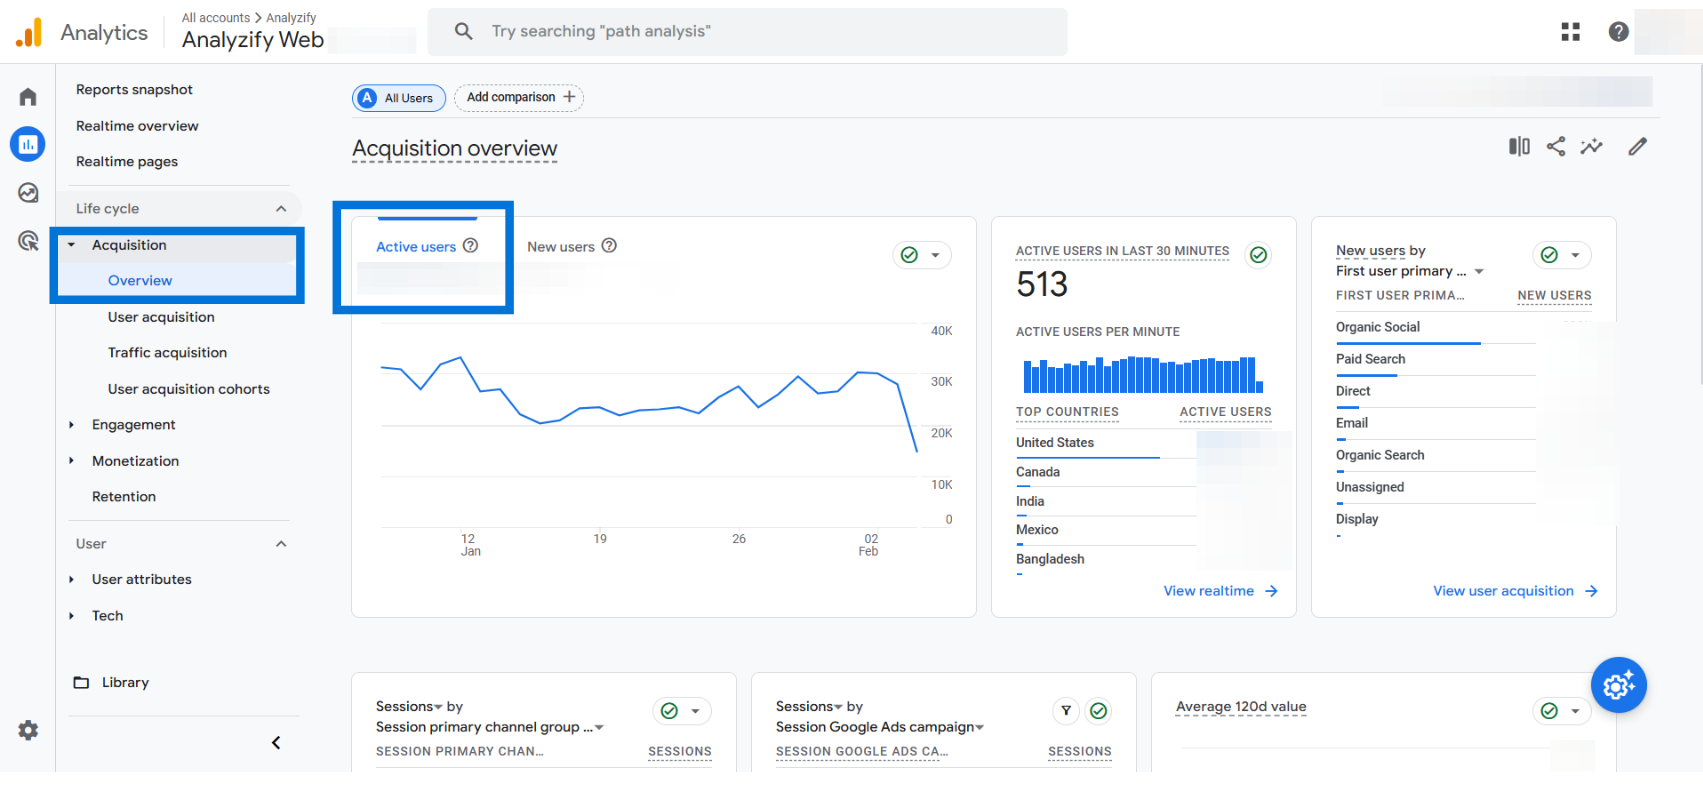
1️. Total Users
The Total Users metric in Google Analytics 4 (GA4) tracks the number of unique visitors to your website within a specific time frame.
Unlike pageviews, which count every visit, this metric focuses on individual users, providing a clearer picture of your audience size.
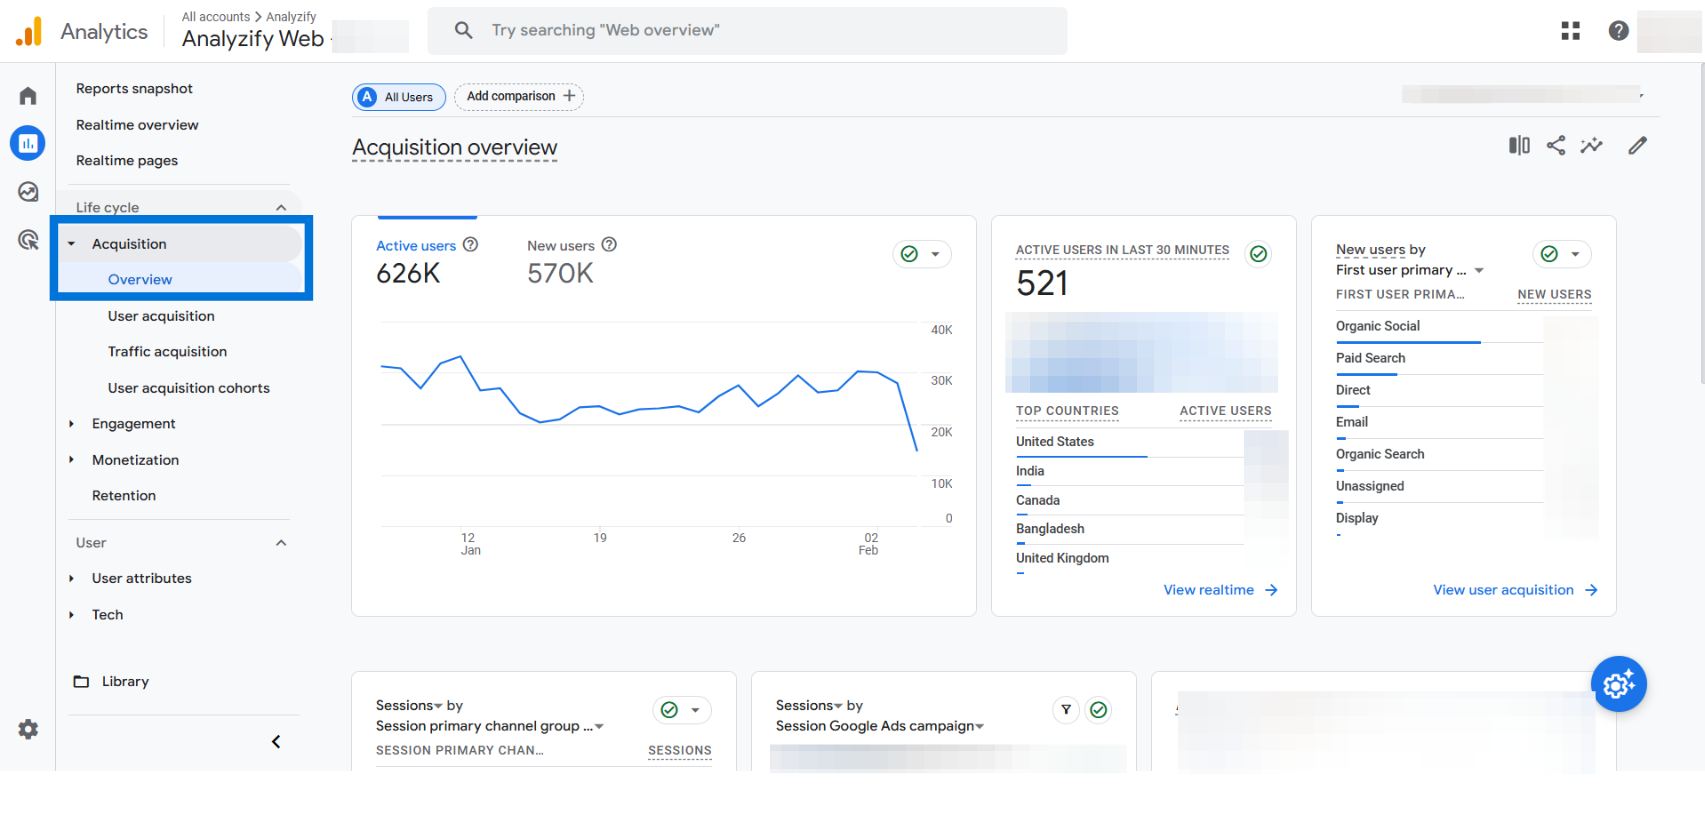
How to Track Total Users in GA4
- Go to Reports > Life cycle > Acquisition > Overview
- Locate the Total Users metric to see the number of unique visitors.
What Should You Check: Compare trends to spot spikes or drops, review traffic sources to see where users come from, and adjust marketing strategies to improve growth and retention.
2. Views (Pageviews)
The Pageviews metric in Google Analytics 4 (GA4) tracks the total number of times any page on your website has been viewed.
This includes repeated visits by the same user, making it a valuable metric for understanding content engagement.
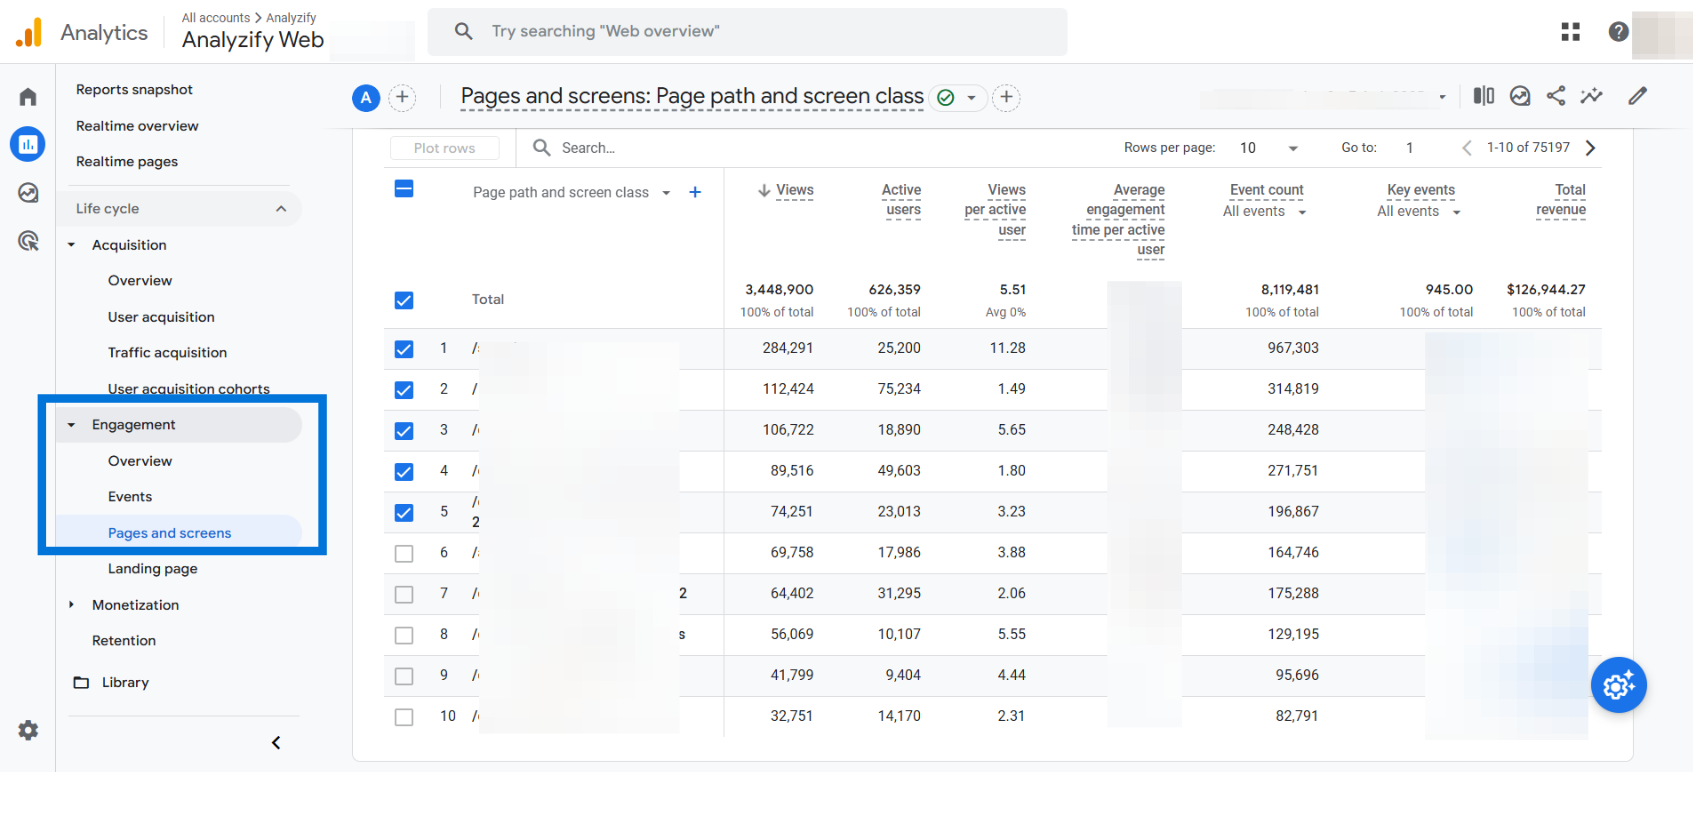
How to Track Pageviews in GA4
- Go to Reports > Life cycle > Engagement > Pages and Screens
- Find the Views column to see the total number of pageviews for each page.
What Should You Check: Find top-viewed pages and optimize for conversions, track pageview trends for spikes or drops, and improve low-performing pages with better content, layout, and internal links.
3. Session (Session Start)
The Sessions metric in Google Analytics 4 (GA4) tracks the number of individual browsing sessions on your website. A session starts when a user visits your site and ends after 30 minutes of inactivity by default, though this duration can be adjusted in the settings. A session also ends when a user leaves the site.
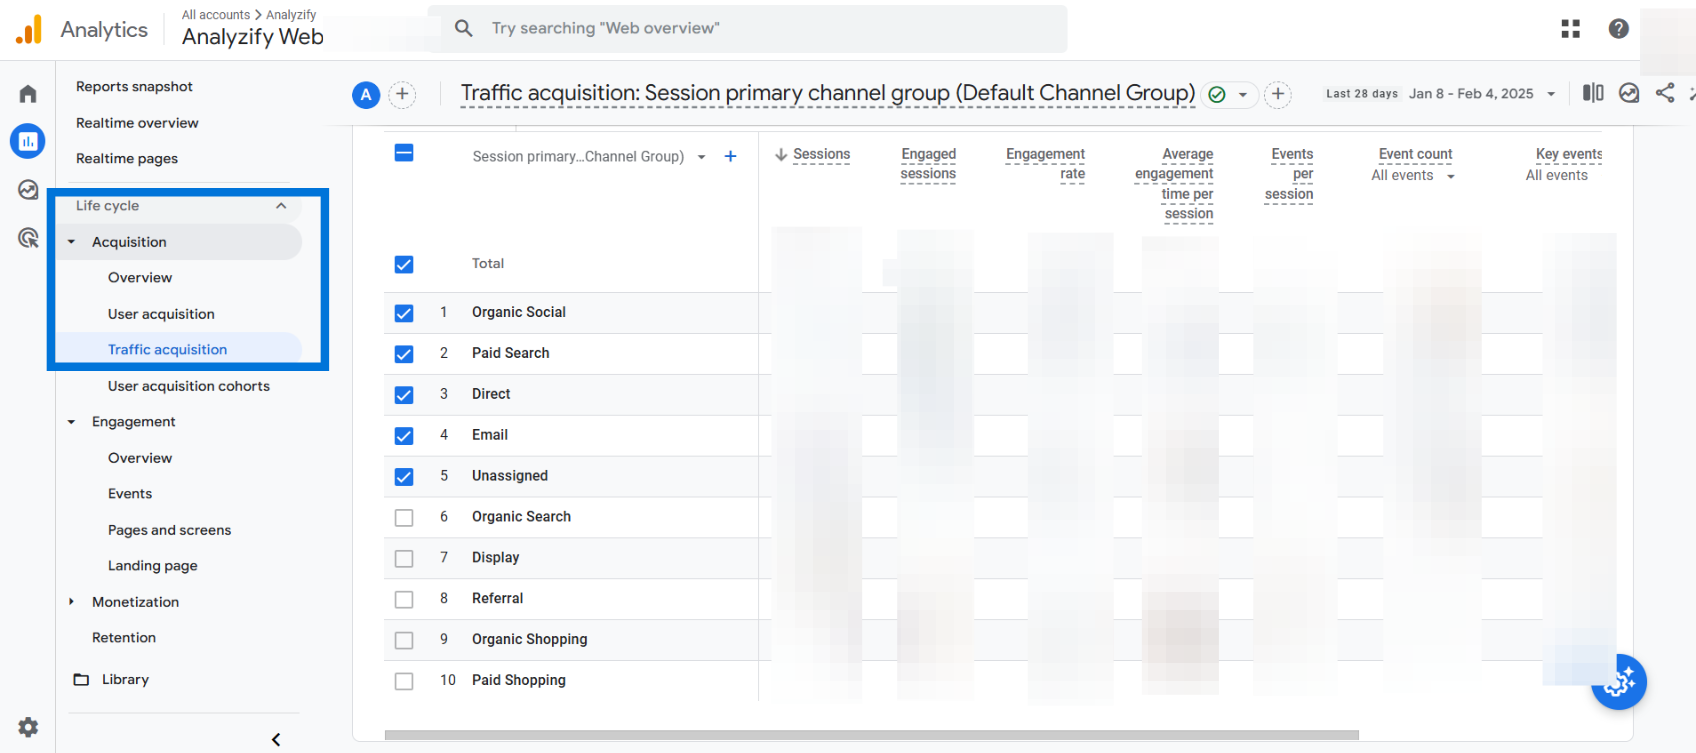
How to Track Sessions in GA4
- Go to Reports > Life cycle > Acquisition > Traffic Acquisition
- Find the Sessions column to view the total number of sessions.
What Should You Check: Monitor session trends for sudden changes, analyze top traffic sources for optimization, and enhance content and user experience to increase session length and frequency.
4. Key Events
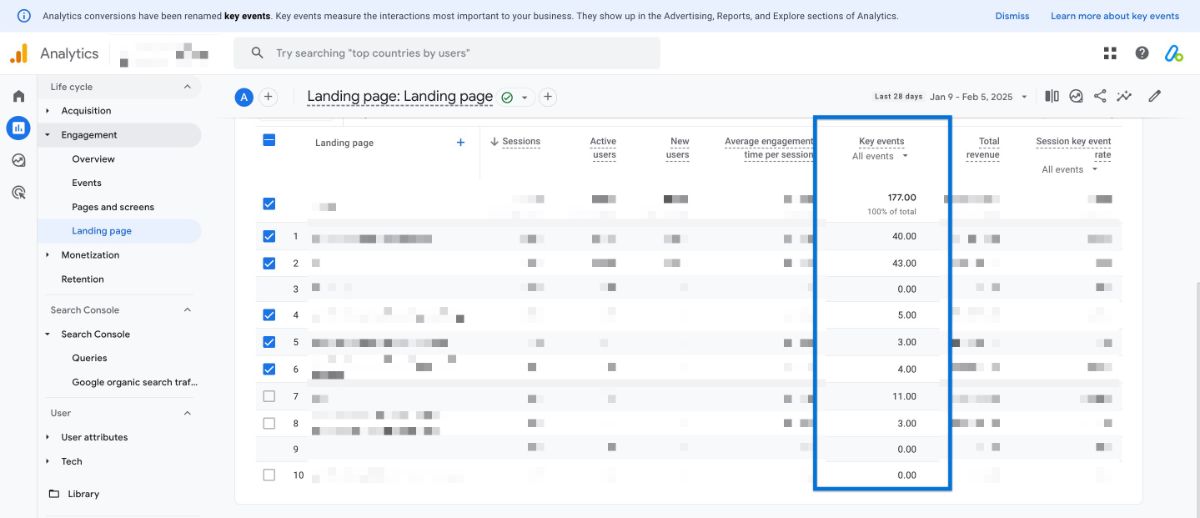
The Key Events metric in Google Analytics 4 (GA4) tracks the number of times users complete predefined actions on your website.
These actions can include purchases, signups, form submissions, or any other goal that contributes to business growth.
How to Track Conversions in GA4
- Go to Reports > Life cycle > Engagement > Landing Pages
- View the total number of conversions and analyze trends over time.
What Should You Check: Track top traffic sources for conversions and adjust resources, monitor daily trends for spikes or drops, and optimize landing pages, calls to action, and checkout processes.
5. Bounce Rate
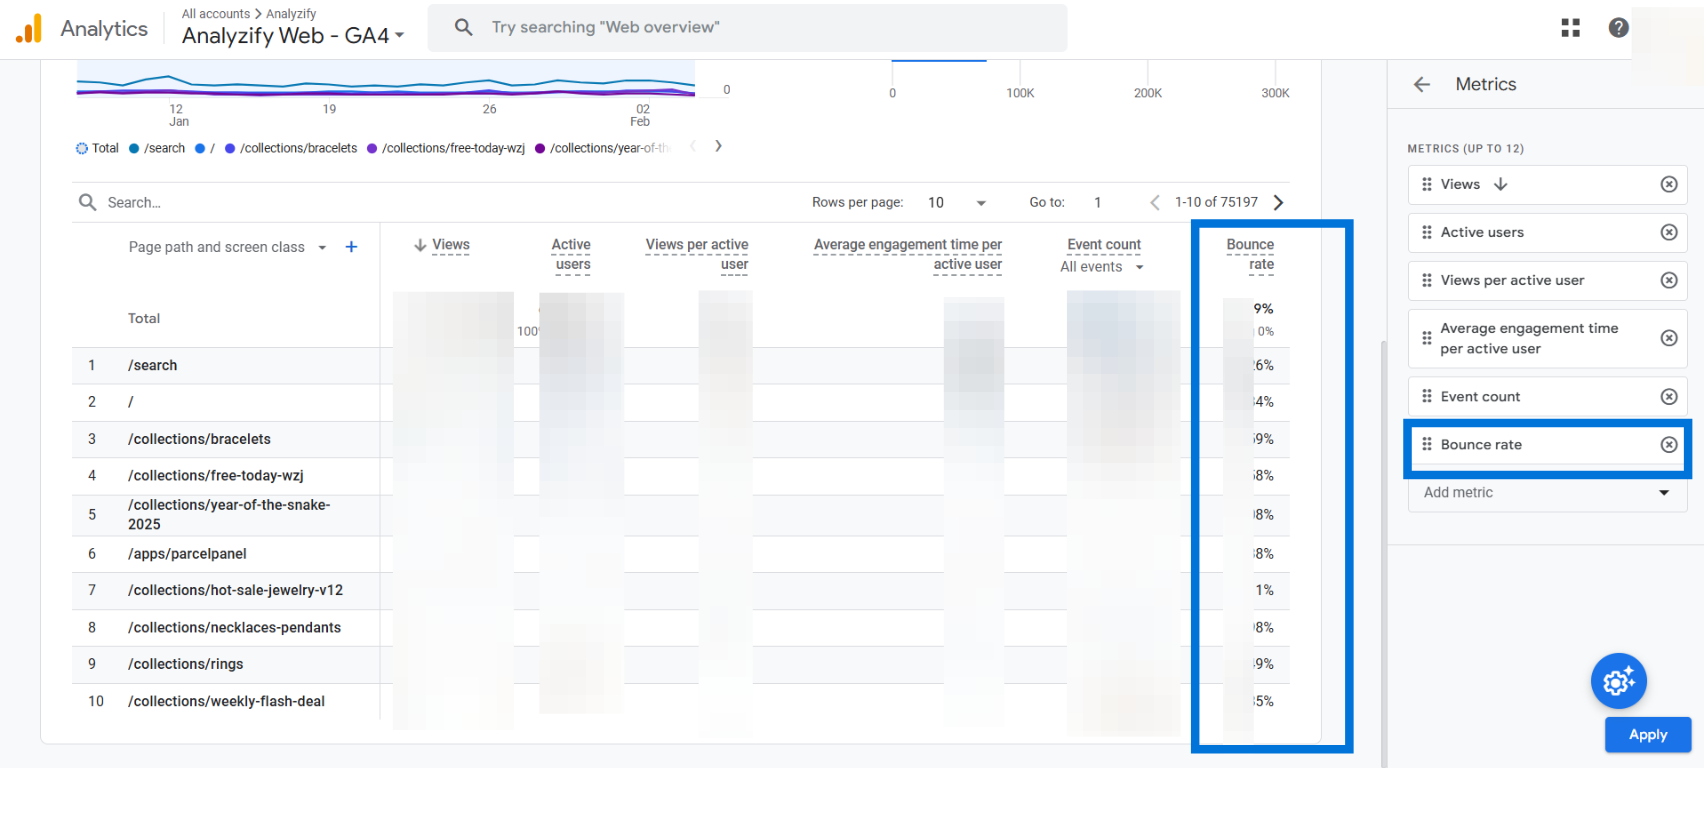
The Bounce Rate in Google Analytics 4 (GA4) measures the percentage of sessions where users leave the site within 10 seconds without interacting or viewing another page.
A high bounce rate often indicates that users are not finding the content engaging or relevant.
How to Track Bounce Rate in GA4
- Go to Reports > Life cycle > Engagement > Pages and Screens
- Customize the report by adding Bounce Rate as a metric.
What Should You Check: Find pages with high bounce rates and assess issues, enhance content clarity and navigation for better engagement, and optimize page speed to reduce early exits.
6. Event Count
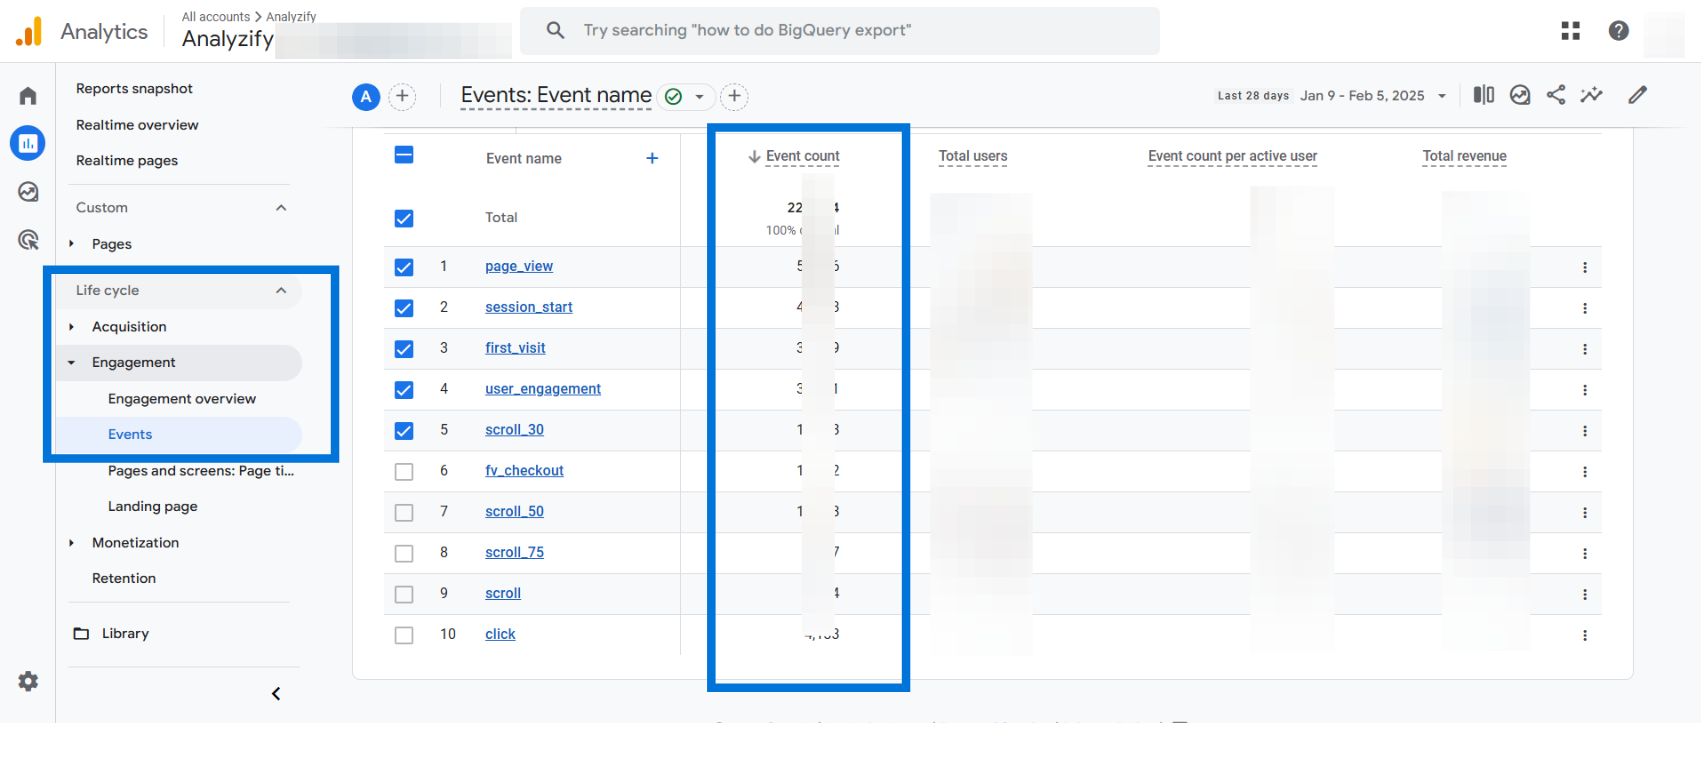
The Event Count metric in Google Analytics 4 (GA4) tracks the total number of interactions users perform on your website.
Events include actions like page views, button clicks, video plays, form submissions, downloads, and scroll depth.
Unlike previous versions of Google Analytics, GA4 is event-based, meaning every user interaction is recorded as an event.
How to Track Event Count in GA4
- Go to Reports > Life cycle > Engagement > Events
- View the Event Count column to see the total number of events triggered.
What Should You Check : Analyze frequently triggered events and optimize for conversions, monitor engagement trends to enhance interactions, and compare event performance across pages to boost user engagement.
7. Sessions Per User
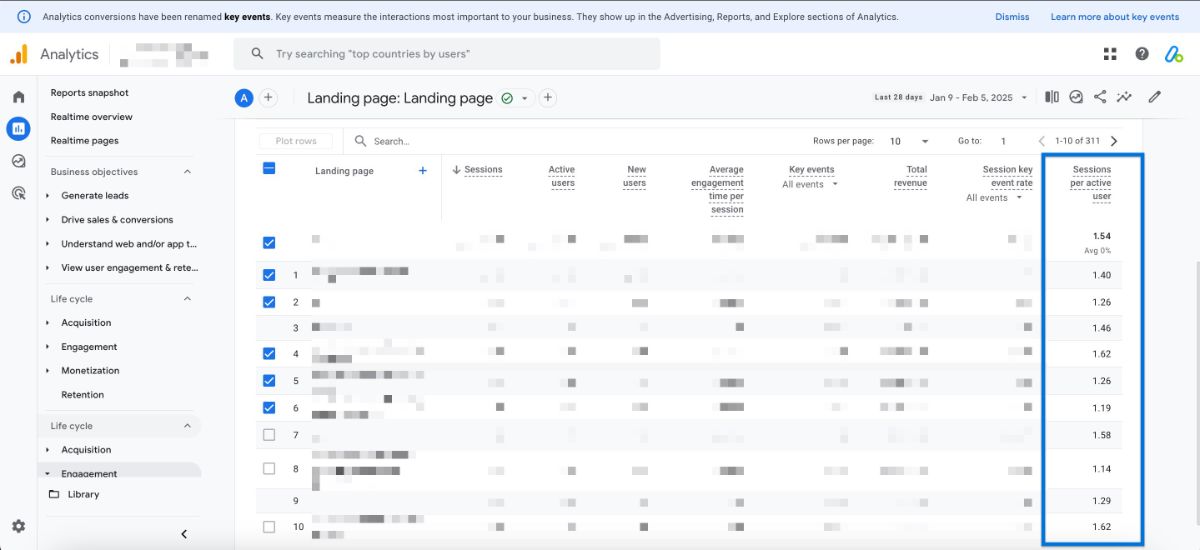
The Sessions Per User metric in Google Analytics 4 (GA4) measures how often an individual user returns to your website within a given period on average. This helps determine user retention and engagement levels over time.
How to Track Sessions Per User in GA4
- Go to Reports > Life cycle > Landing Page (or any other report where we want to add this variable)
- Customize > Metrics > Add Metric > Session Per Active Users > Save > Save changes to current report
- Locate the Sessions Per User metric to see how often users return.
What Should You Check: Track session changes to spot shifts in user behavior, refine content and email strategies to increase repeat visits, and optimize high-performing pages while improving weaker ones.
8. Active Users
The Active Users metric in Google Analytics 4 (GA4) tracks the number of users who have engaged with your website within a specific time frame.
GA4 categorizes this into 1-day, 7-day, and 30-day active users, helping businesses analyze short-term and long-term user retention.
How to Track Active Users in GA4
- Go to Reports > Life cycle > Retention
- View the Active Users section to analyze engagement trends.
What Should You Check: Analyze active user trends over different time frames to track retention, identify top-performing marketing channels, and enhance content and user experience to drive repeat visits.
9. New Users
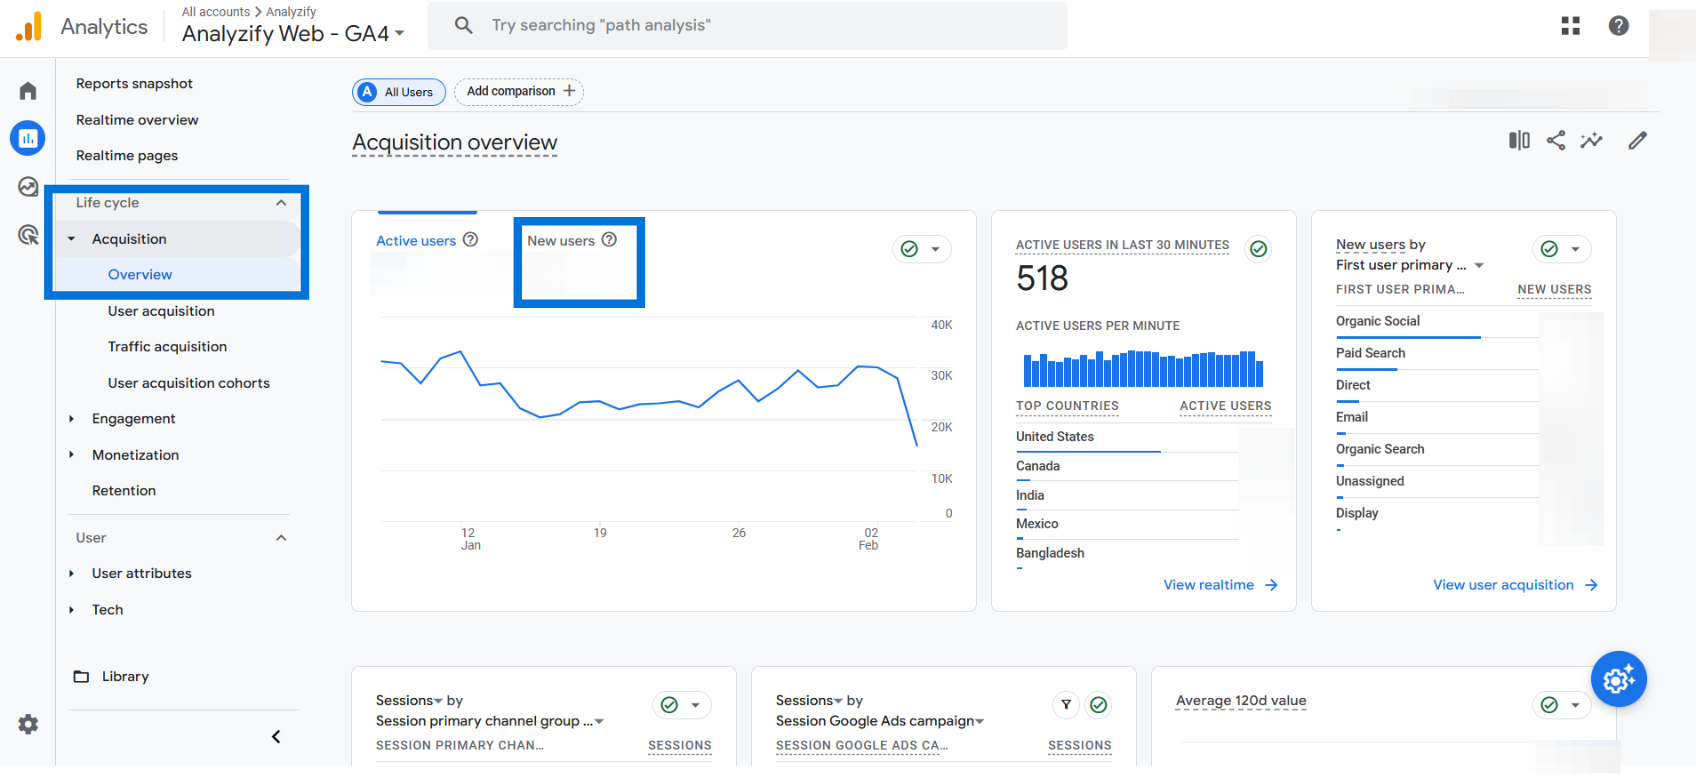
The New Users metric in Google Analytics 4 (GA4) tracks the number of first-time visitors to your website within a selected time frame.
It helps businesses understand how well their marketing efforts attract fresh audiences.
How to Track New Users in GA4
- Go to Reports > Life cycle > Acquisition > Overview
- Locate the New Users metric to see the number of first-time visitors.
What Should You Check: Track spikes or drops in new users to evaluate marketing performance, identify top traffic sources, and refine SEO, paid ads, and social media strategies to boost new user acquisition.
10. Engagement Rate
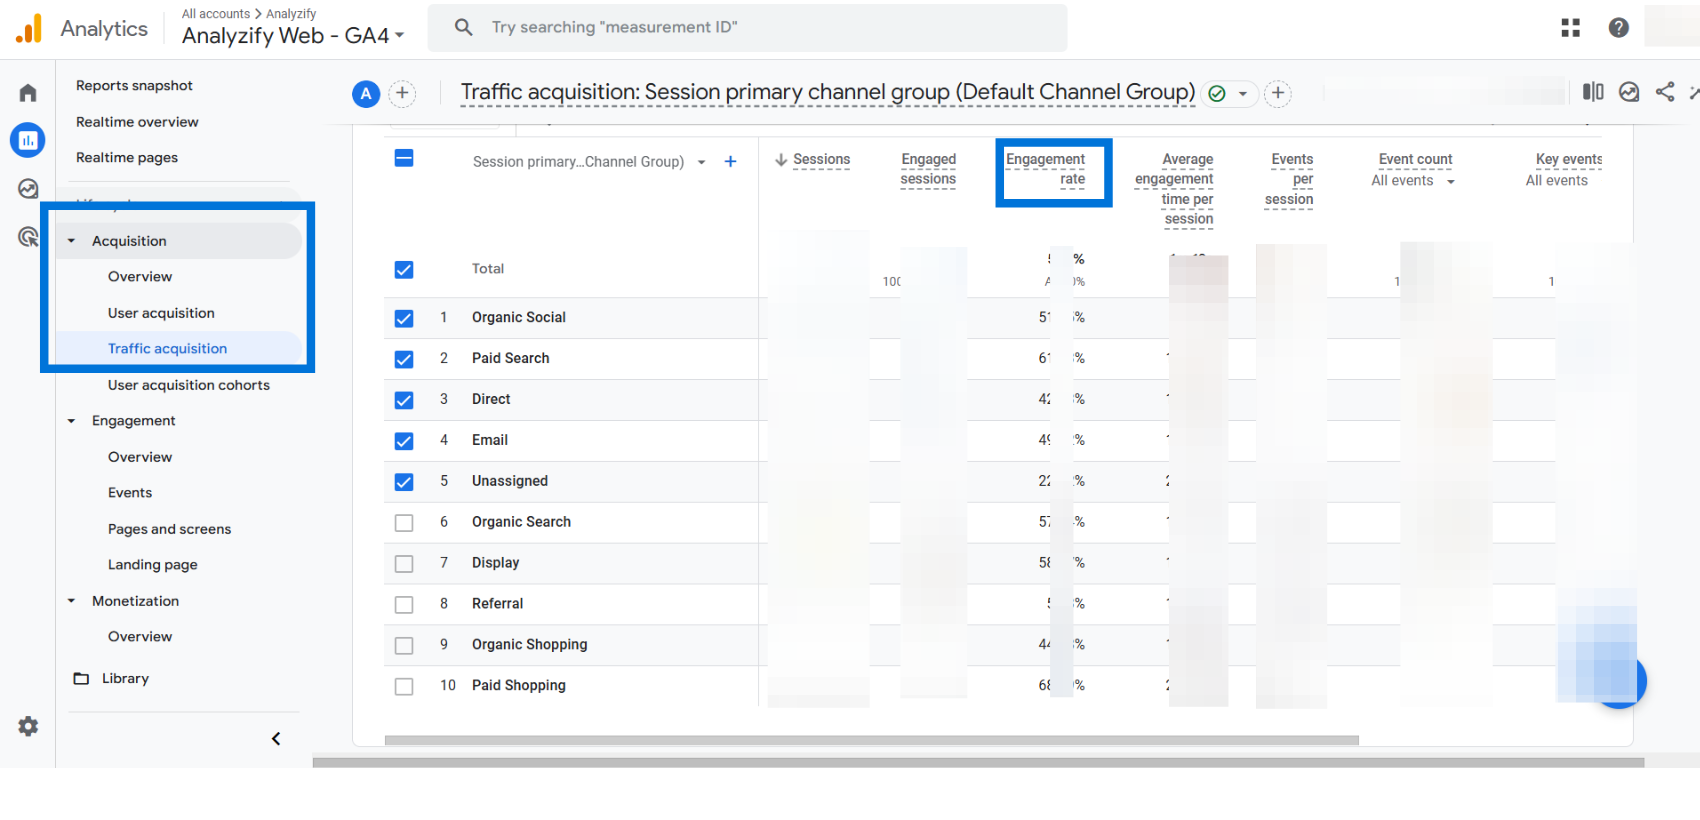
The Engagement Rate metric in Google Analytics 4 (GA4) measures the percentage of sessions that are considered engaged. A session is classified as engaged if it lasts longer than 10 seconds, includes at least two pageviews, or results in a conversion event.
How to Track Engagement Rate in GA4
- Go to Reports > Life cycle > Acquisition > Traffic Acquisition
- Find the Engagement Rate column to analyze engagement trends.
What Should You Check: Analyze top traffic sources for engagement and optimize weaker ones, enhance content and navigation for better user experience, and compare engagement rates across pages to find areas for improvement.
FAQ: Google Analytics 4 (GA4) Metrics for Beginners
Here are the frequently asked questions about the key Google Analytics 4 (GA4) metrics for beginners:
1. What are the most important Google Analytics 4 metrics to track daily?
The key GA4 metrics to track daily include Total Users, Pageviews, Sessions, Conversions, Bounce Rate, Event Count, Sessions Per User, Active Users, New Users, and Engagement Rate. These provide insights into user behavior, website engagement, and marketing performance.
2. How do I check total users in GA4?
Go to Reports > Life cycle > Acquisition > Overview to see the number of unique visitors to your site.
3. What is the difference between Pageviews and Sessions?
Pageviews count how many times pages are viewed, even if by the same user. Sessions track visits where users interact with your site before leaving or becoming inactive.
4. How do I track conversions in GA4?
Go to Reports > Life cycle > Engagement > Conversions to see how many users completed important actions like purchases, signups, or downloads.
5. What is the bounce rate, and how can I reduce it?
Bounce Rate is the percentage of users who leave quickly without interacting. To lower it, improve page speed, content clarity, and website navigation.
6. Why is event count important?
Event Count tracks actions like clicks, form submissions, and video plays. It helps measure user engagement and identify what content or features drive interactions.
7. How can I see where my website traffic comes from?
Go to Reports > Life cycle > Acquisition > Traffic Acquisition to check which sources bring visitors, such as Google Search, social media, or paid ads.
8. How do I track new and returning users?
Check New Users under Reports > Life cycle > Acquisition > Overview. To track returning visitors, customize the User Acquisition report by adding the "Returning Users" metric.
Conclusion
Understanding Google Analytics for beginners starts with tracking the right Google Analytics metrics to track daily.
Metrics like Total Users, Sessions, Conversions, Engagement Rate, and Bounce Rate help you analyze user behavior, improve website performance, and optimize marketing strategies.
By consistently reviewing the important metrics in Google Analytics, you can identify trends, fix issues, and refine your content and advertising efforts.
The more you use Google Analytics 4 metrics, the better insights you gain to drive growth, improve user engagement, and increase conversions.
