Considering data models, infrastructure, capabilities, interface, and user experience; Google Analytics 4 and Universal Analytics are almost two different products.
Here, you will find out what lies at the heart of GA4 and get a better understanding of how things work.
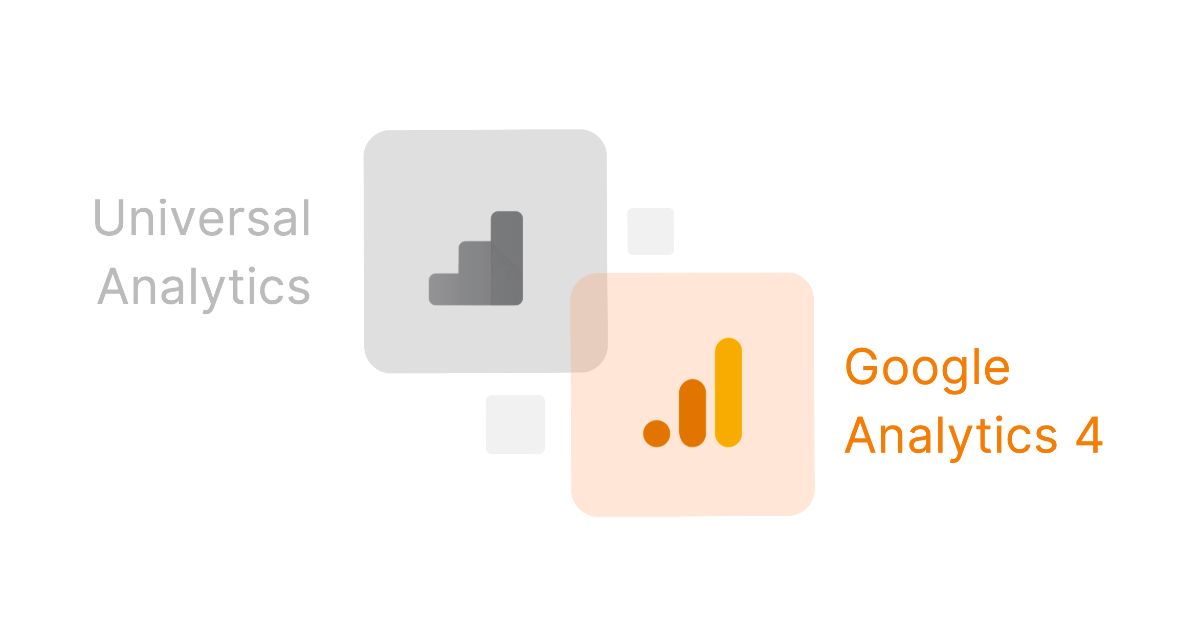
Differences Between Universal Analytics and Google Analytics 4
Let's focus on how Google Analytics 4 works in terms of technical, strategic, and reporting features compared to Universal Analytics(UA).
Different Data Models
The most significant change lies at the core. GA4 collects data using an event-based method, whereas UA collects data using a hit-based one. Here is what it means briefly:
There are various hit-types in Universal Analytics, such as PageView, Social, Transaction, and so on. On the other hand, they are all considered GA4 Events with different names and parameters in GA4. It allows you to have access to a complete set of reports and capabilities.
Reporting Interface
There is a larger report interface due to the removal or modification of familiar reports and metrics.
Also, when you log in to the panel, you see that you have fewer GA4 reports than what you have in UA. However, you can create alternative report templates and a variety of data with some manual setup.
Bounce Rate and Engagement Rate
You don’t see bounce rates in GA4 metrics. Instead, there is a new metric called engagement rate . It measures the time spent on the landing page as well as monitoring the visitors who do not switch to another page on your site.
IP Anonymization
Under GDPR, your IP address is considered personal data. In Universal Analytics, you had to configure IP addresses to anonymize in order to comply with GDPR legislation. With Google Analytics 4, IP addresses are automatically anonymized.
Data Retention
Your data on GA4 expires after 14 months by default while Universal Analytics retains your data almost indefinitely. In Universal Analytics, you can choose to retain data with options for 14 months, 26 months, 38 months, 50 months, and auto expiration.
GA4 offers you two options for data retention : 2 months and 14 months. While a year-to-year comparison is still possible, accessing your historical data will no longer be possible. Yet, you can retain historical data if you start migrating your GA4 data to BigQuery early on.
AI And Machine Learning
GA4 provides smart business insights powered by by AI and machine learning, making it possible for you to have a deeper and better understanding of your data based on prospective predictions.
More Cross-Device Reporting
While UA's cross-device reporting is fairly restricted, GA4 is completely designed for this with its new data streams methodology and event-based data collecting model.
You can track down multiple devices using separate streams on a single GA4 property, and combine sessions and reports across devices.
Enhanced Google Signals
You can utilize Google Signals much better with GA4. Google Signals, integrated with GA4, allows you to see how users engage with your website across devices and sessions offering you improved personalization.
Automated Event Tracking
GA4 lets you track many events such as user_engagement, session_start, page_view, and first_visit automatically using dataLayer. The Enhanced Measurement feature lets you monitor file downloads, video engagement, site search, outbound clicks, and scrolls without any additional setup.
Session
In UA, a session is a combination of pageview , event, transaction, or more performed by a single user within a given time frame (usually 30 minutes). The user can do one or all of these in a session. So, a session stands as a container for all the actions a user takes while on your site. In addition, a user can open more than one session - on the same day or at different times following it. There are two methods by which a session ends.
- Time-based expiration:
After 30 minutes of inactivity at midnight
- Campaign change:
A user arrives through one campaign, leaves, and then returns via another one.
In GA4, there is a sessions dimension and an additional 'session_start' event allowing you to see the session information. When a session starts, Google automatically collects session id and session number via the 'session_start' event.
Session ID identifies the session from which an event occurs. For example, two different session IDs are generated when a user has two separate sessions on your site.
Session number defines the number of sessions a user has initiated up to their current session (for example, a user's third or fifth session on your site)
Analytics calculates the number of sessions that take place on your site or app by estimating the number of unique session IDs.
With an update in October 2021, Google Analytics changed the calculation method for more accurate data in session count.
If you use both BigQuery and Explore reports and compare your session rates, you can see differences in the number of sessions.
Considering all these, you should view the results in BigQuery when you need more precise results from your raw data.
When you want more efficient results, it’s a better idea to view the results in your standard and custom reports and in Explorations and Data Studio.
GA4 session numbers may be lower than UA session numbers. This is because GA4 does not create a new session when the campaign source changes mid-session and in this case UA creates a new session.
Dimension / Metric
Dimensions in UA included 4 scopes: hit, session, user, and product - and these dimensions were added via GTM according to the index they received in the UA panel. GA4, however, utilizes event and user scopes instead of 4 different scopes.
In other words, everything the user does is counted as an event. In addition, user scope is used in a user-related situation while session scope is expected to return as stated by Google.
After selecting the dimension name, definition, scope, and matching parameter in the panel, data flow to this dimension starts. The important parts here are:
From the moment you define the dimension, data flows to that dimension, it does not receive historical data.
You could define 20 dimensions and 20 metrics in UA. This changed from 360 to 200 in accounts. In GA4 accounts; you can define 50 event scopes, 25 user scope dimensions, and 50 metrics. If your account is 360, these numbers change as follows; 125 event scopes, 100 user scope dimensions, and 125 metrics.
Especially, you must define the dimension within the parameters added as custom on the app side, otherwise, you cannot report them in the GA4 panel. If you don't have enough space for these definitions or you want to see more raw data, you should use BigQuery because you can see the historical data without having to make a specific definition.
Here is an article on custom dimensions and metrics in GA4 .
Users
In Universal Analytics, there are two User metrics: Total Users, and New Users. In Google Analytics 4, there are three User metrics: Total Users, Active Users, and New Users .
Total User is a primary metric in UA and gives the total number of users. In the GA4 panel, it also gives the total number of users, but it is not the primary metric.
In UA, the New Users metric gives the number of users who interacted with your site for the first time. In GA4, it returns the number of users who interacted with your site for the first time, started your app for the first time, or triggered the first_open event.
An active user is a GA4 metric that is not available in UA. This metric is GA4's primary user metric. An active user consists of an interacted session or collection of these events:
- the 'first_visit' event or 'engagement_time_msec' parameter from a website
- the 'first_open' event or 'engagement_time_msec' parameter from an Android app
- the 'first_open' or 'user_engagement' event from an iOS app
User is used as the reported metric in both GA4 and UA, but the value this metric represents is the Total user in UA and active user in GA4.
