Note: Configure section is no longer available in GA4.
The Configure section allows you to perform some customizations and configurations on the GA4 panel.
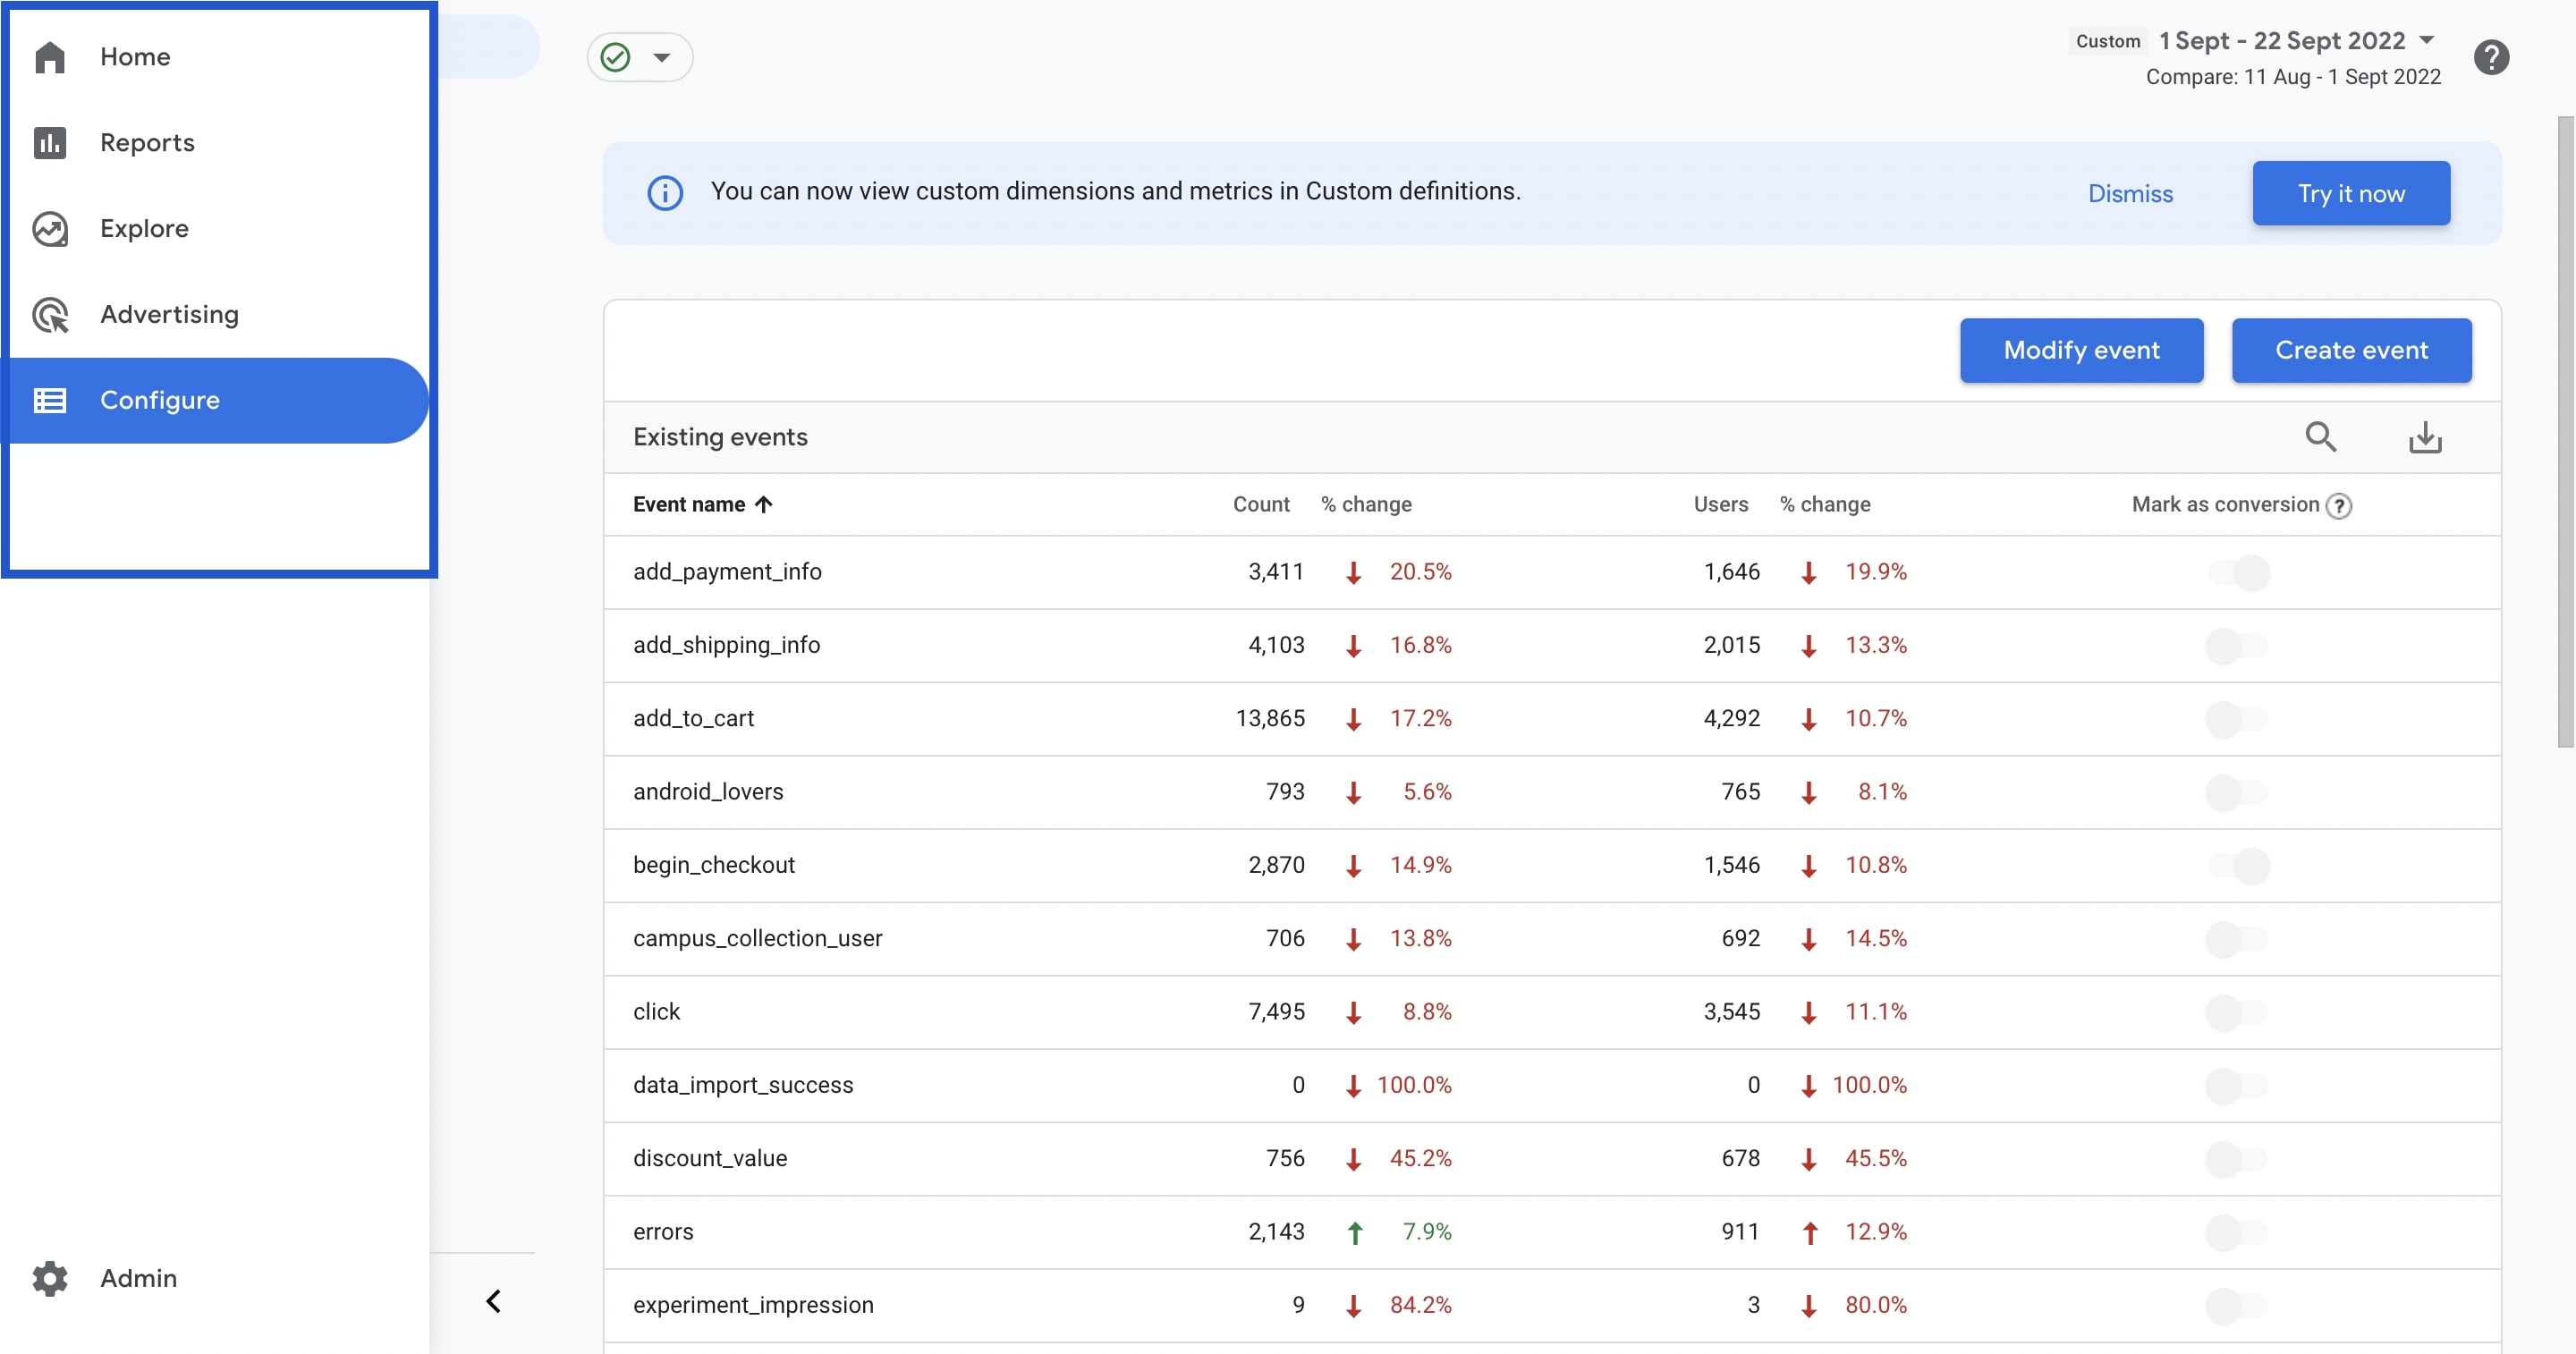
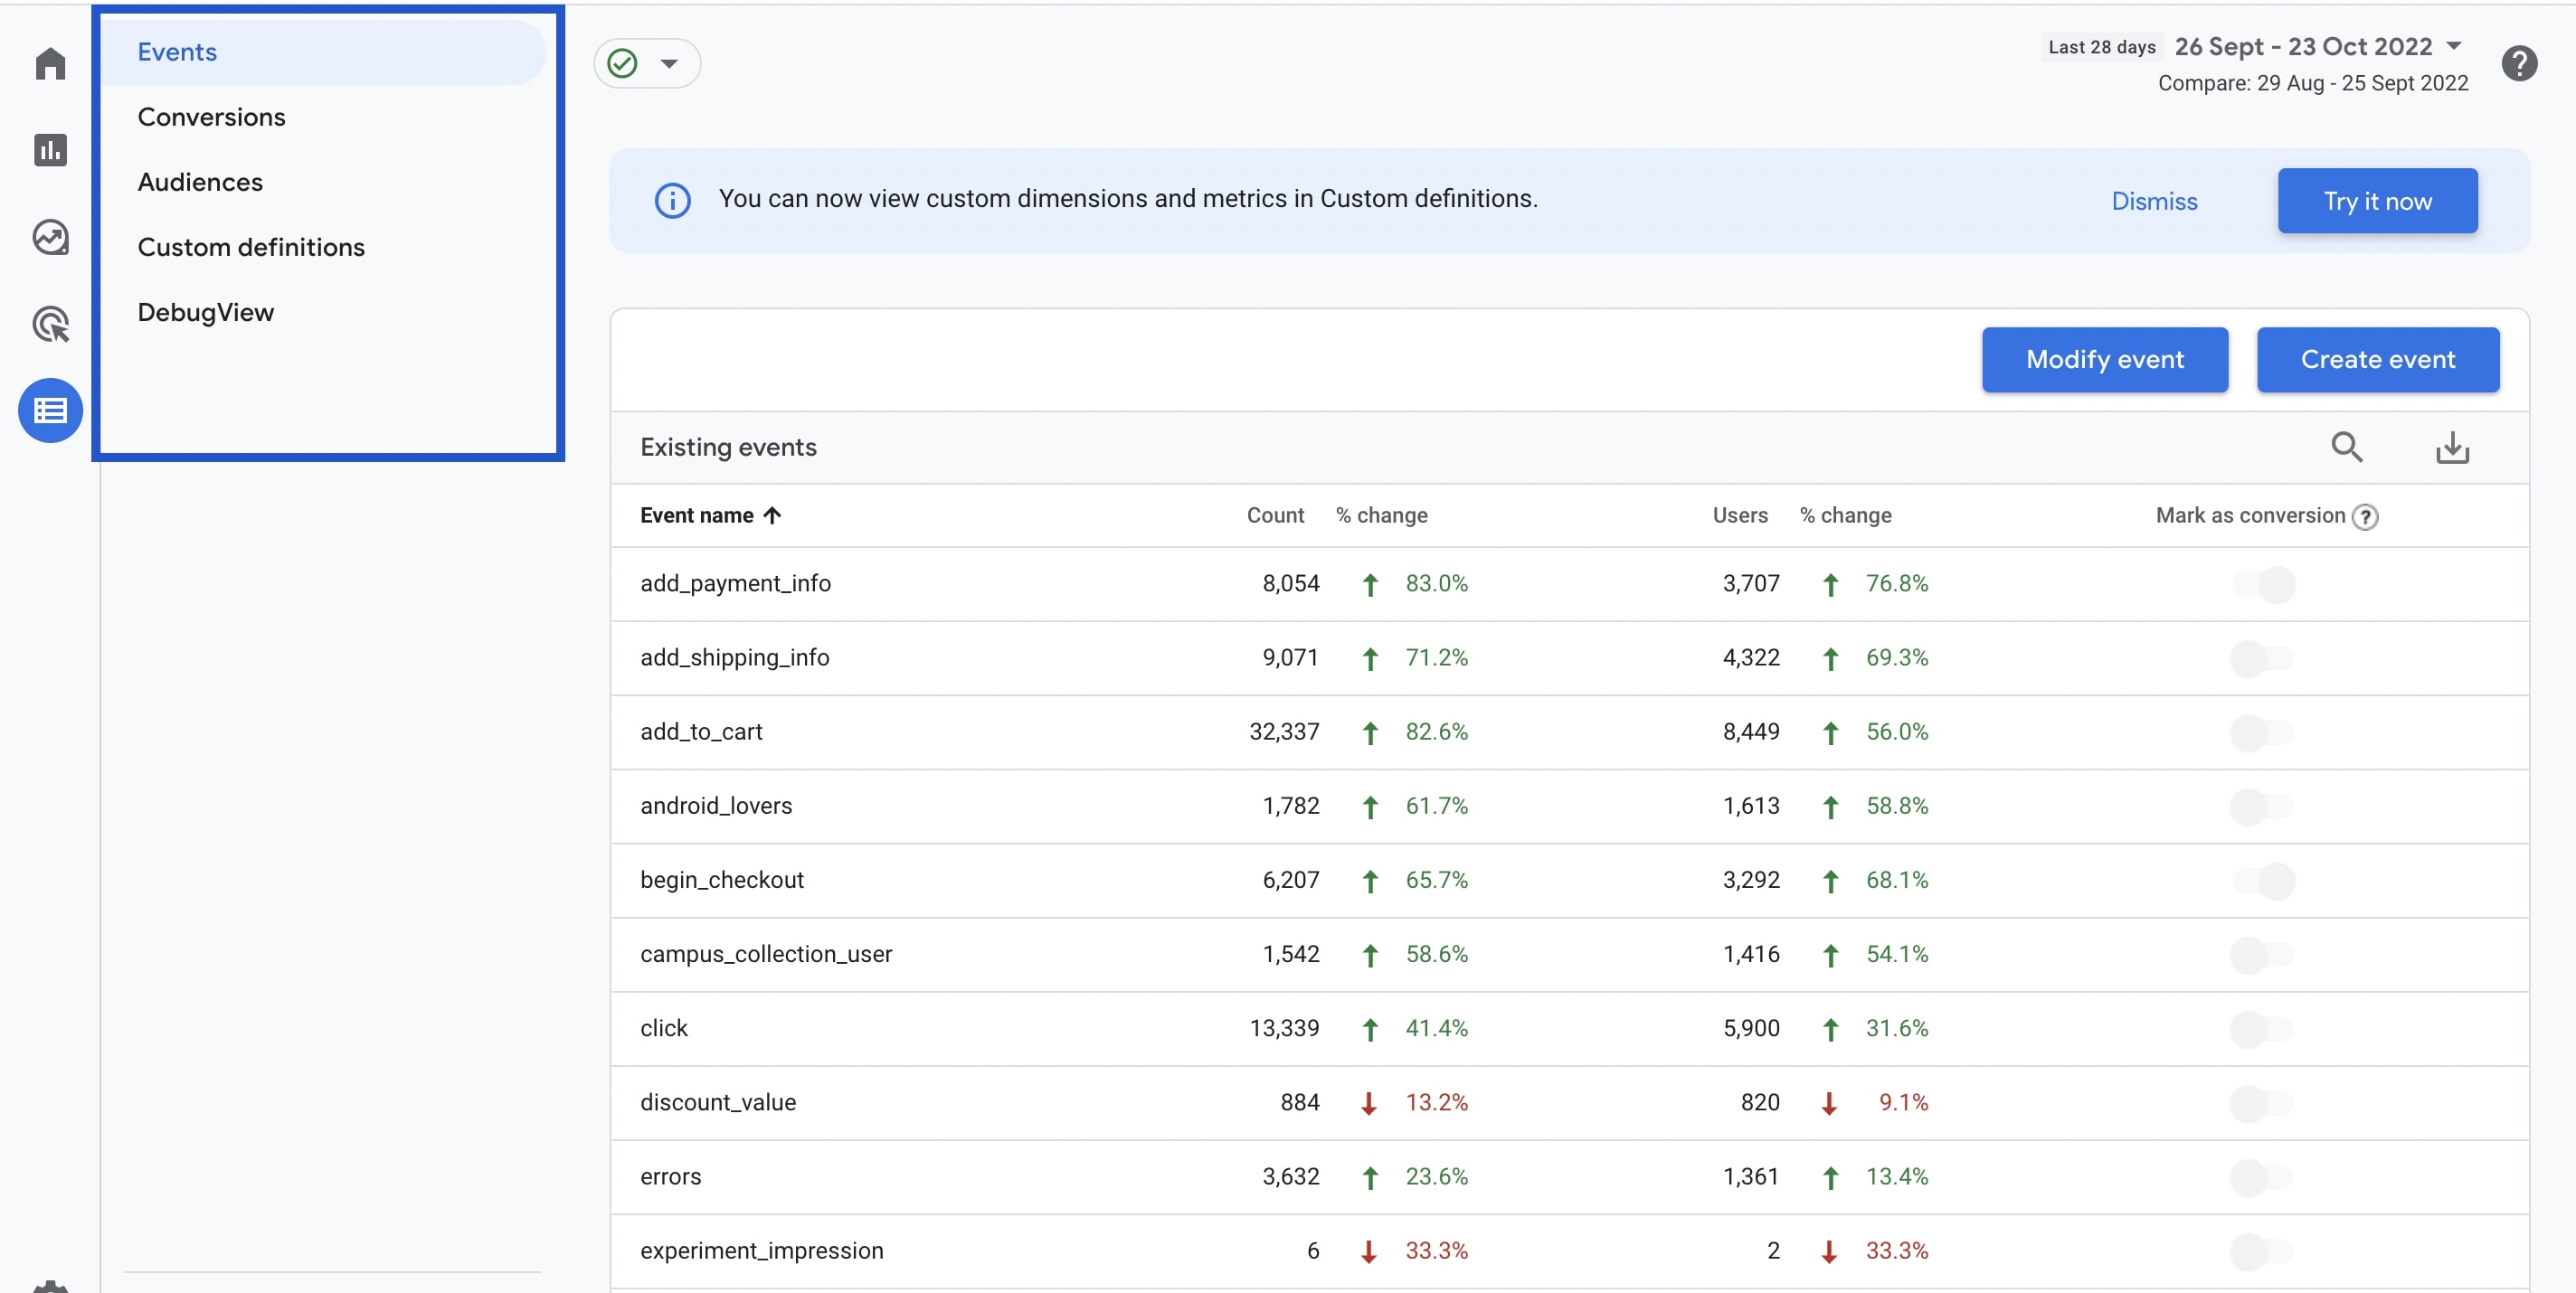
You can edit events, create conversions and audiences, add custom definitions and provide live data flow control with debug view.
Events
An event allows you to measure different user interactions on your website or app. For example, you can follow events such as clicking a button, loading the page, etc.
Automatically collected events are events that Google Analytics collects by default when you set up the Google gtag or Tag Manager snippet on your website or your SDK in your app.
Enhanced measurement events are events that Google Analytics collects from websites when you enable the enhanced measurement on Google Analytics.
Some adjustments are required for event types to be visible on Analytics:
Recommended events are events that you implement but that have predefined names and parameters. They are collected and reported automatically.
Custom events are events that you define as custom. You can use these custom events when no other events work for your use case. Custom events do not appear in most standard reports, so you need to make custom reports for meaningful analysis.
Here, you can see how often your event was triggered, how many users were triggered, and the rate of change between certain dates. You can also mark your events as conversions.
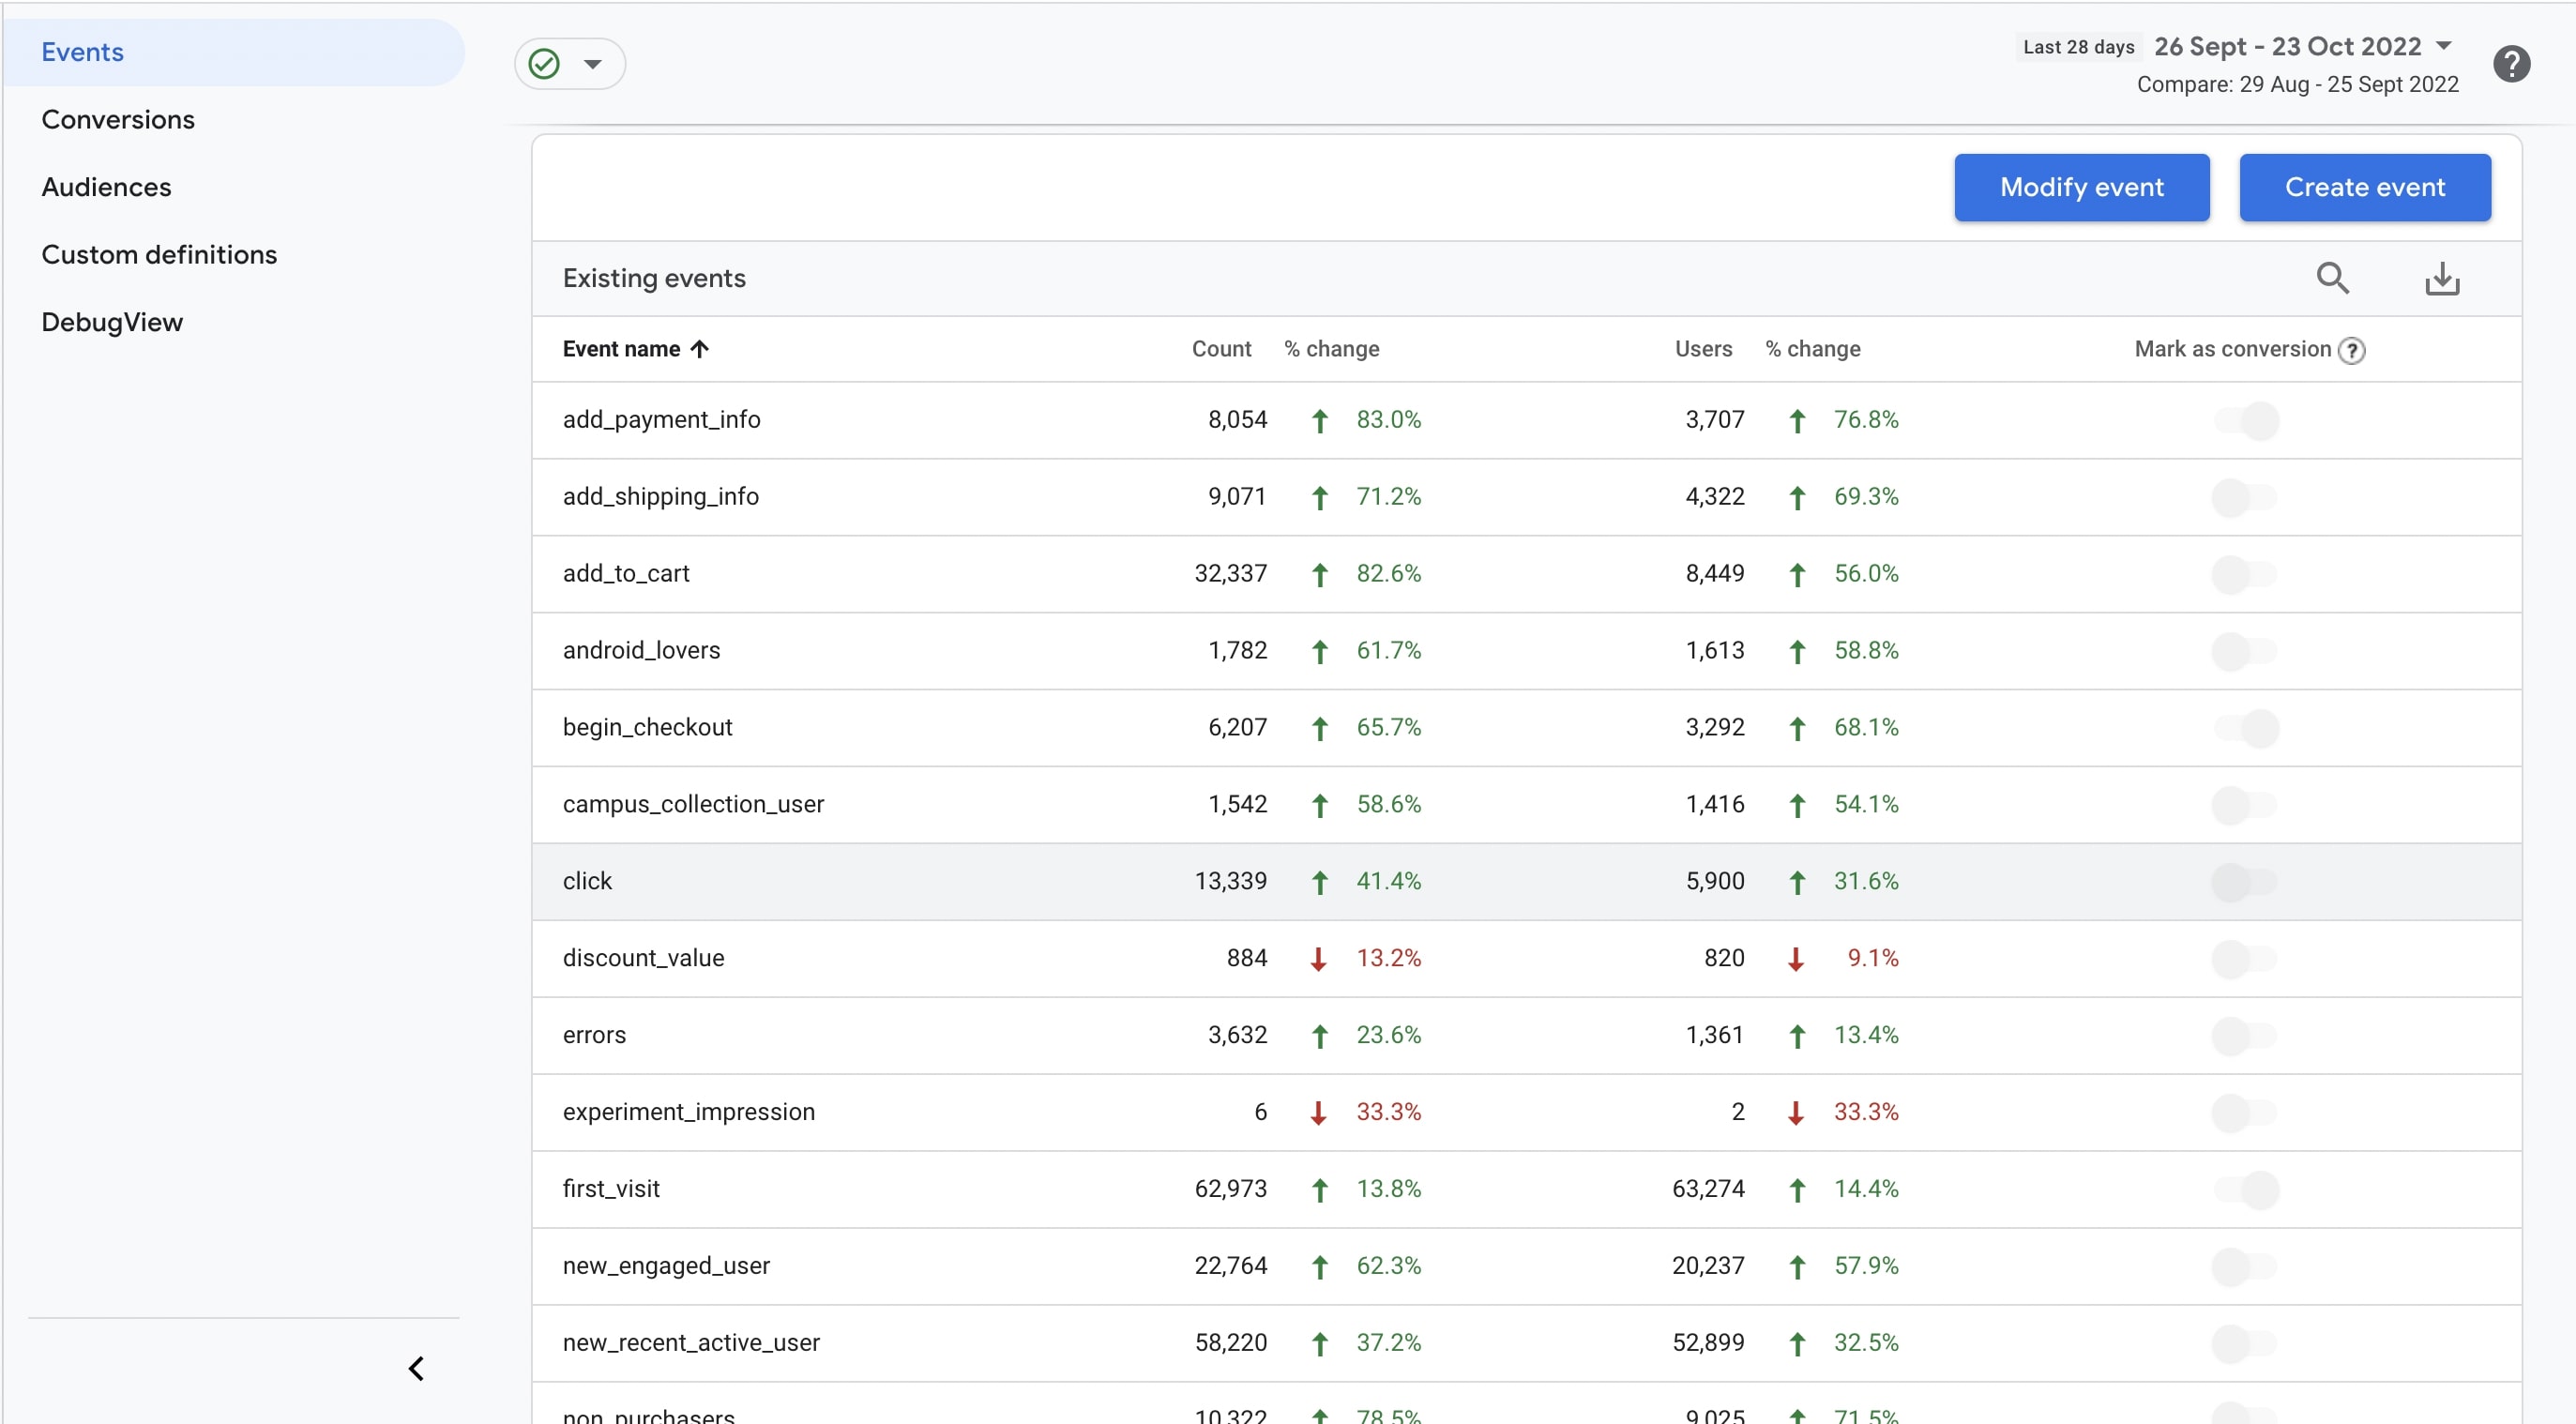
If there is an event that you send to the panel as a software and you want to change it, you can click on the modify event button and choose which stream you want to change first.
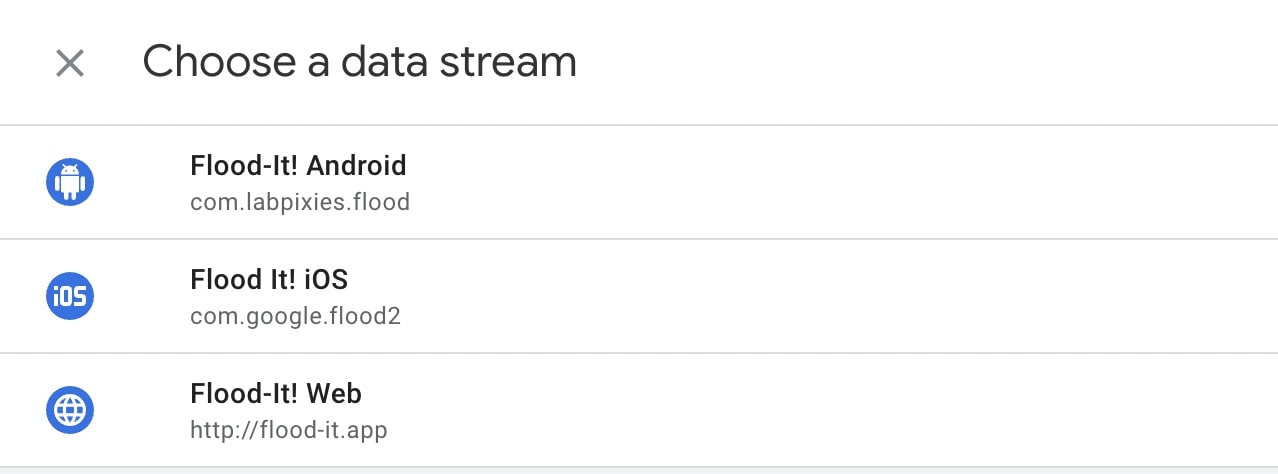
You can start configuring by clicking the Create button on the next page.

First, give this event change a descriptive name. Then, select the event you want to change and match all the conditions you set. Finally, add, remove or edit the parameter you want to modify.
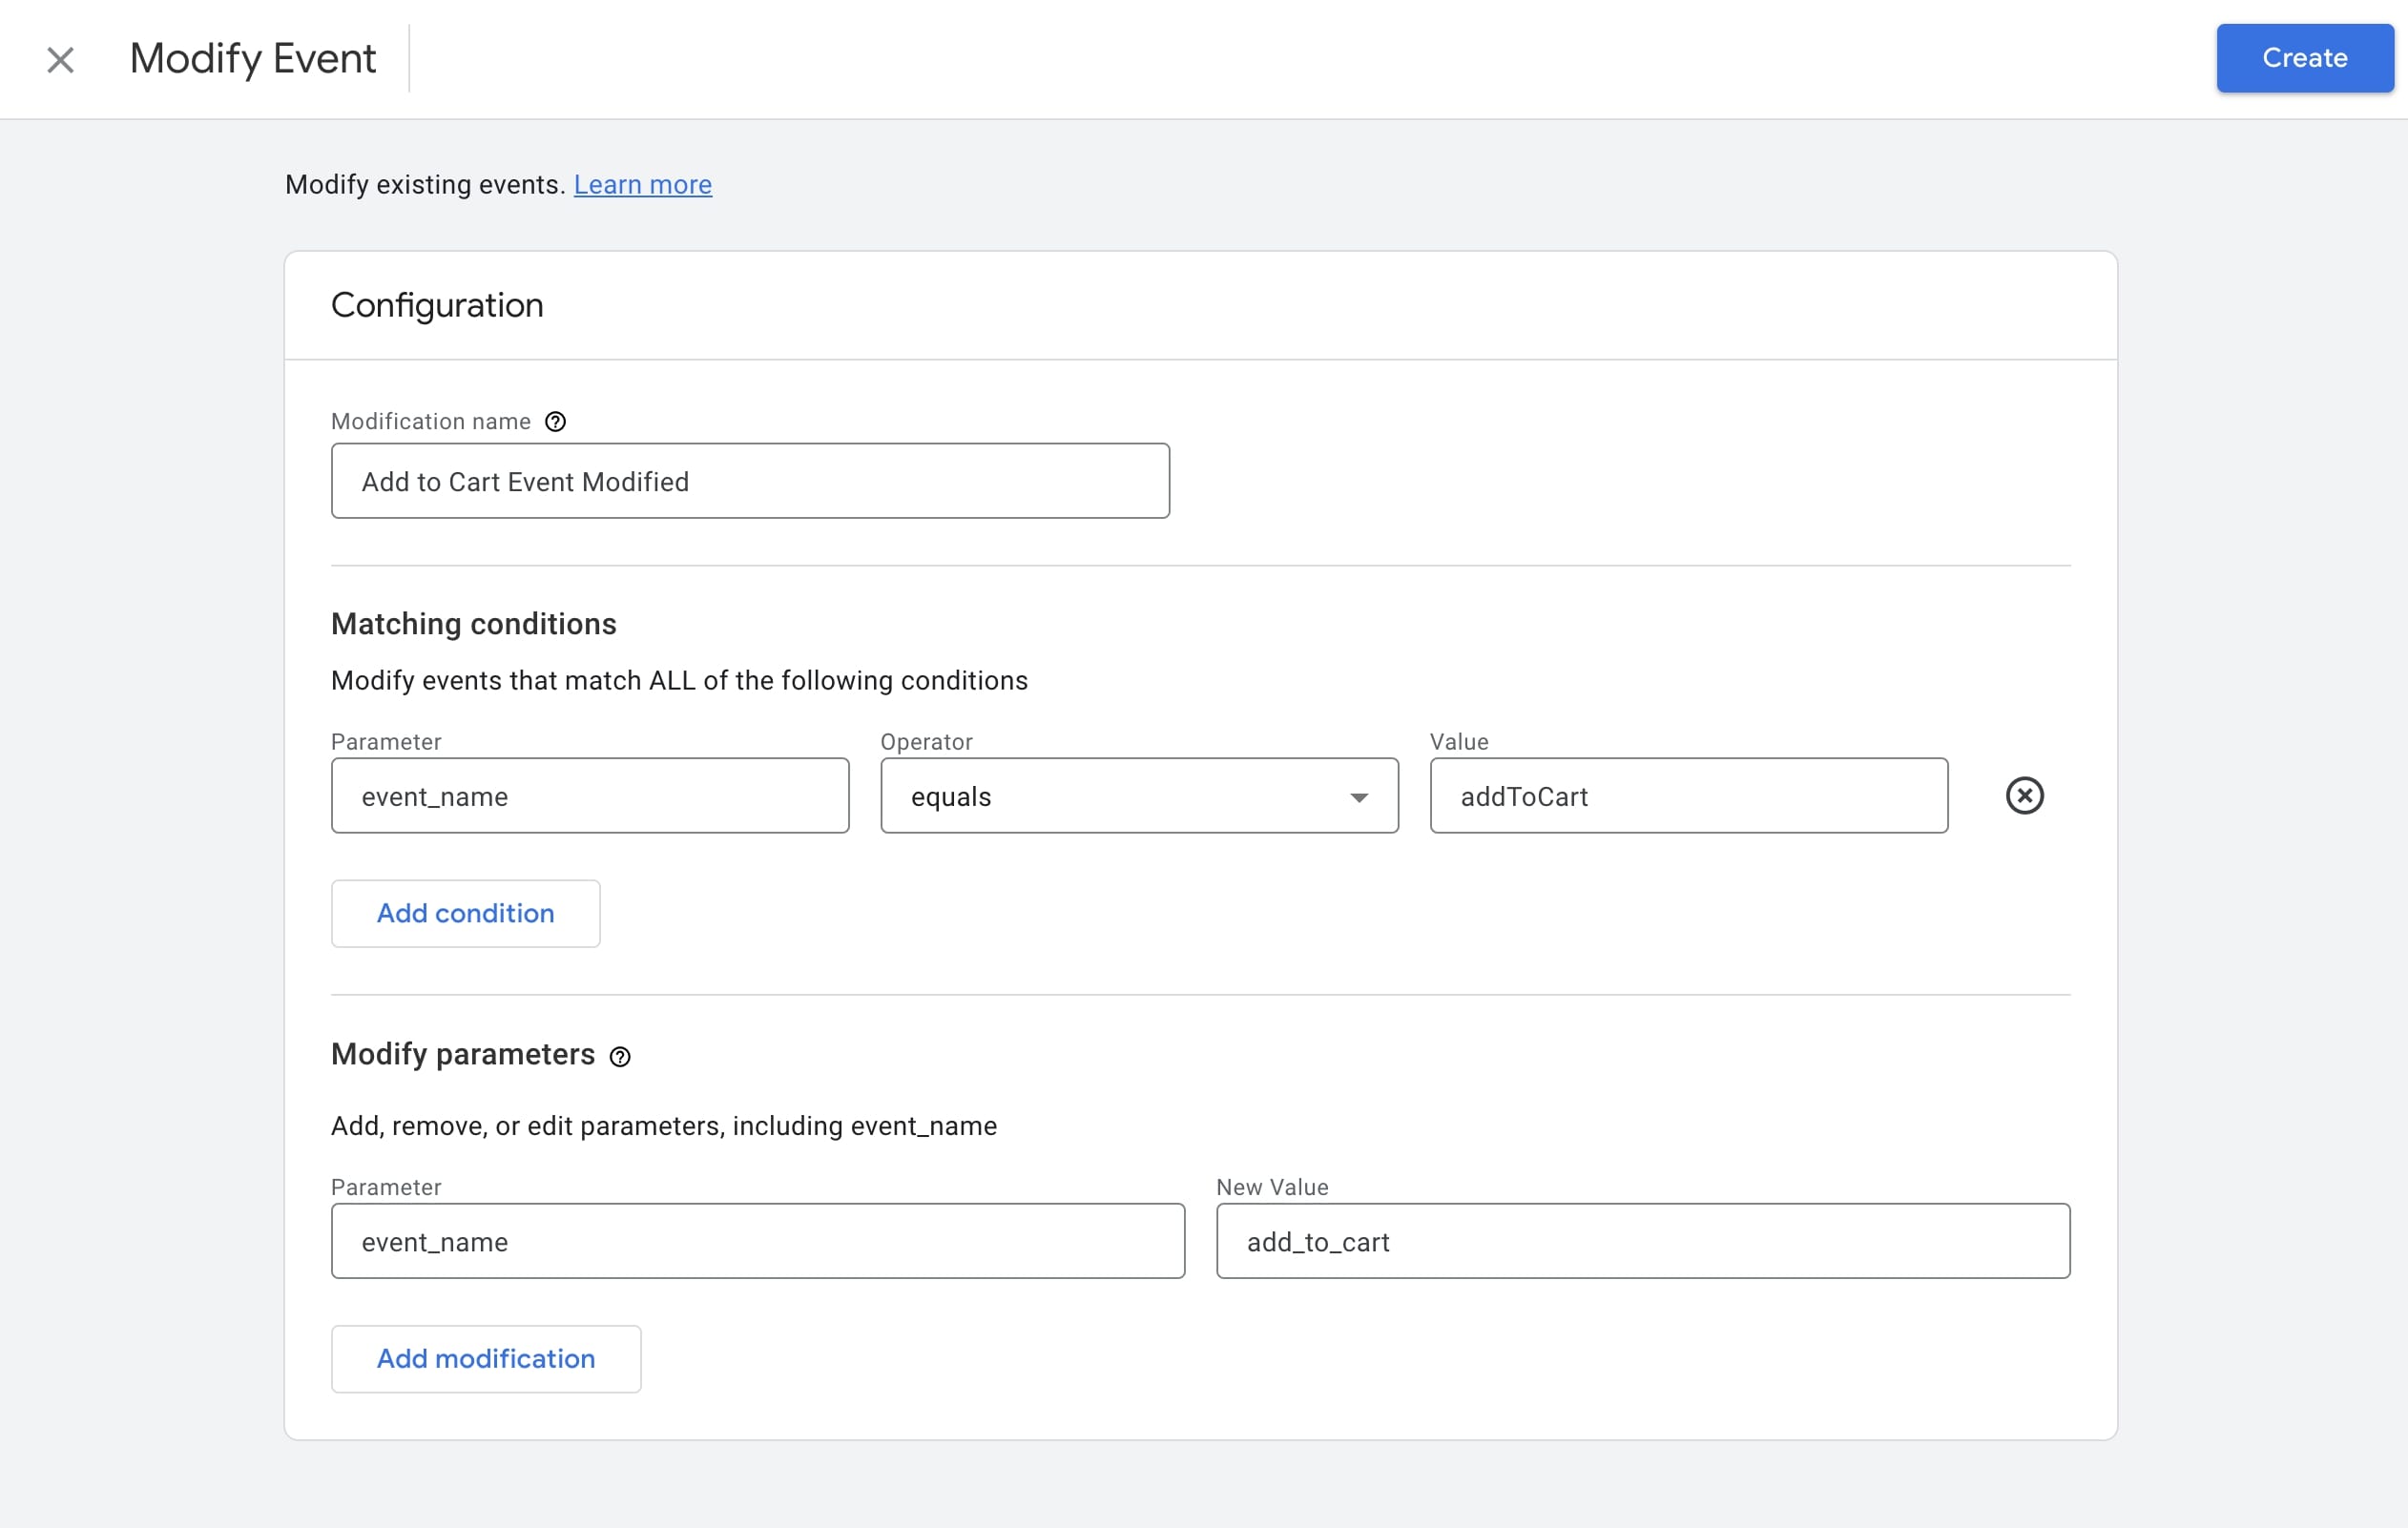
Modifications don't apply to historical data. It may take some time after saving the modification before it begins to take effect on the new data you collect.
Conversions
Conversions are events that you define for situations that you consider important for your site or application. For example, a successful purchase, game-level completion, scroll, etc.
You can mark the events that you think are important to you in the Events field and follow them as conversions.
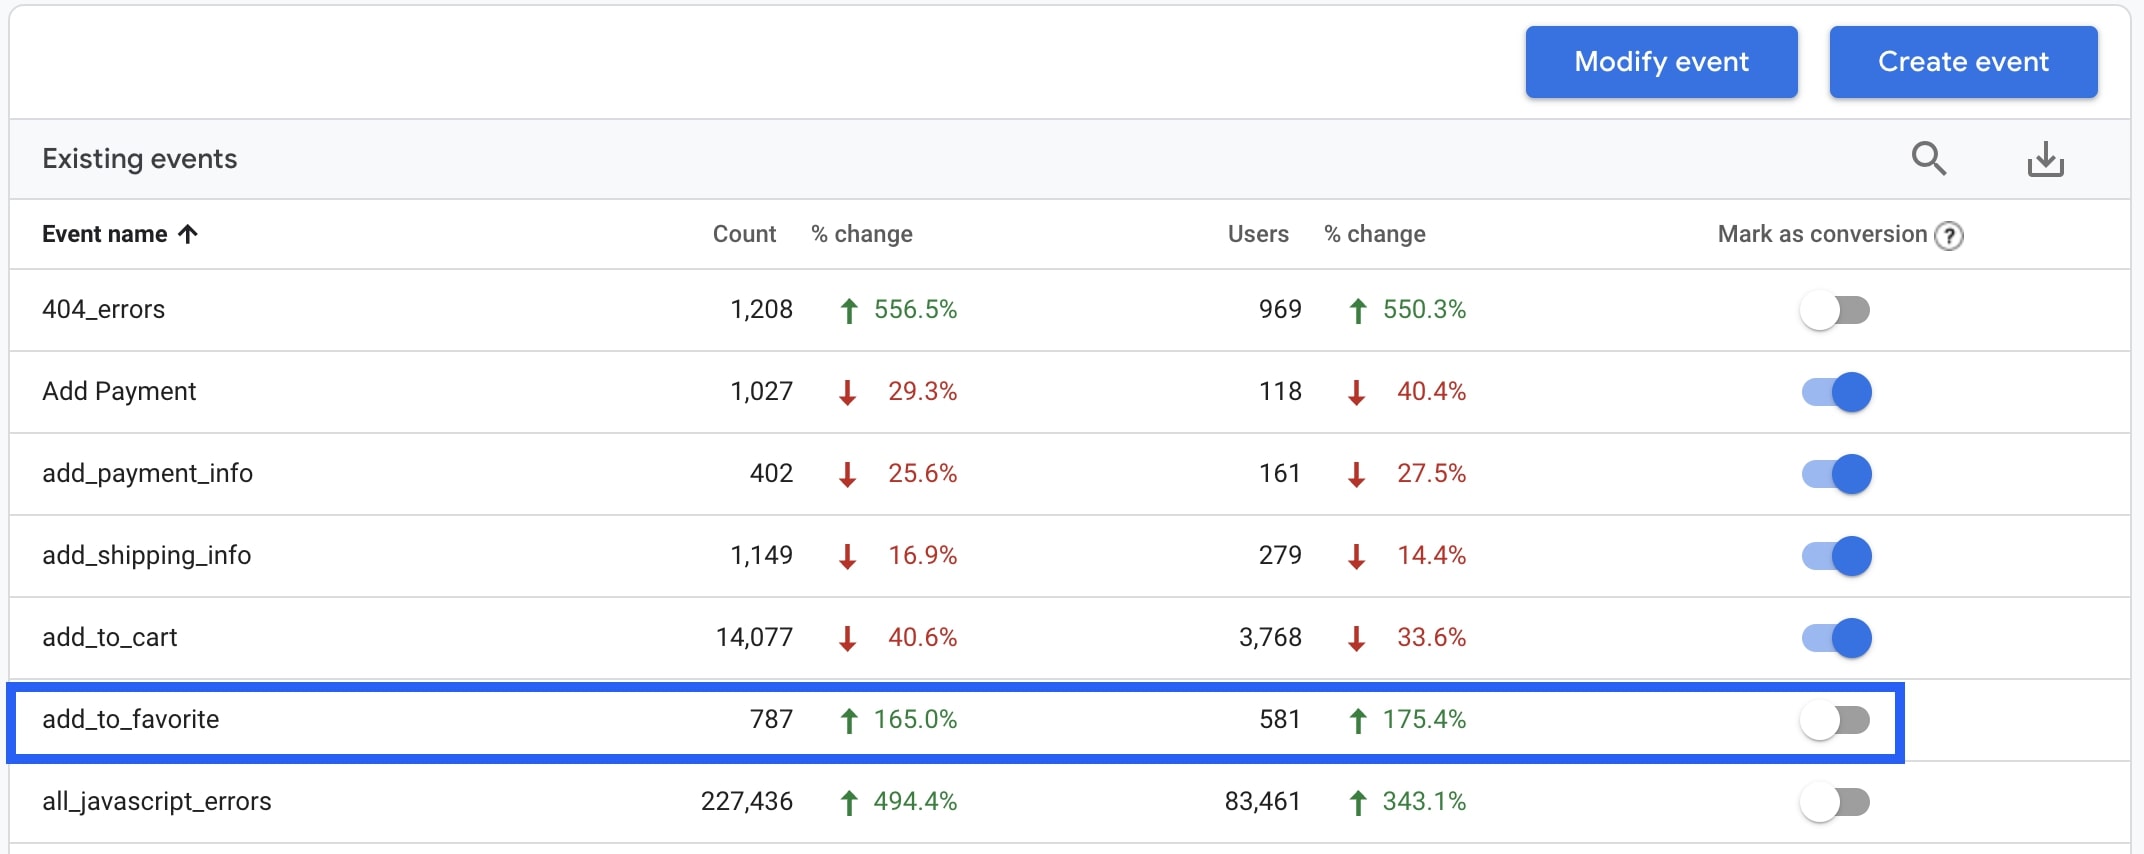
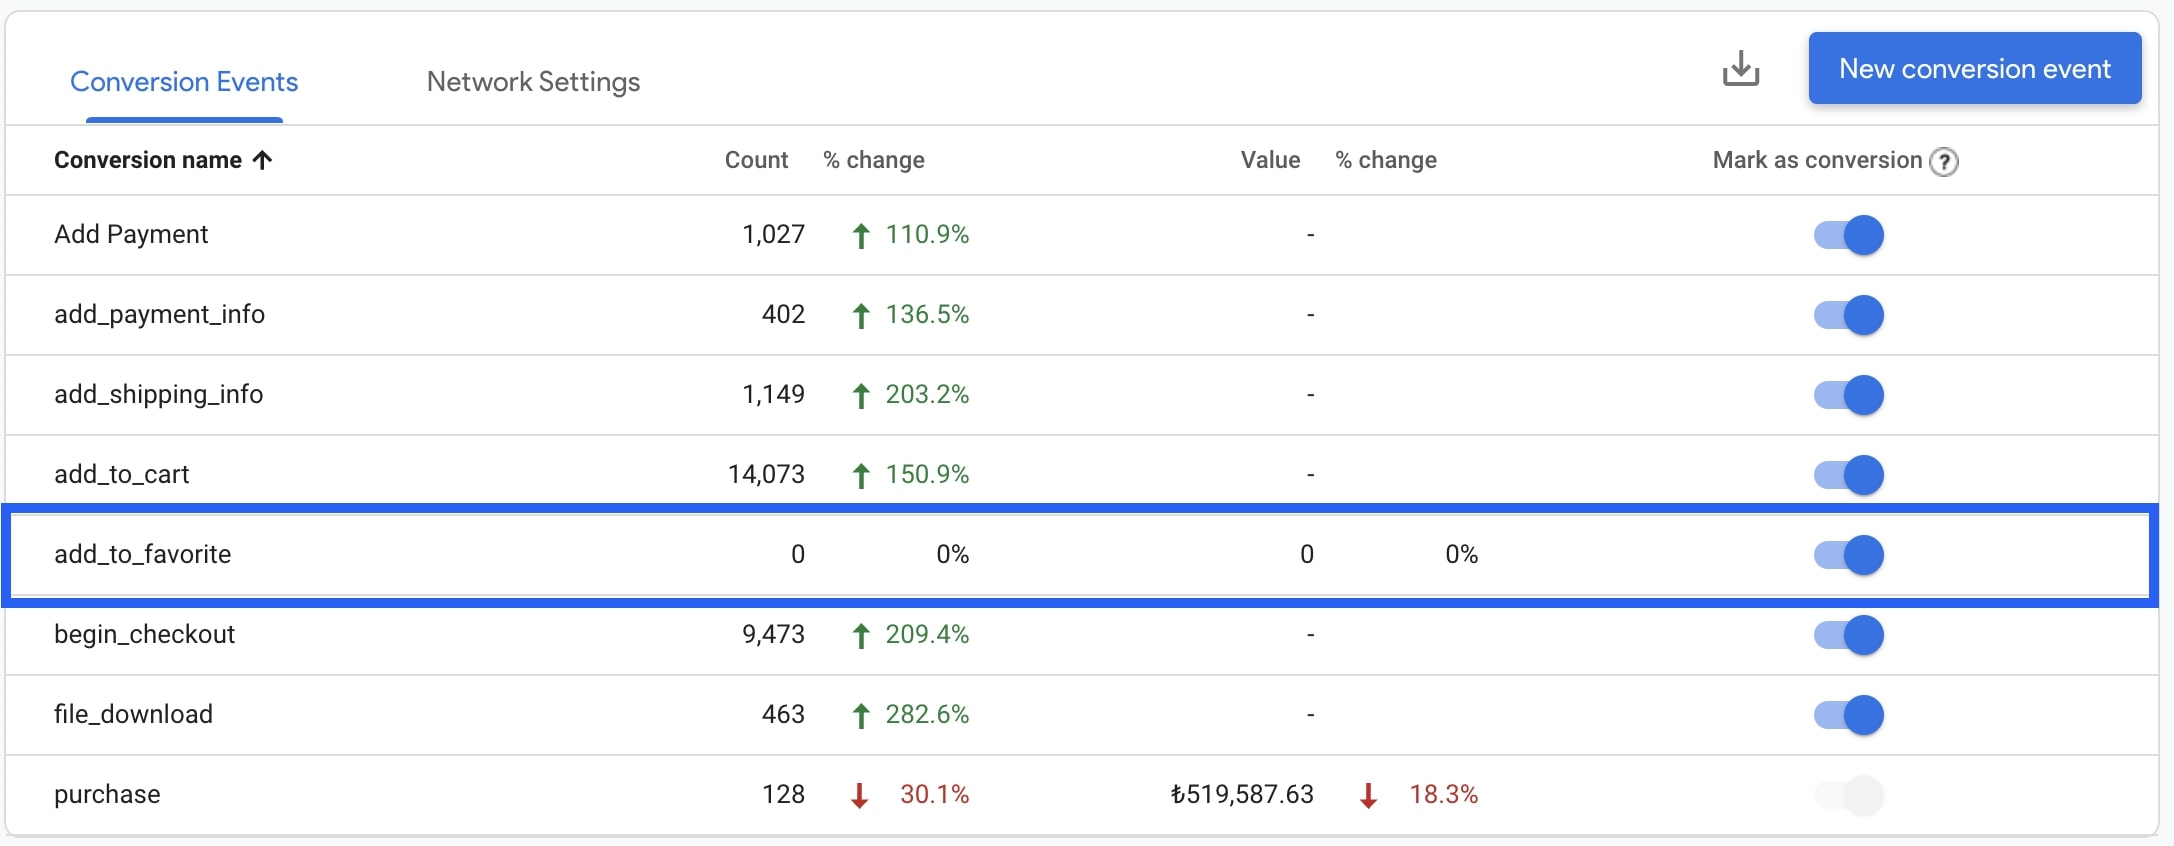
After completing this, you will see them under Conversions:
Audiences
You can create an audience by combining users browsing your site or application according to a characteristic that is important to you.
An audience might be simply current shoppers (include users who have > 0 product views; exclude users who have > 0 purchases).
Once you define an audience, you can:
- focus your marketing efforts on these users after enabling this audience on platforms such as Google Ads and Display & Video 360
- use these audiences as dimensions or segments in custom reports or funnels.
There are some audiences defined by default on the Audiences page. If you want to create your own audience, click New Audience on the top right:

You can then use the templates for audiences here if you like, or you can click Create a Custom Audience and create your own template.
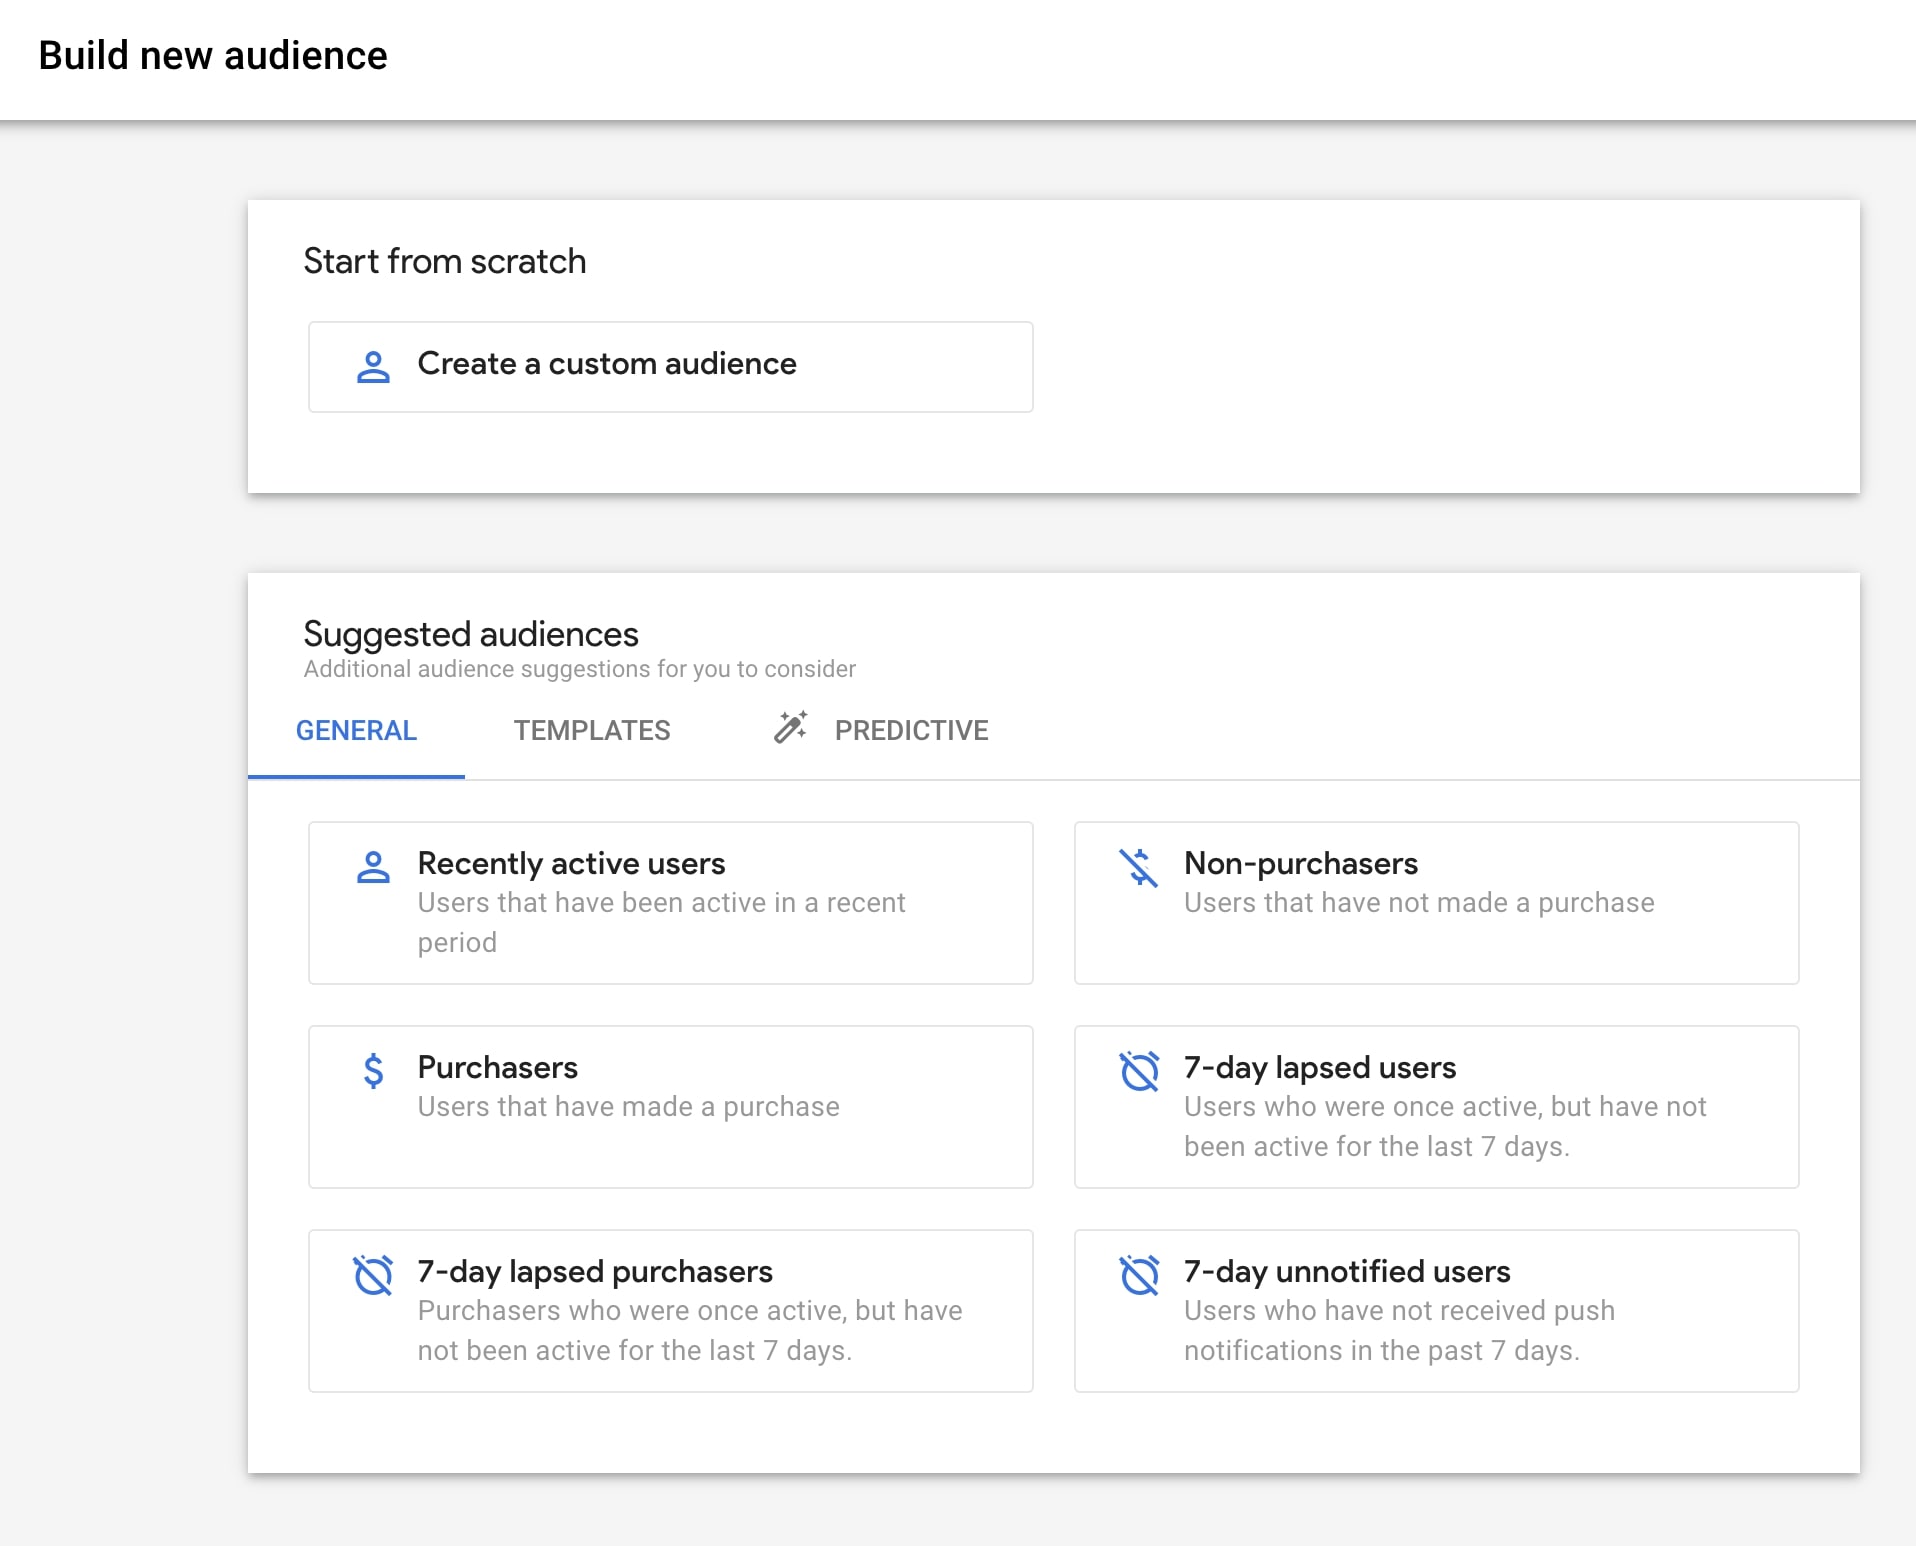
After you decide on the audience structure you want to create, you can select these features from the drop-down menu:
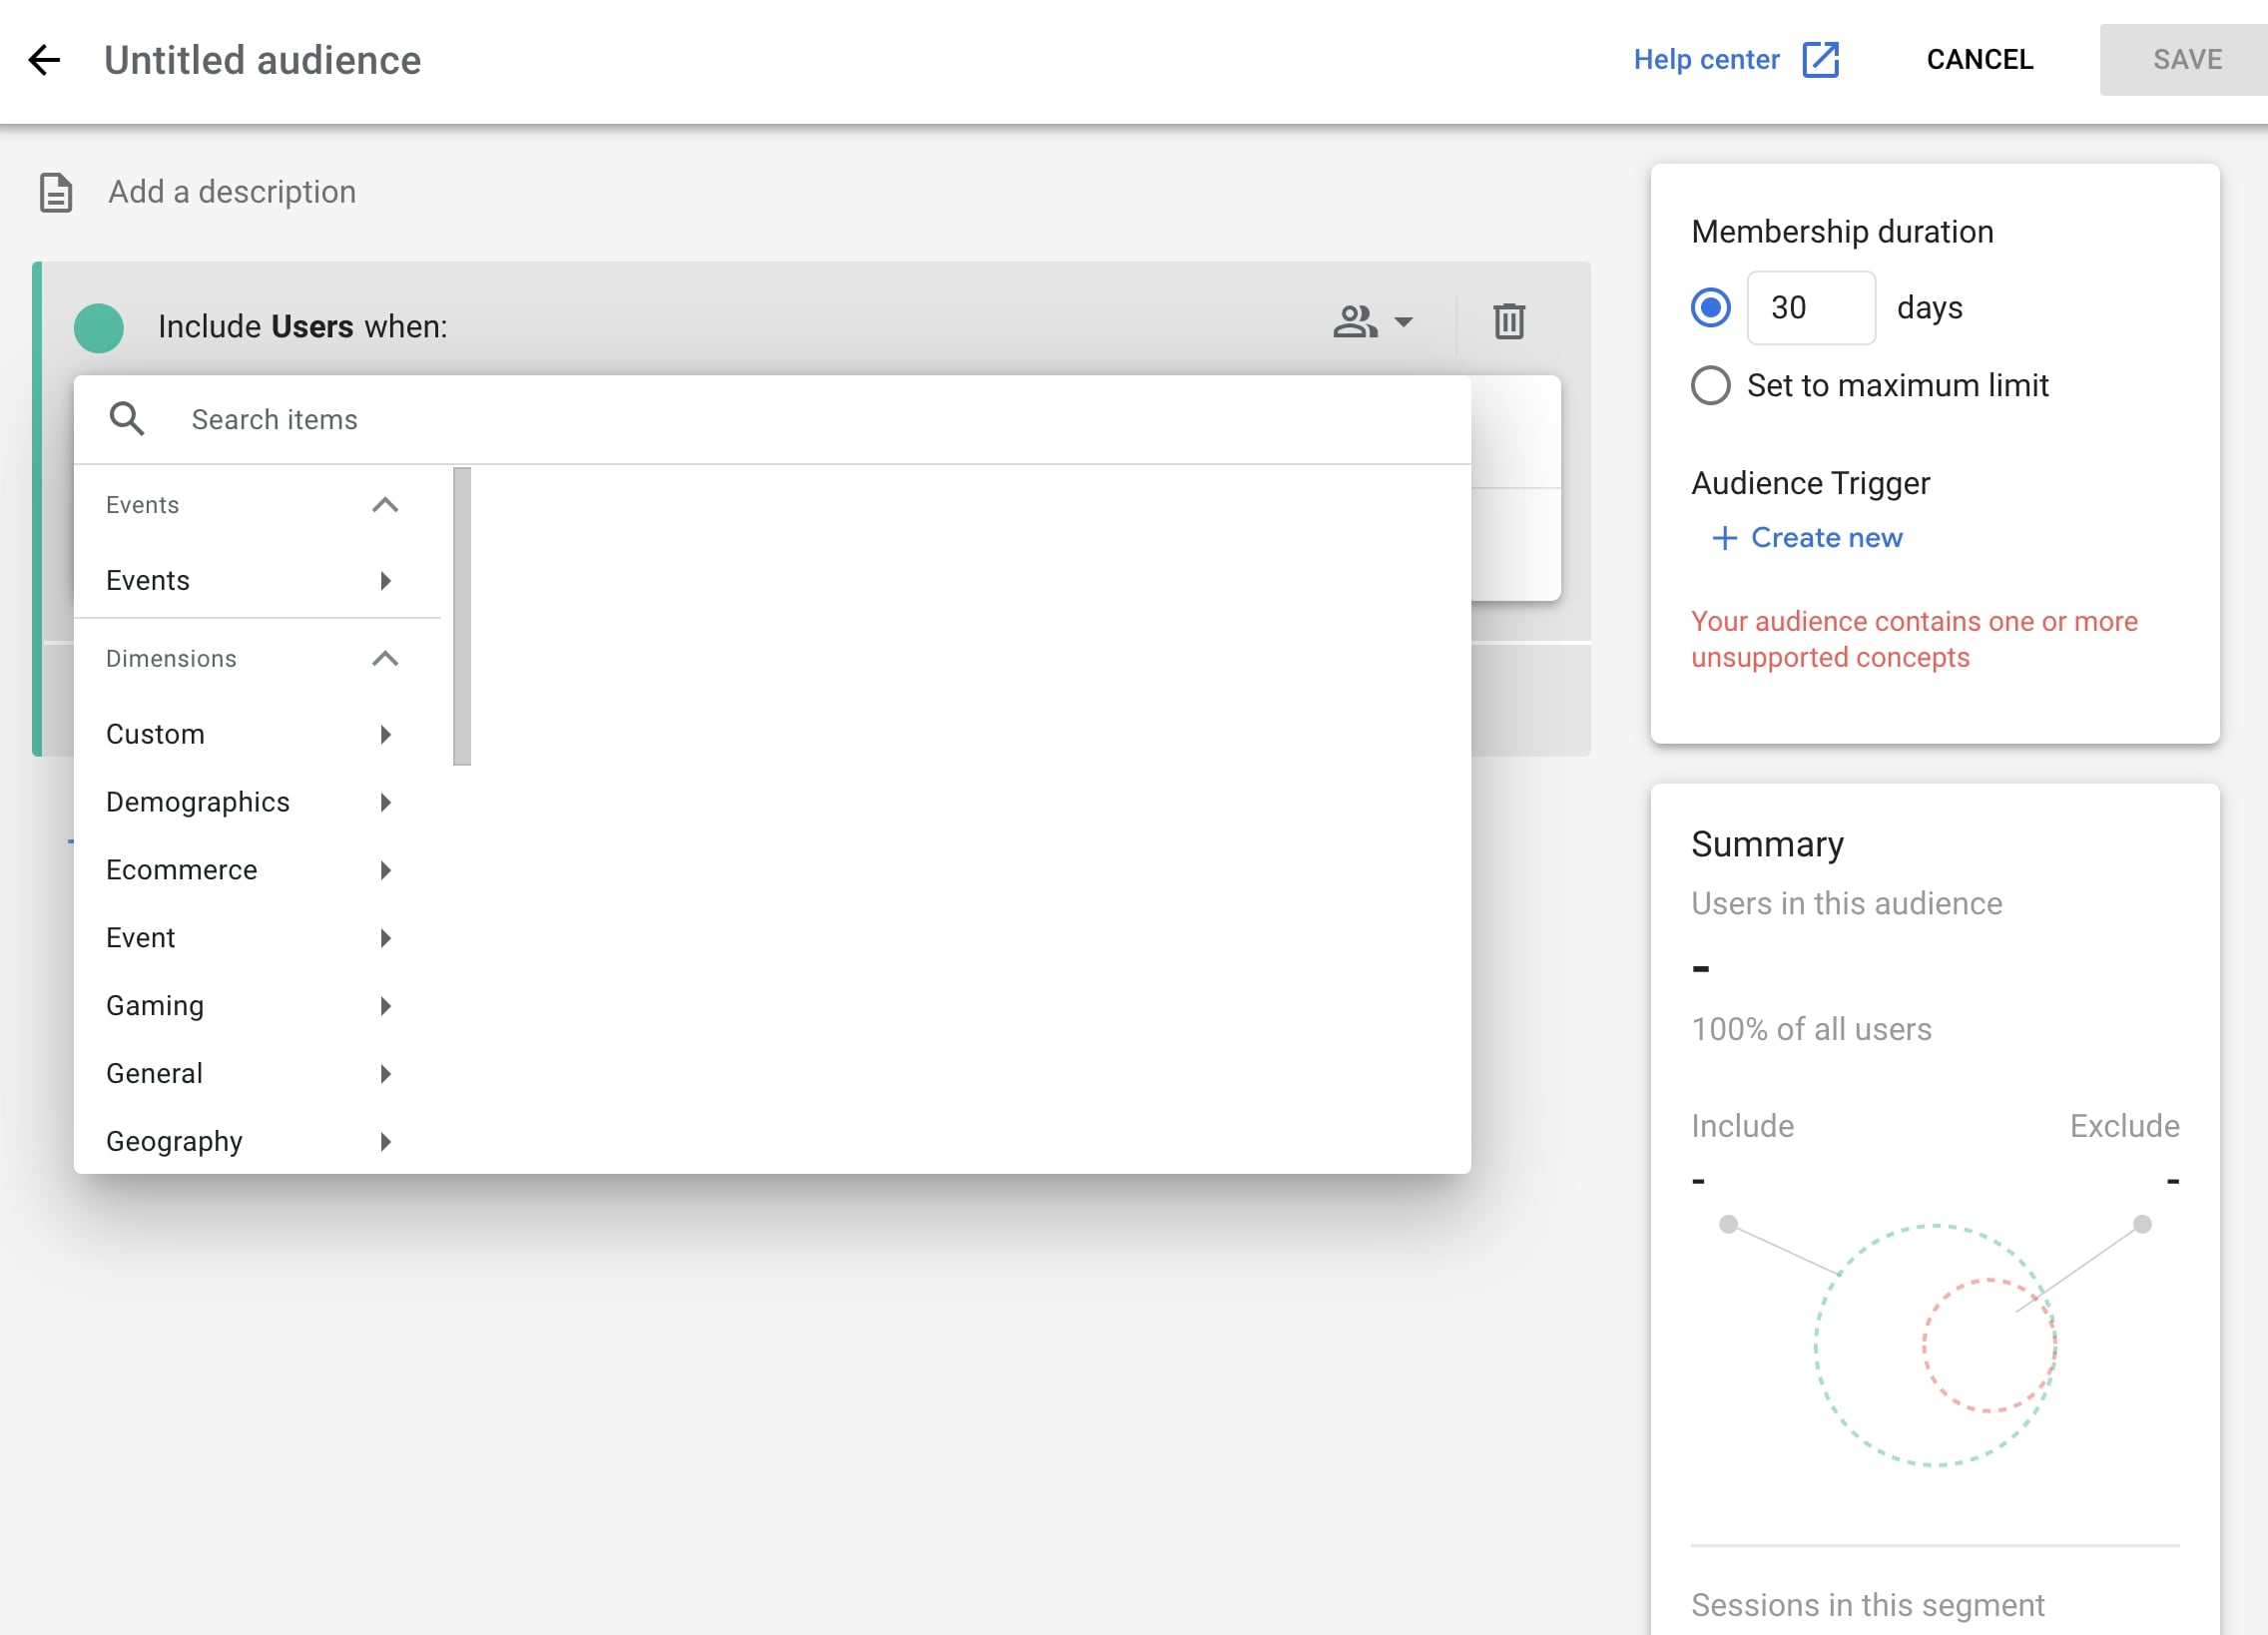
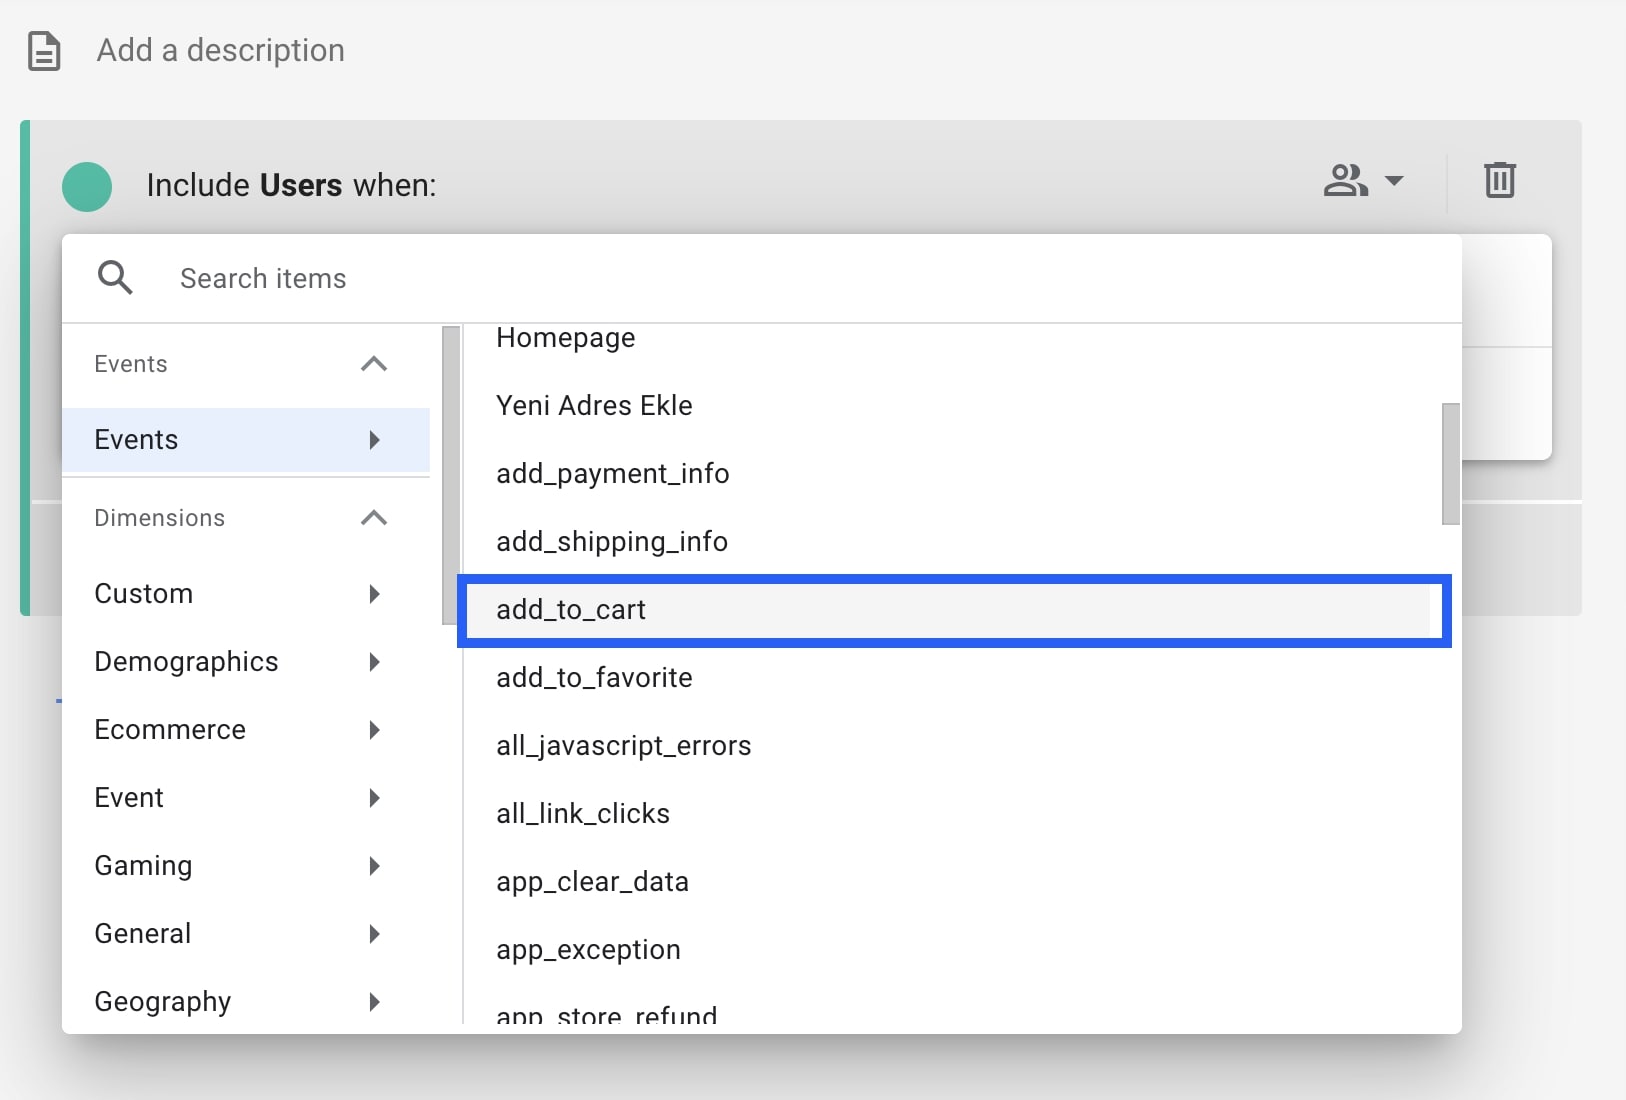
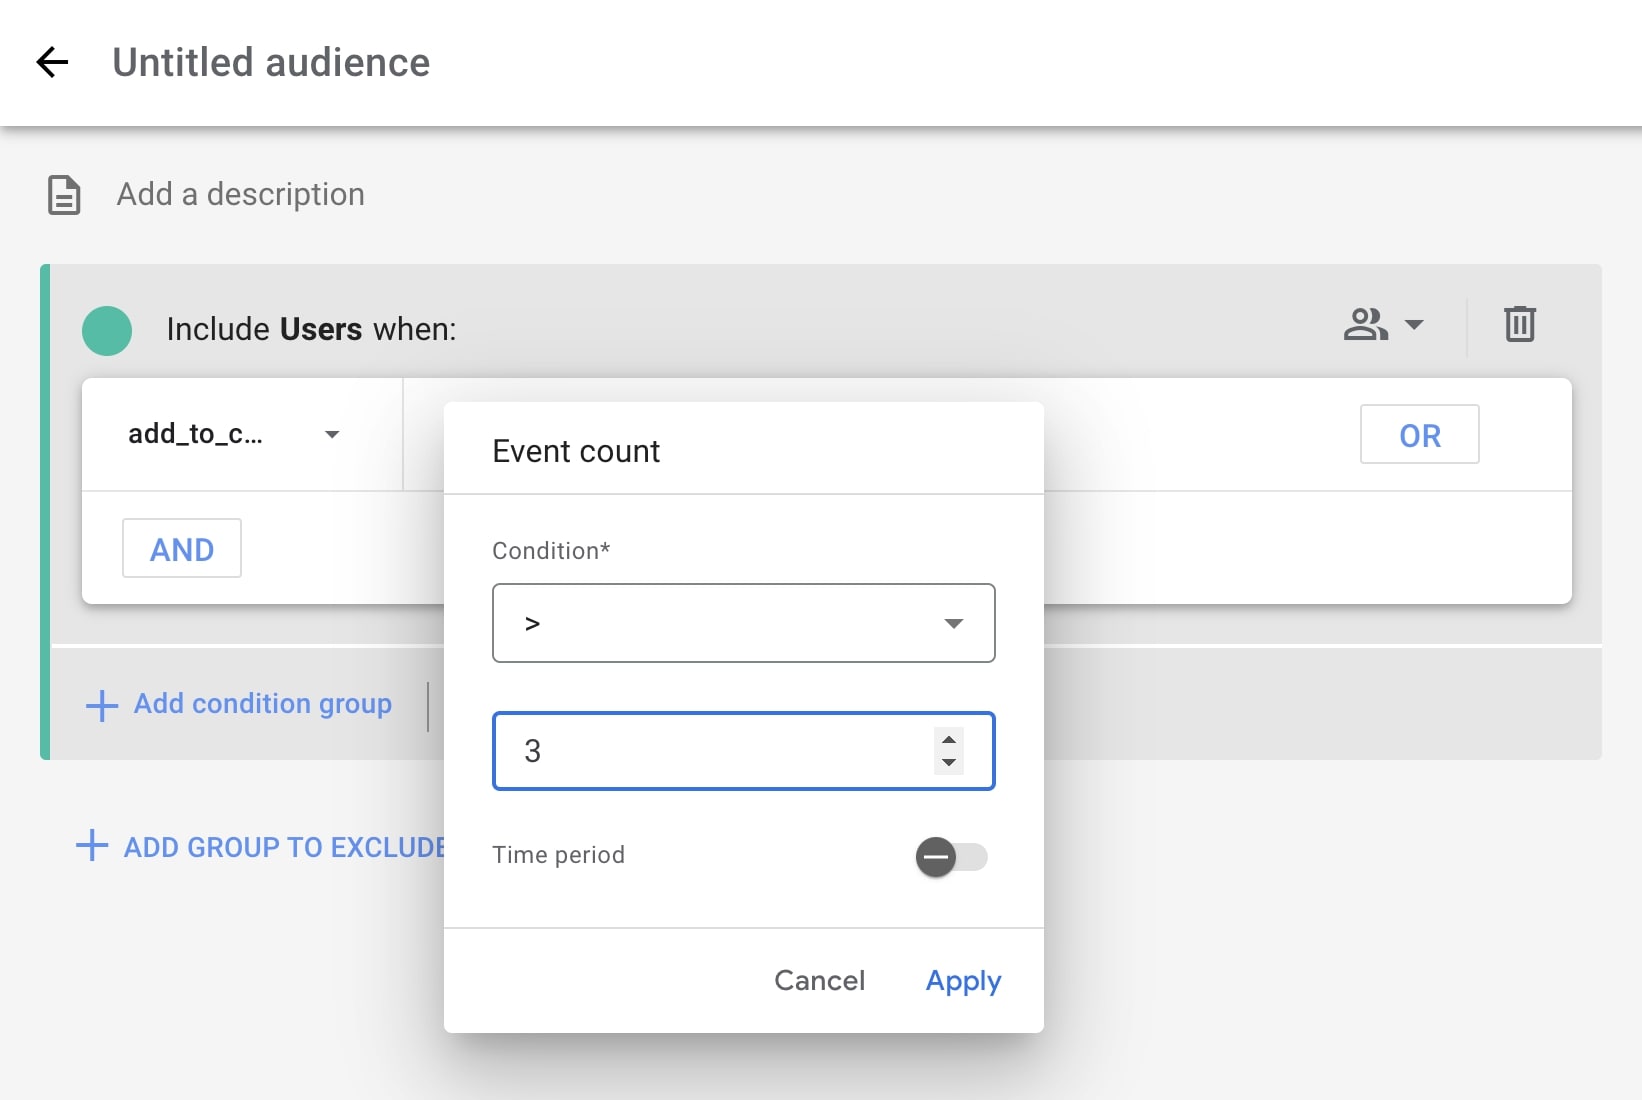
For example, here are 3 steps to let you define an audience for users who add to the cart 3 times:
Find 'add_to_cart' under Events
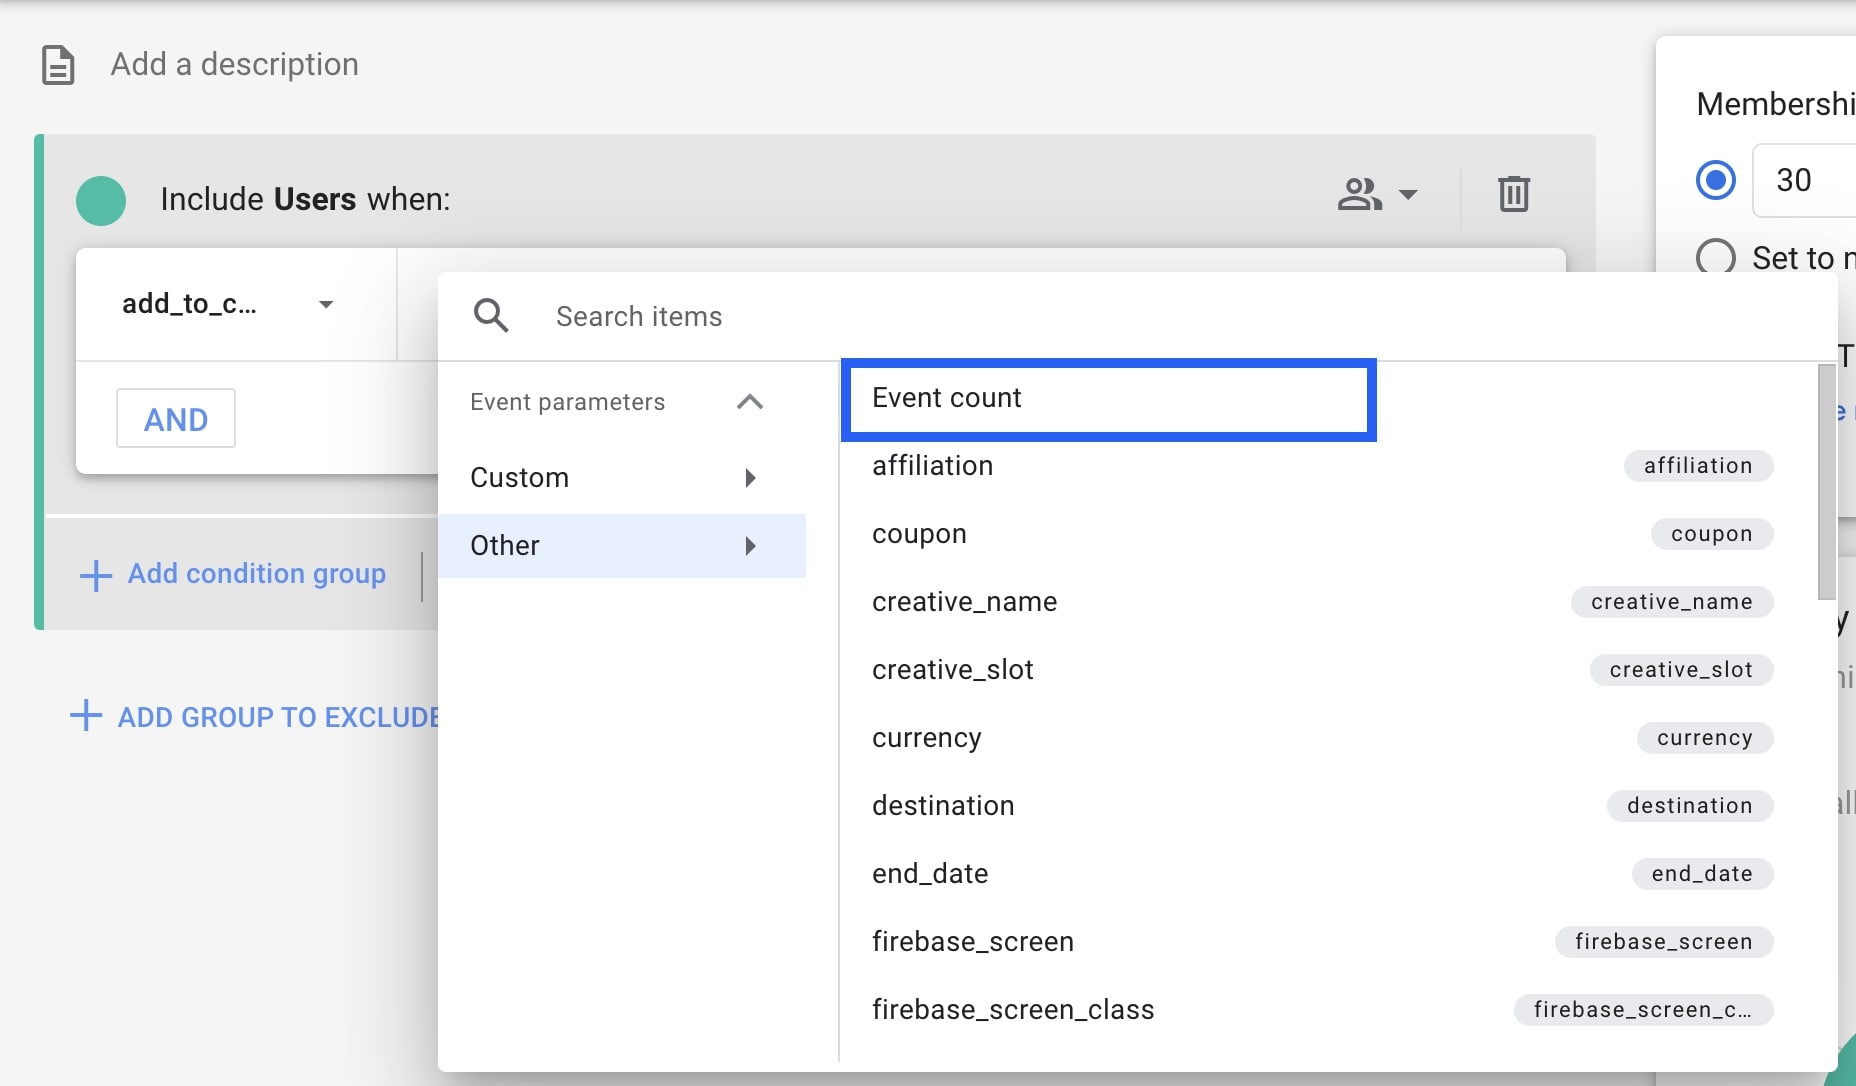
Find 'Event count' after clicking 'add parameter'.
Apply the settings as you see and click 'Apply'. If you want the user group that adds to the cart 3 times in a certain period of time, you can choose it from the 'Time Period'.
After clicking the Apply button, you will only see the number of people that are included in the condition you set.
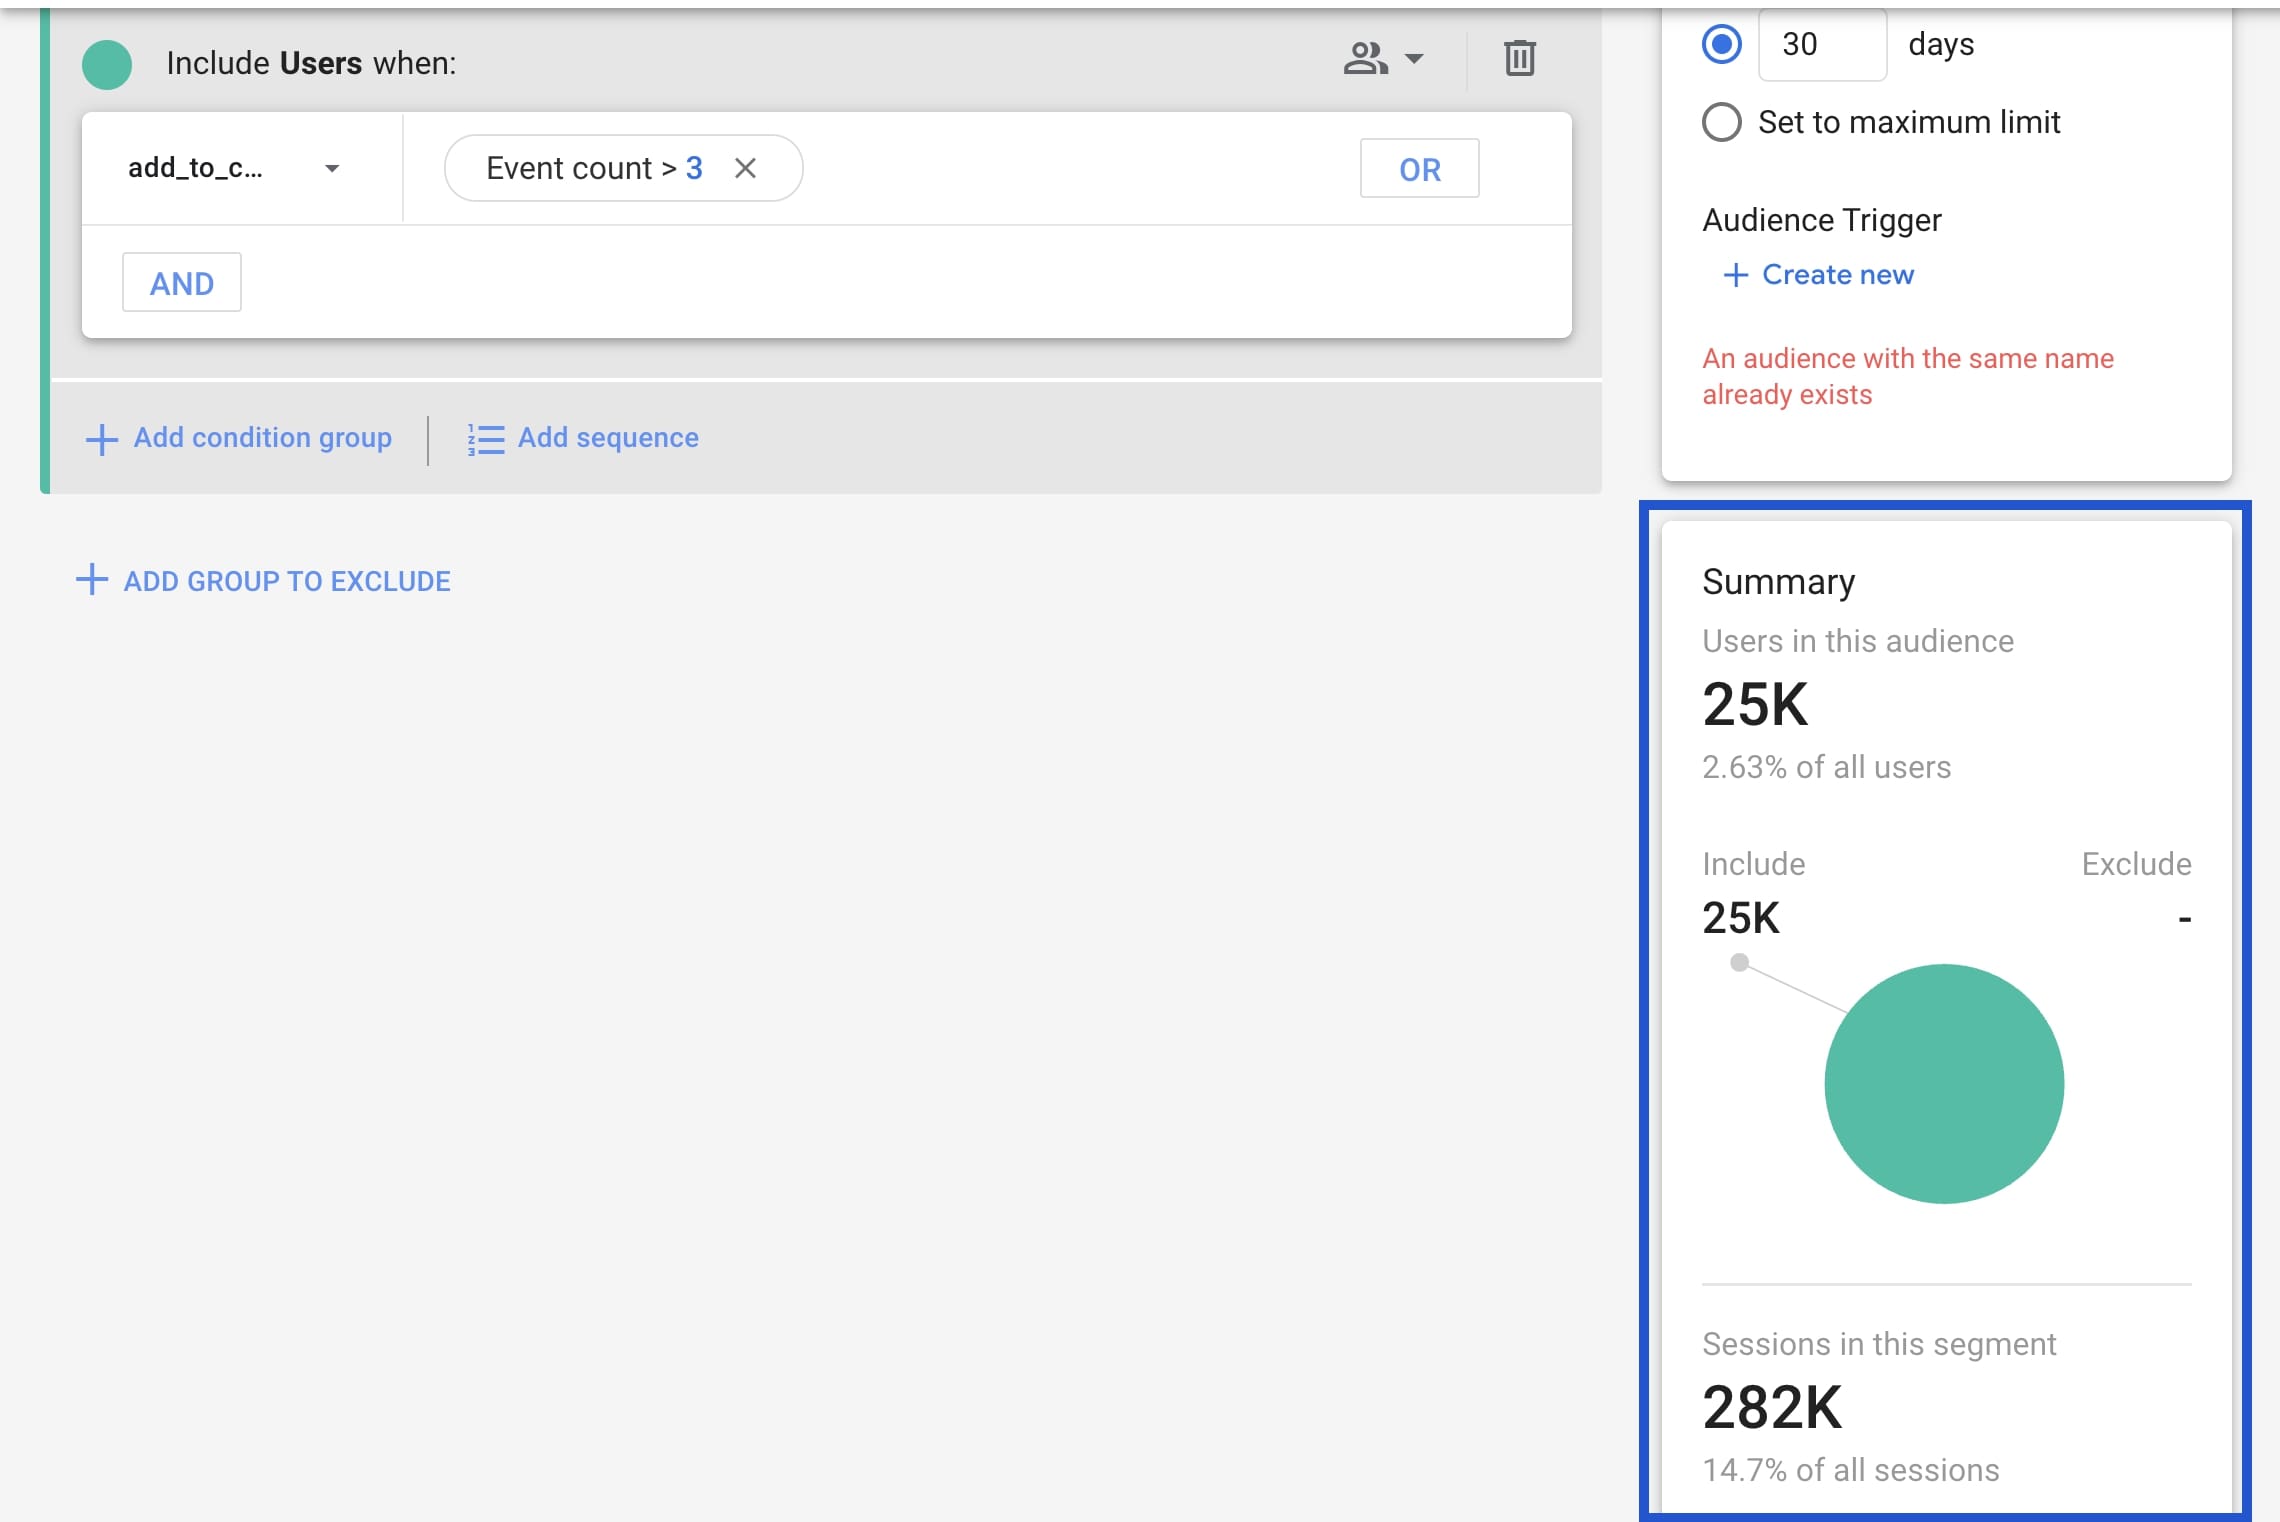
You can save your audience after naming it.
Custom Definitions
You can create special definitions for your website or application here.
There may be some other data specific to your website or mobile applications which you want to collect apart from events. This is where dimensions come into play. Dimensions can be used to identify the product, event, user, website, etc. to help you define and better understand your data.
Custom Dimension
Follow the steps below to define a custom dimension:
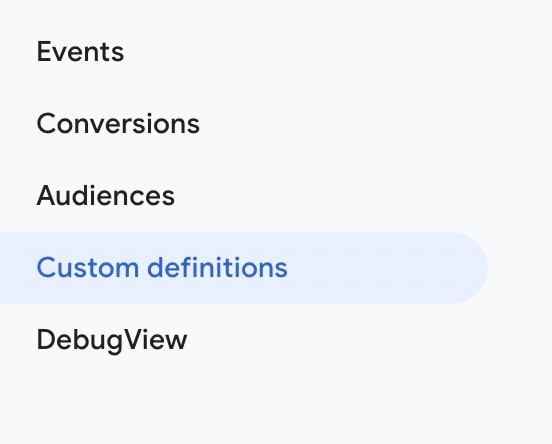
Find 'Custom Definitions' under 'Configure'.
Click on 'Create custom dimension'.

Name your dimension under 'Dimension name'. Since you have defined the parameter of an event, where there is no user information, the scope can remain as Event. You can add a description through 'Description'.
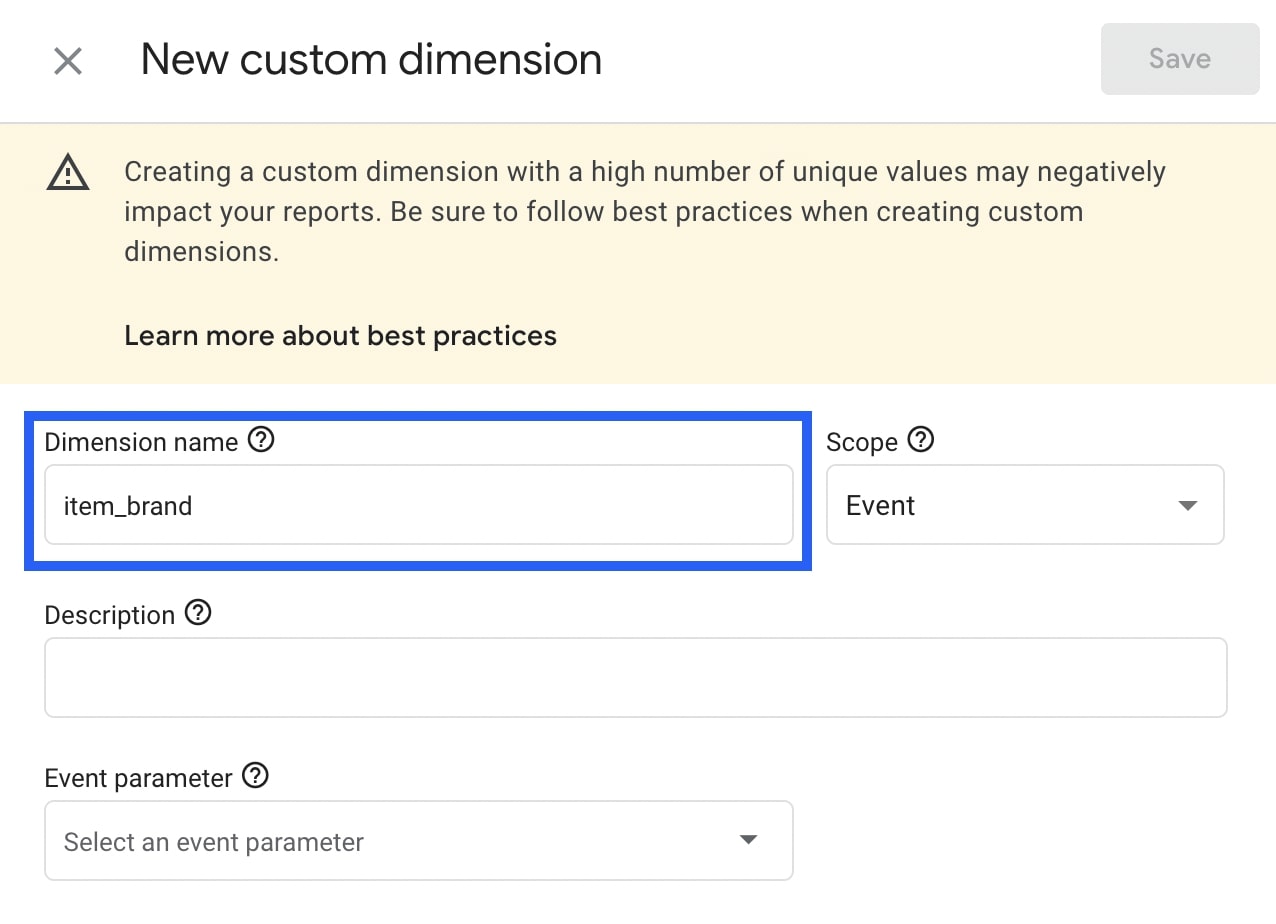
Choose the parameter you will want to add as a dimension under 'Event parameter'.
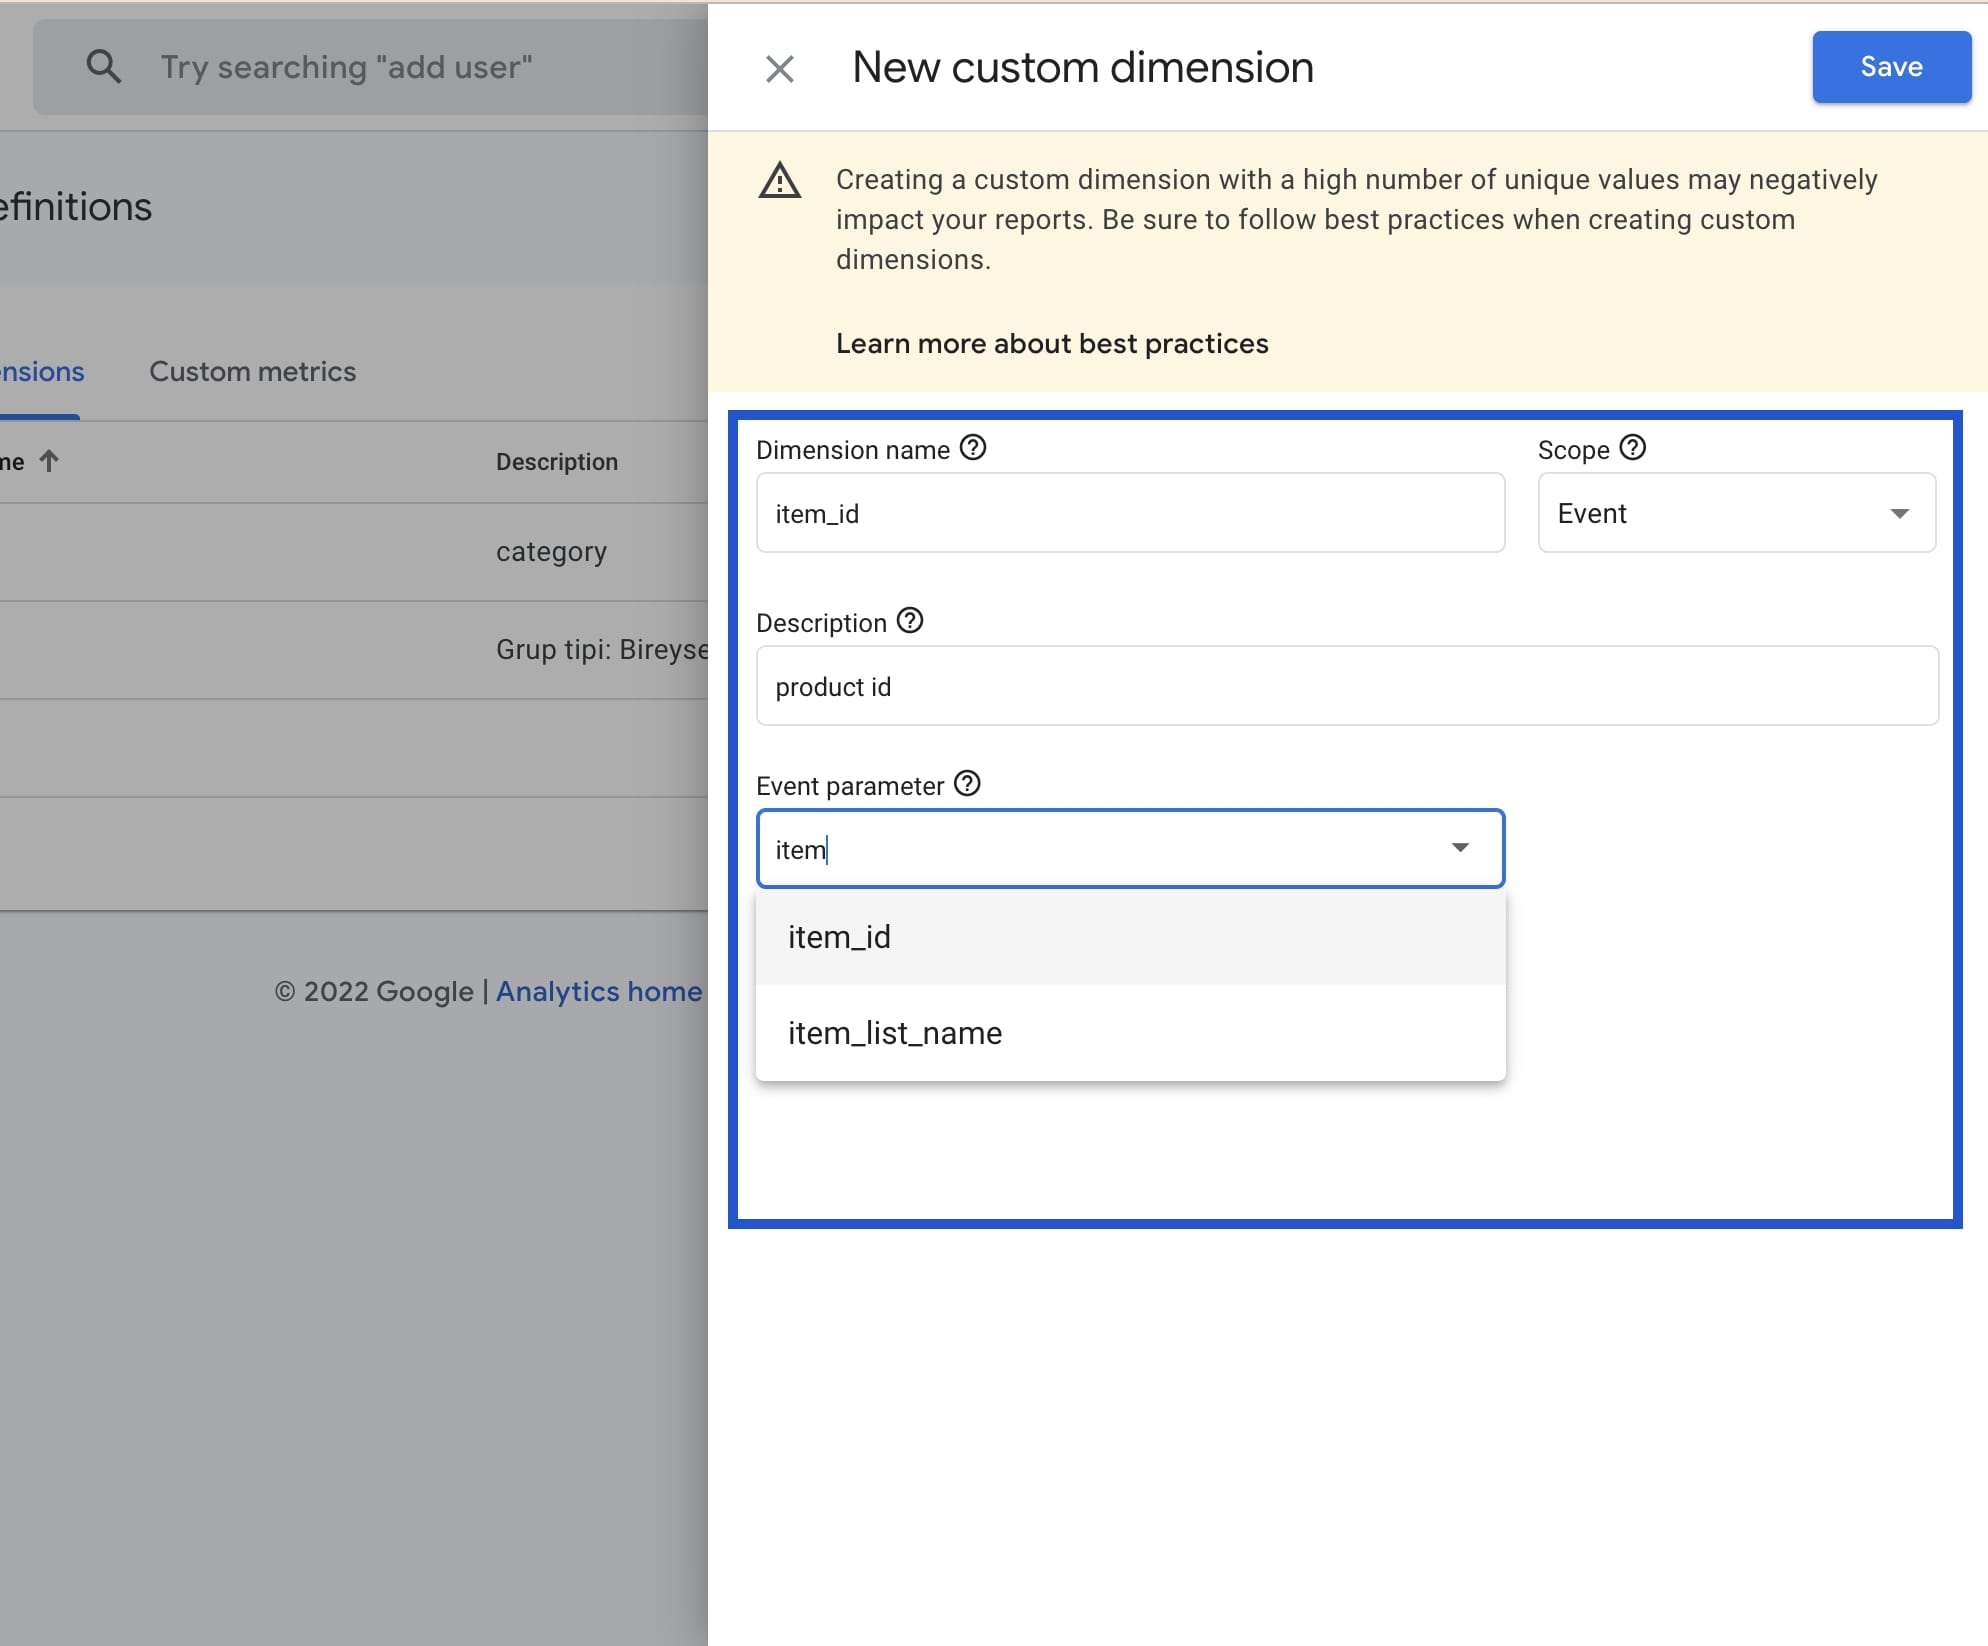
After completing these steps and saving, you will be able to report the data collected for this parameter with the dimension you created.
Custom Metrics
Follow the steps below to create custom metrics:
Click on 'Custom metrics' and then choose 'Create custom metrics'.

Name the metric you want to create. Then, add a description of the metric you defined through 'Description'. Unlike Dimension definitions, you don't choose scope here.
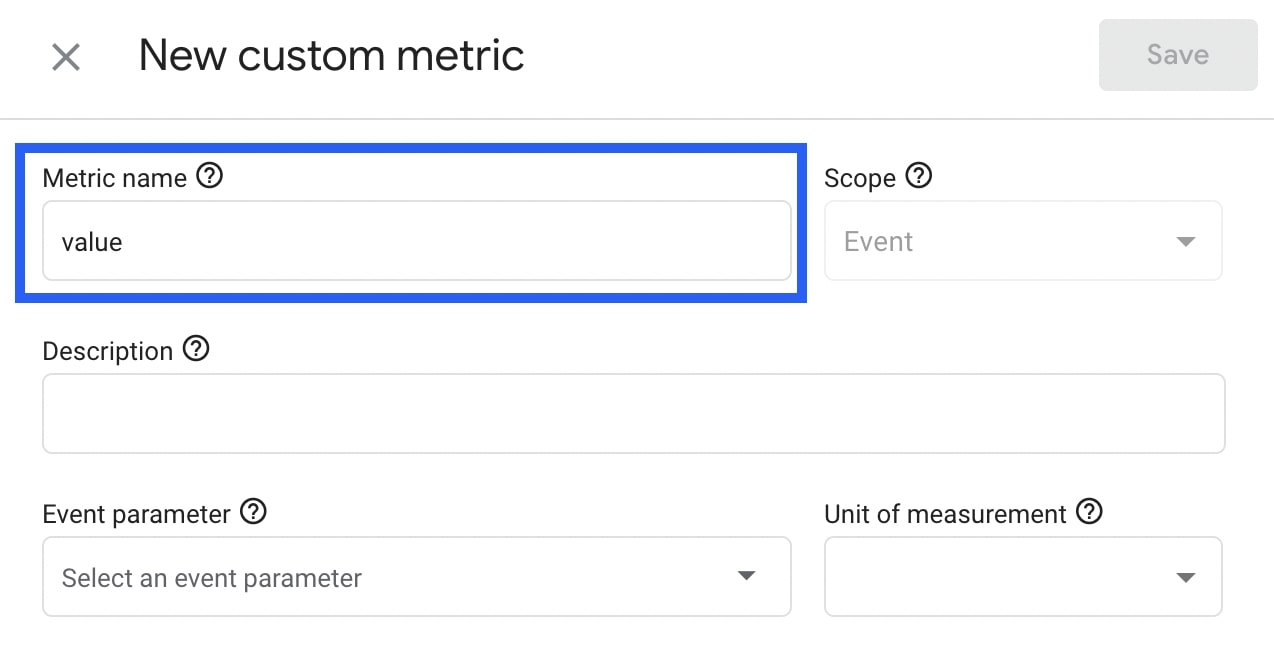
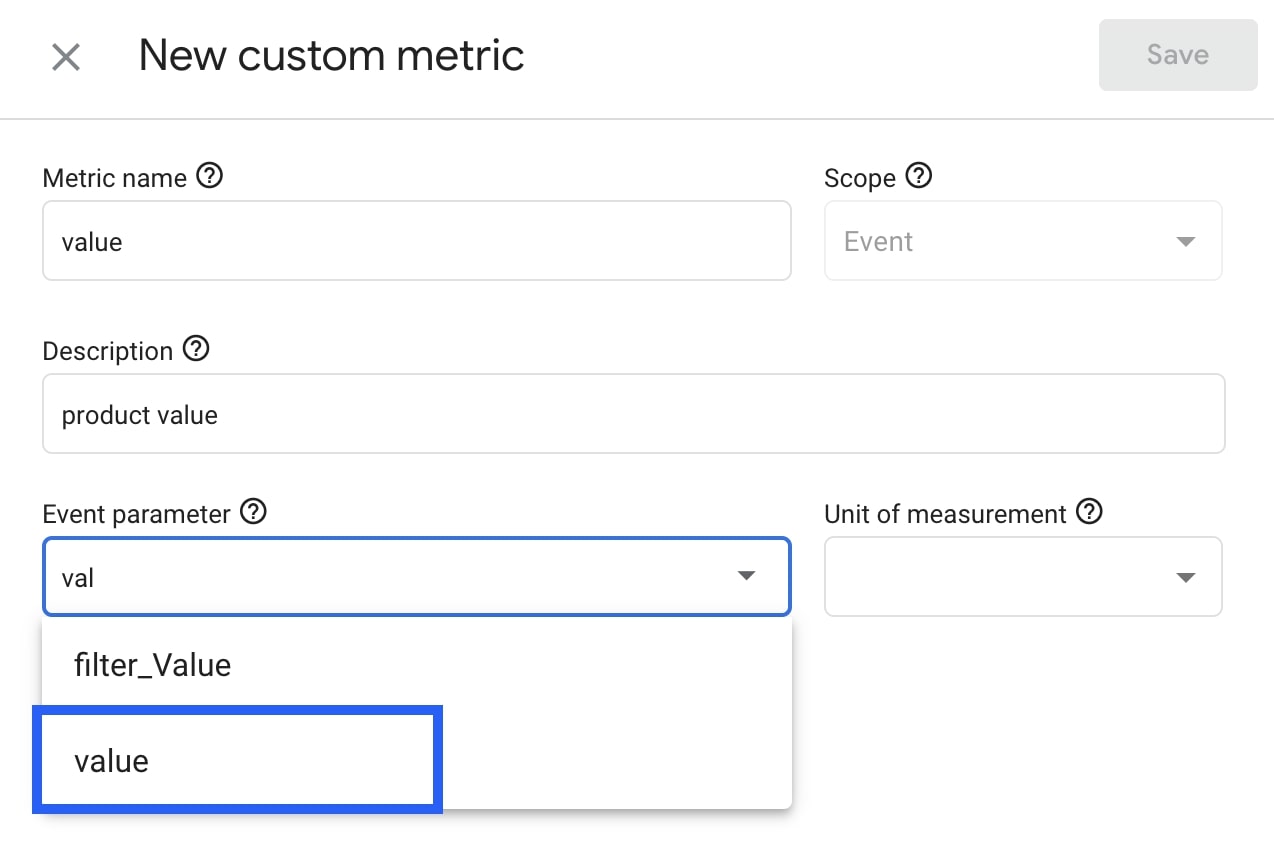
Next, select a parameter in the 'Event parameter' where you will add which data to flow.
Finally, select the type of data this metric will take through 'Unit of measurement'.
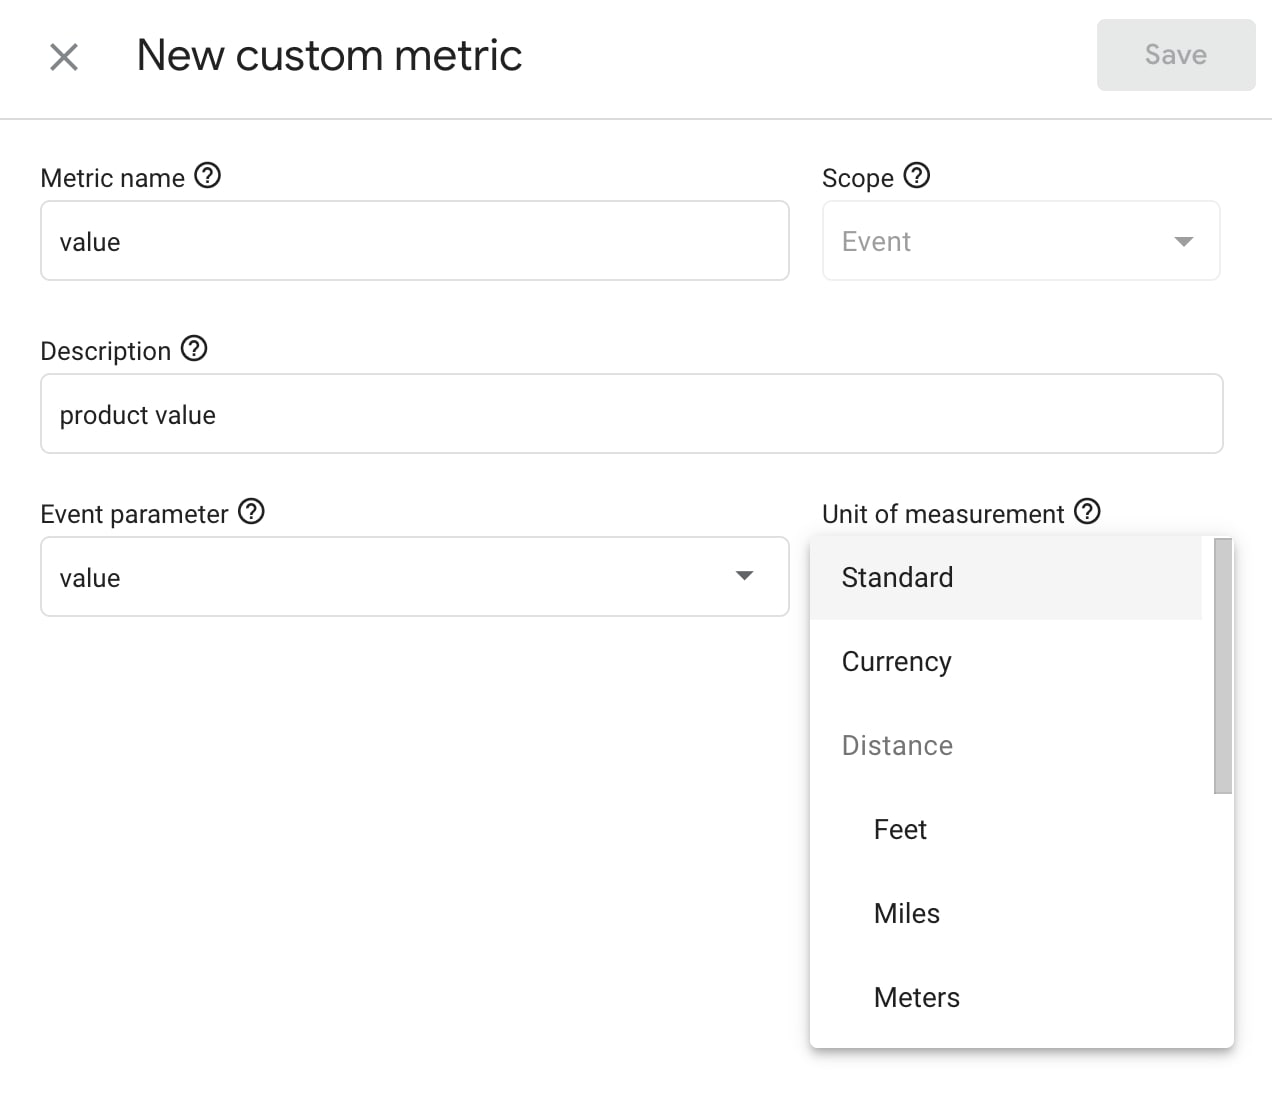
The type you will receive may vary depending on the metric you choose. When you save this metric, you will now be able to report the data with this metric name.
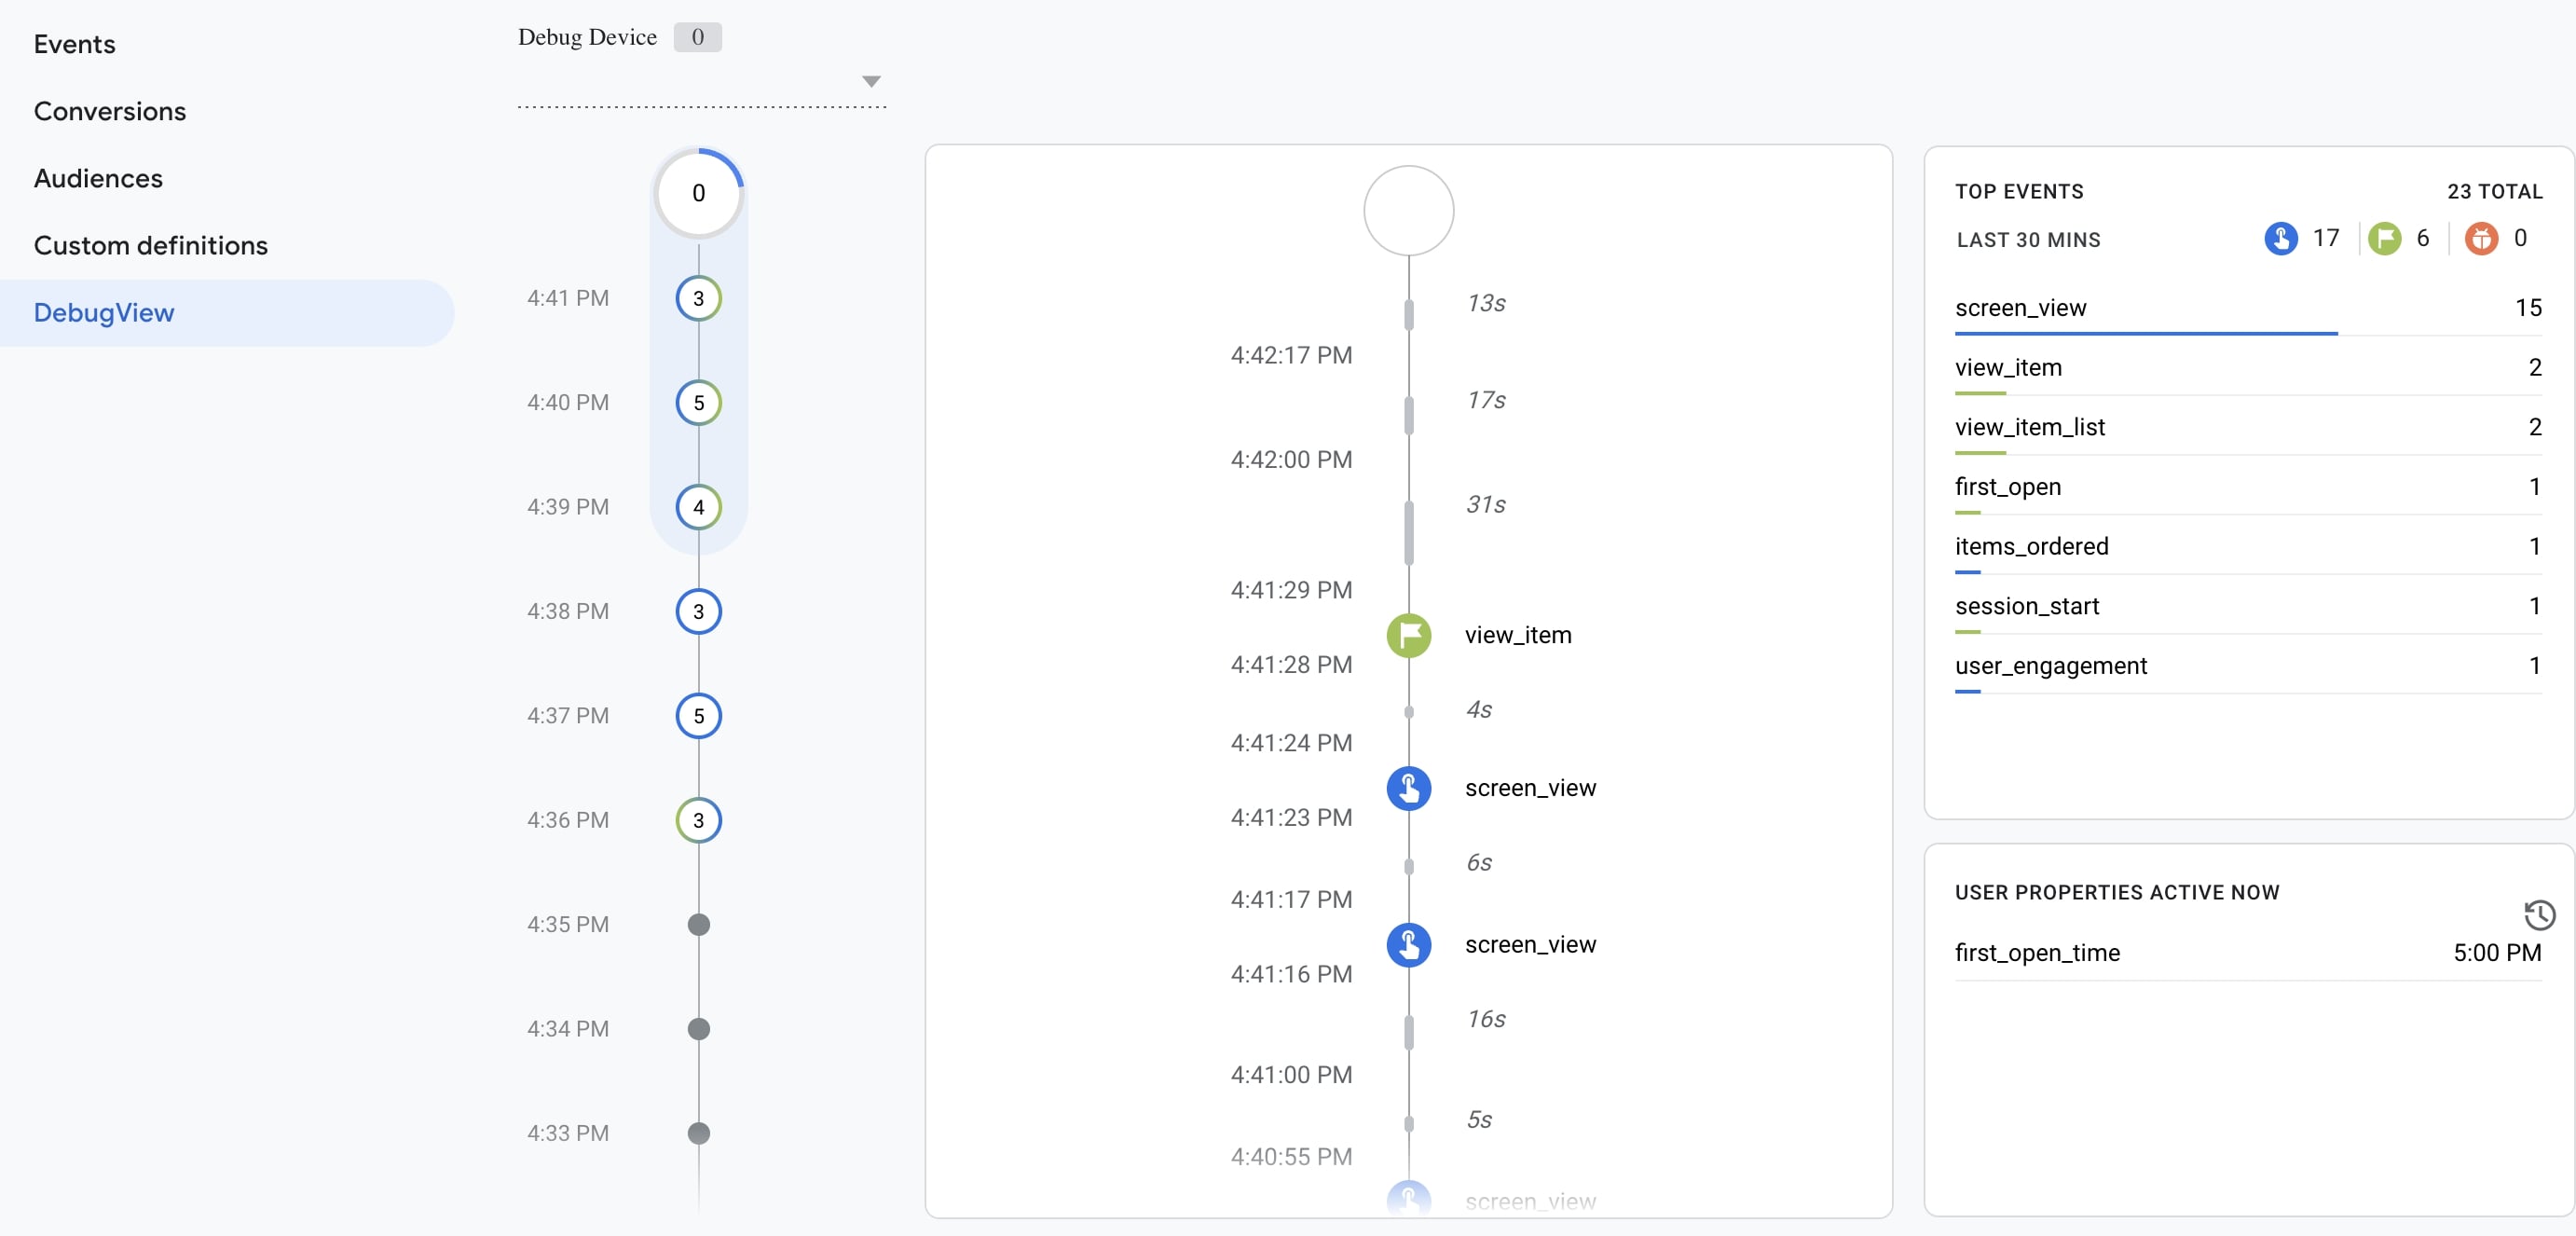
DebugView
When you make any edits from the Google analytics panel or the integration tool you use, you may want to see and test it live.
You used to check this using real-time data on Universal Analytics, but GA4 provides you with the DebugView feature.
DebugView allows you to check the incoming data at a more granular level (without the need to wait for hours).
Unlike the Preview feature in Google Tag Manager, DebugView displays the data only when the "debug" parameter is added.
Follow the steps to implement DebugView:
There are two methods for this. The first method is to install the extension called Google Analytics Debugger to enable debug mode in your browser. To monitor all the events on a page, add a 'debug_mode':true parameter to your gtag('config'), as shown here: gtag('config', 'G-123ABC456DE',{ 'debug_mode':true }); If you want to see only certain events, add this parameter only to those events. gtag('event', 'xyz', { 'debug_mode':true }); To disable debug mode, exclude the 'debug_mode' parameter; setting the parameter to false doesn't disable debug mode.

Define the debug mode parameter in the GA4 configuration.
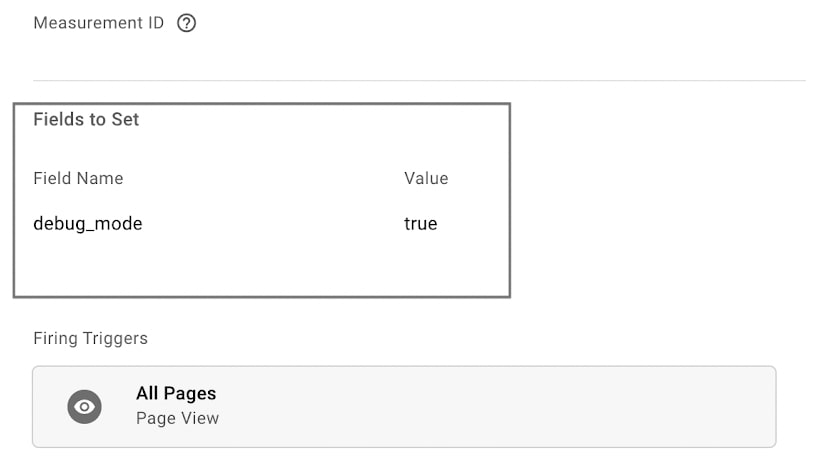
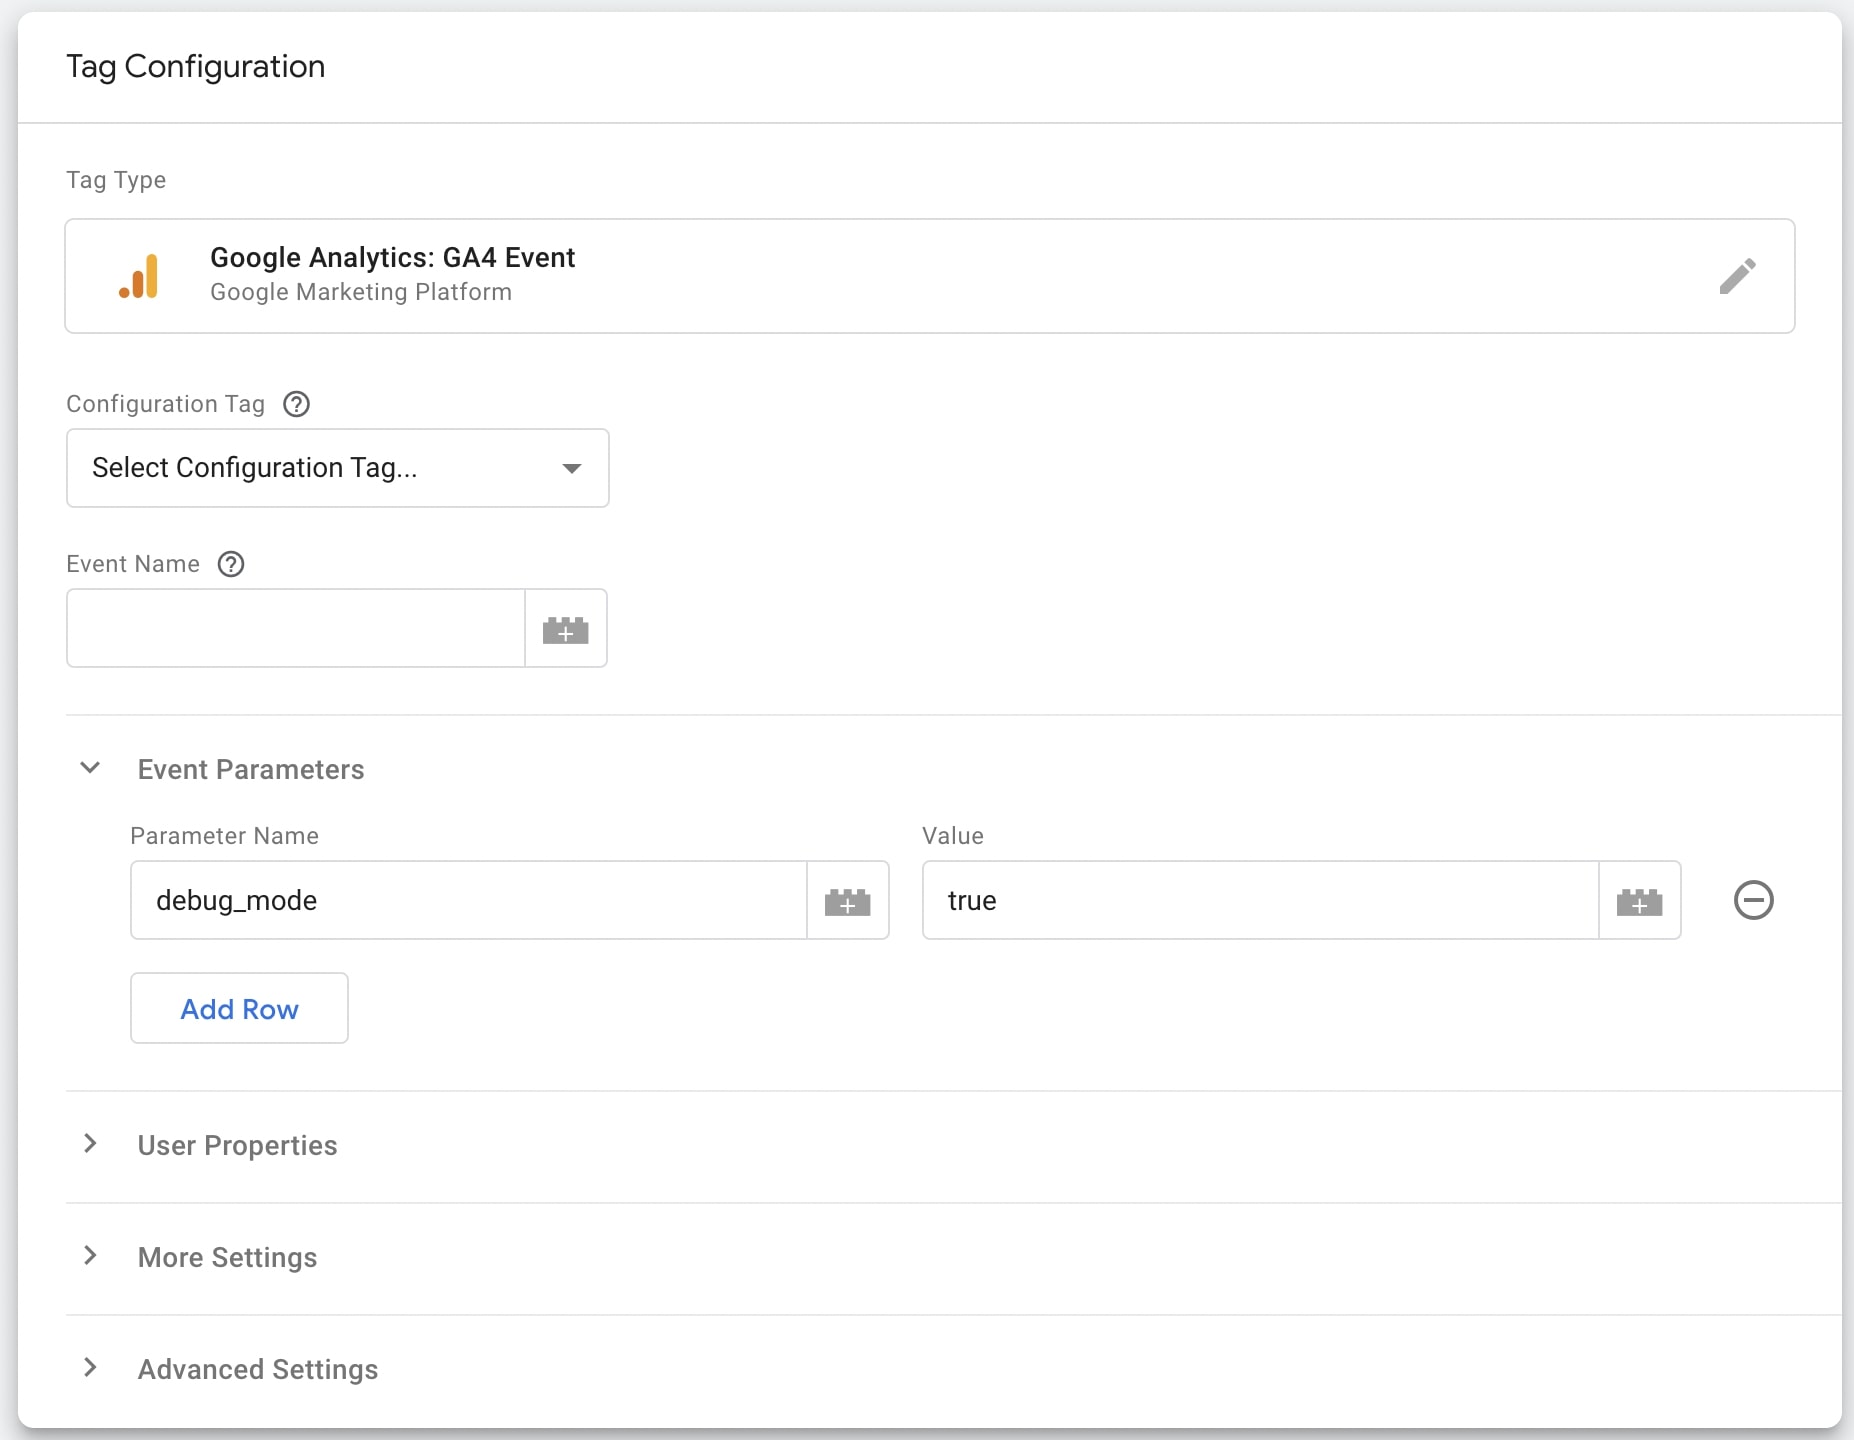
If you only want to see it for a specific event, define the debug mode parameter in the GA4 event. To disable debug mode, exclude the 'debug_mode' field; setting the field to false doesn't disable debug mode.
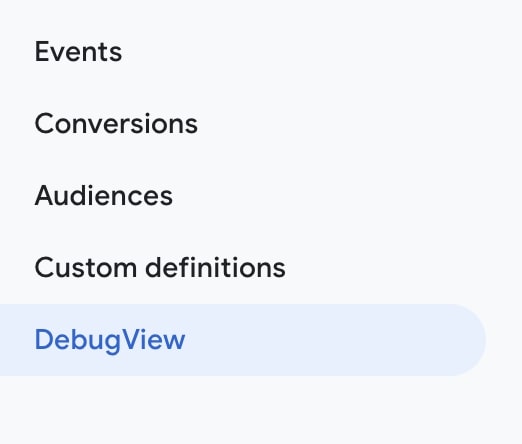
Find 'DebugView' right below 'Custom definitions'.
As you navigate through your site or application and trigger events, you will be able to see what you have done in DebugView. Here you can see the data in seconds and minutes. You can follow all the events triggered in the last 30 minutes from the upper left corner and learn the details.
