The homepage displays the most significant summary data you want to see in the GA4 panel.
You can use the page to monitor traffic, navigate around Analytics, and get insights about your websites and mobile apps.
As you use the Analytics panel, the homepage offers a more personalized view.
If your property isn't receiving data, you'll see a banner along the top with instructions to create a data stream or set up data collection.
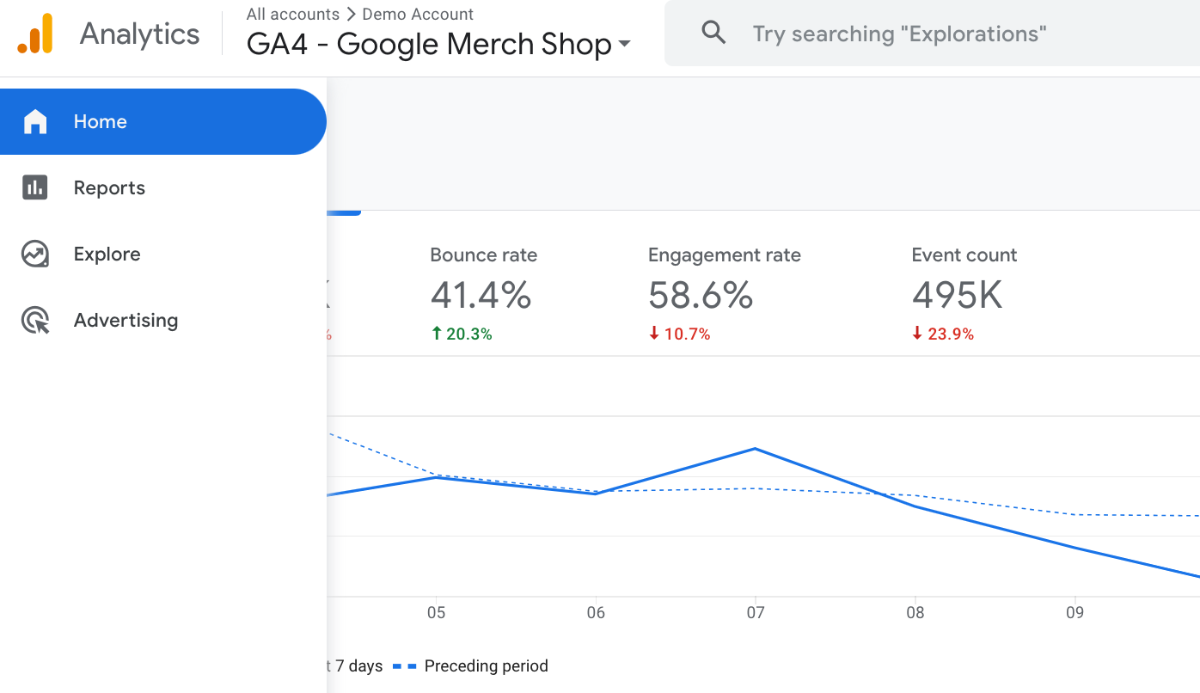
Home in Google Analytics 4 Interface
Go to the Google Analytics 4 (GA4) website and log in. Click Home in the left navigation.
Overview in Google Analytics 4 Interface
In Overview, you can see four metrics at once. This page shows Users, New Users, Average engagement time, and Total Revenue.
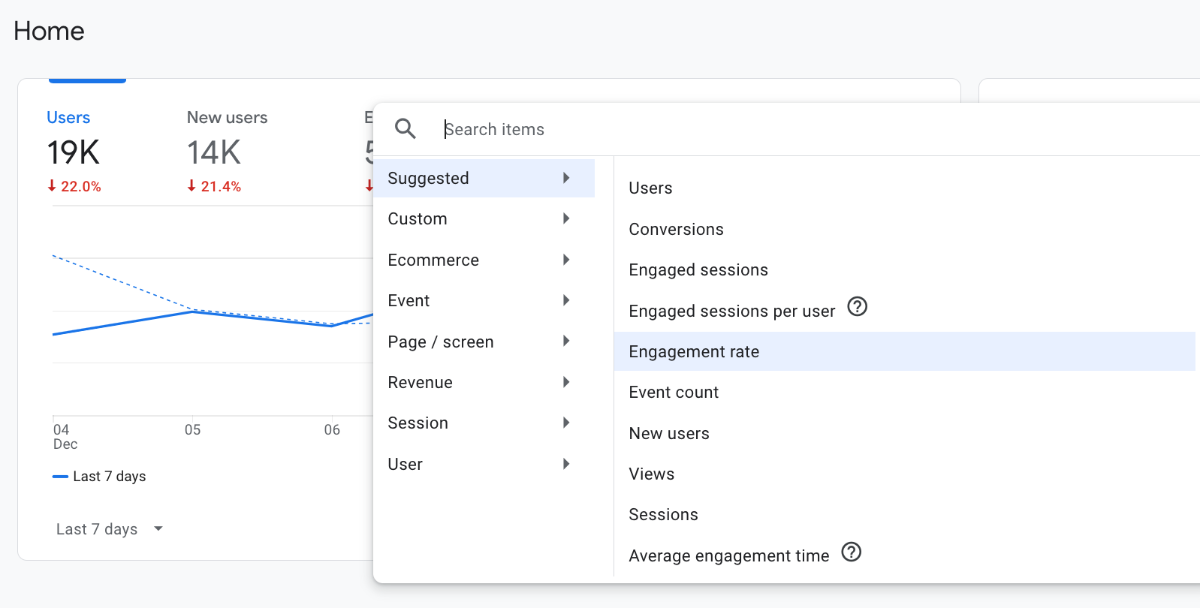
However, if you hover your mouse over metrics, you will notice that you can select from a variety of metrics.
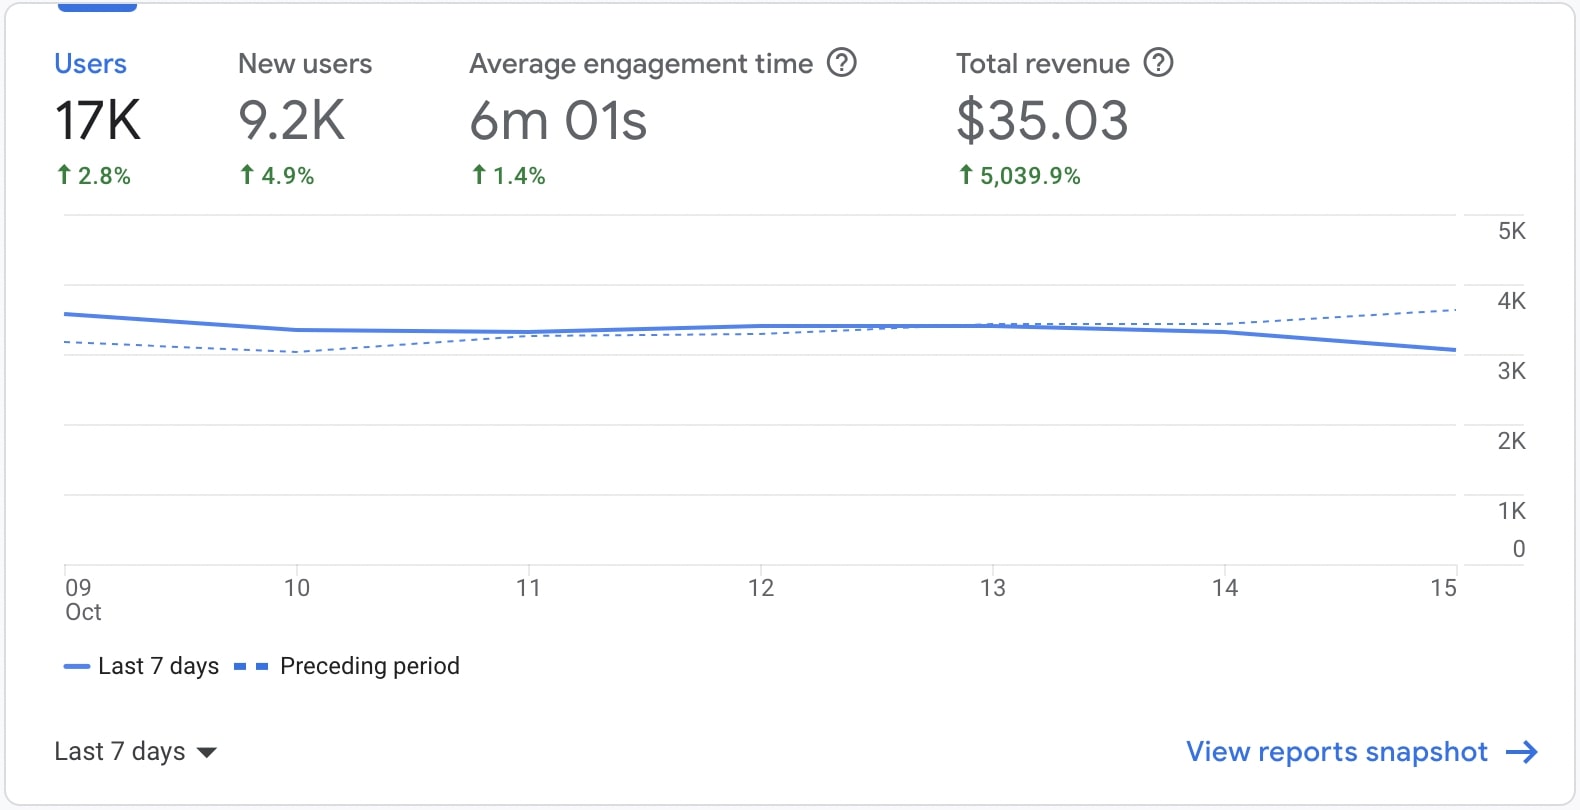
You can access the usage and calculations of the User and New User metrics in the GA4 panel through a detailed comparison between Universal Analytics vs. Google Analytics 4. Total Revenue shows the sum of revenue from purchases, subscriptions, and ads. Average engagement time is the average engagement time per active user for the selected period.
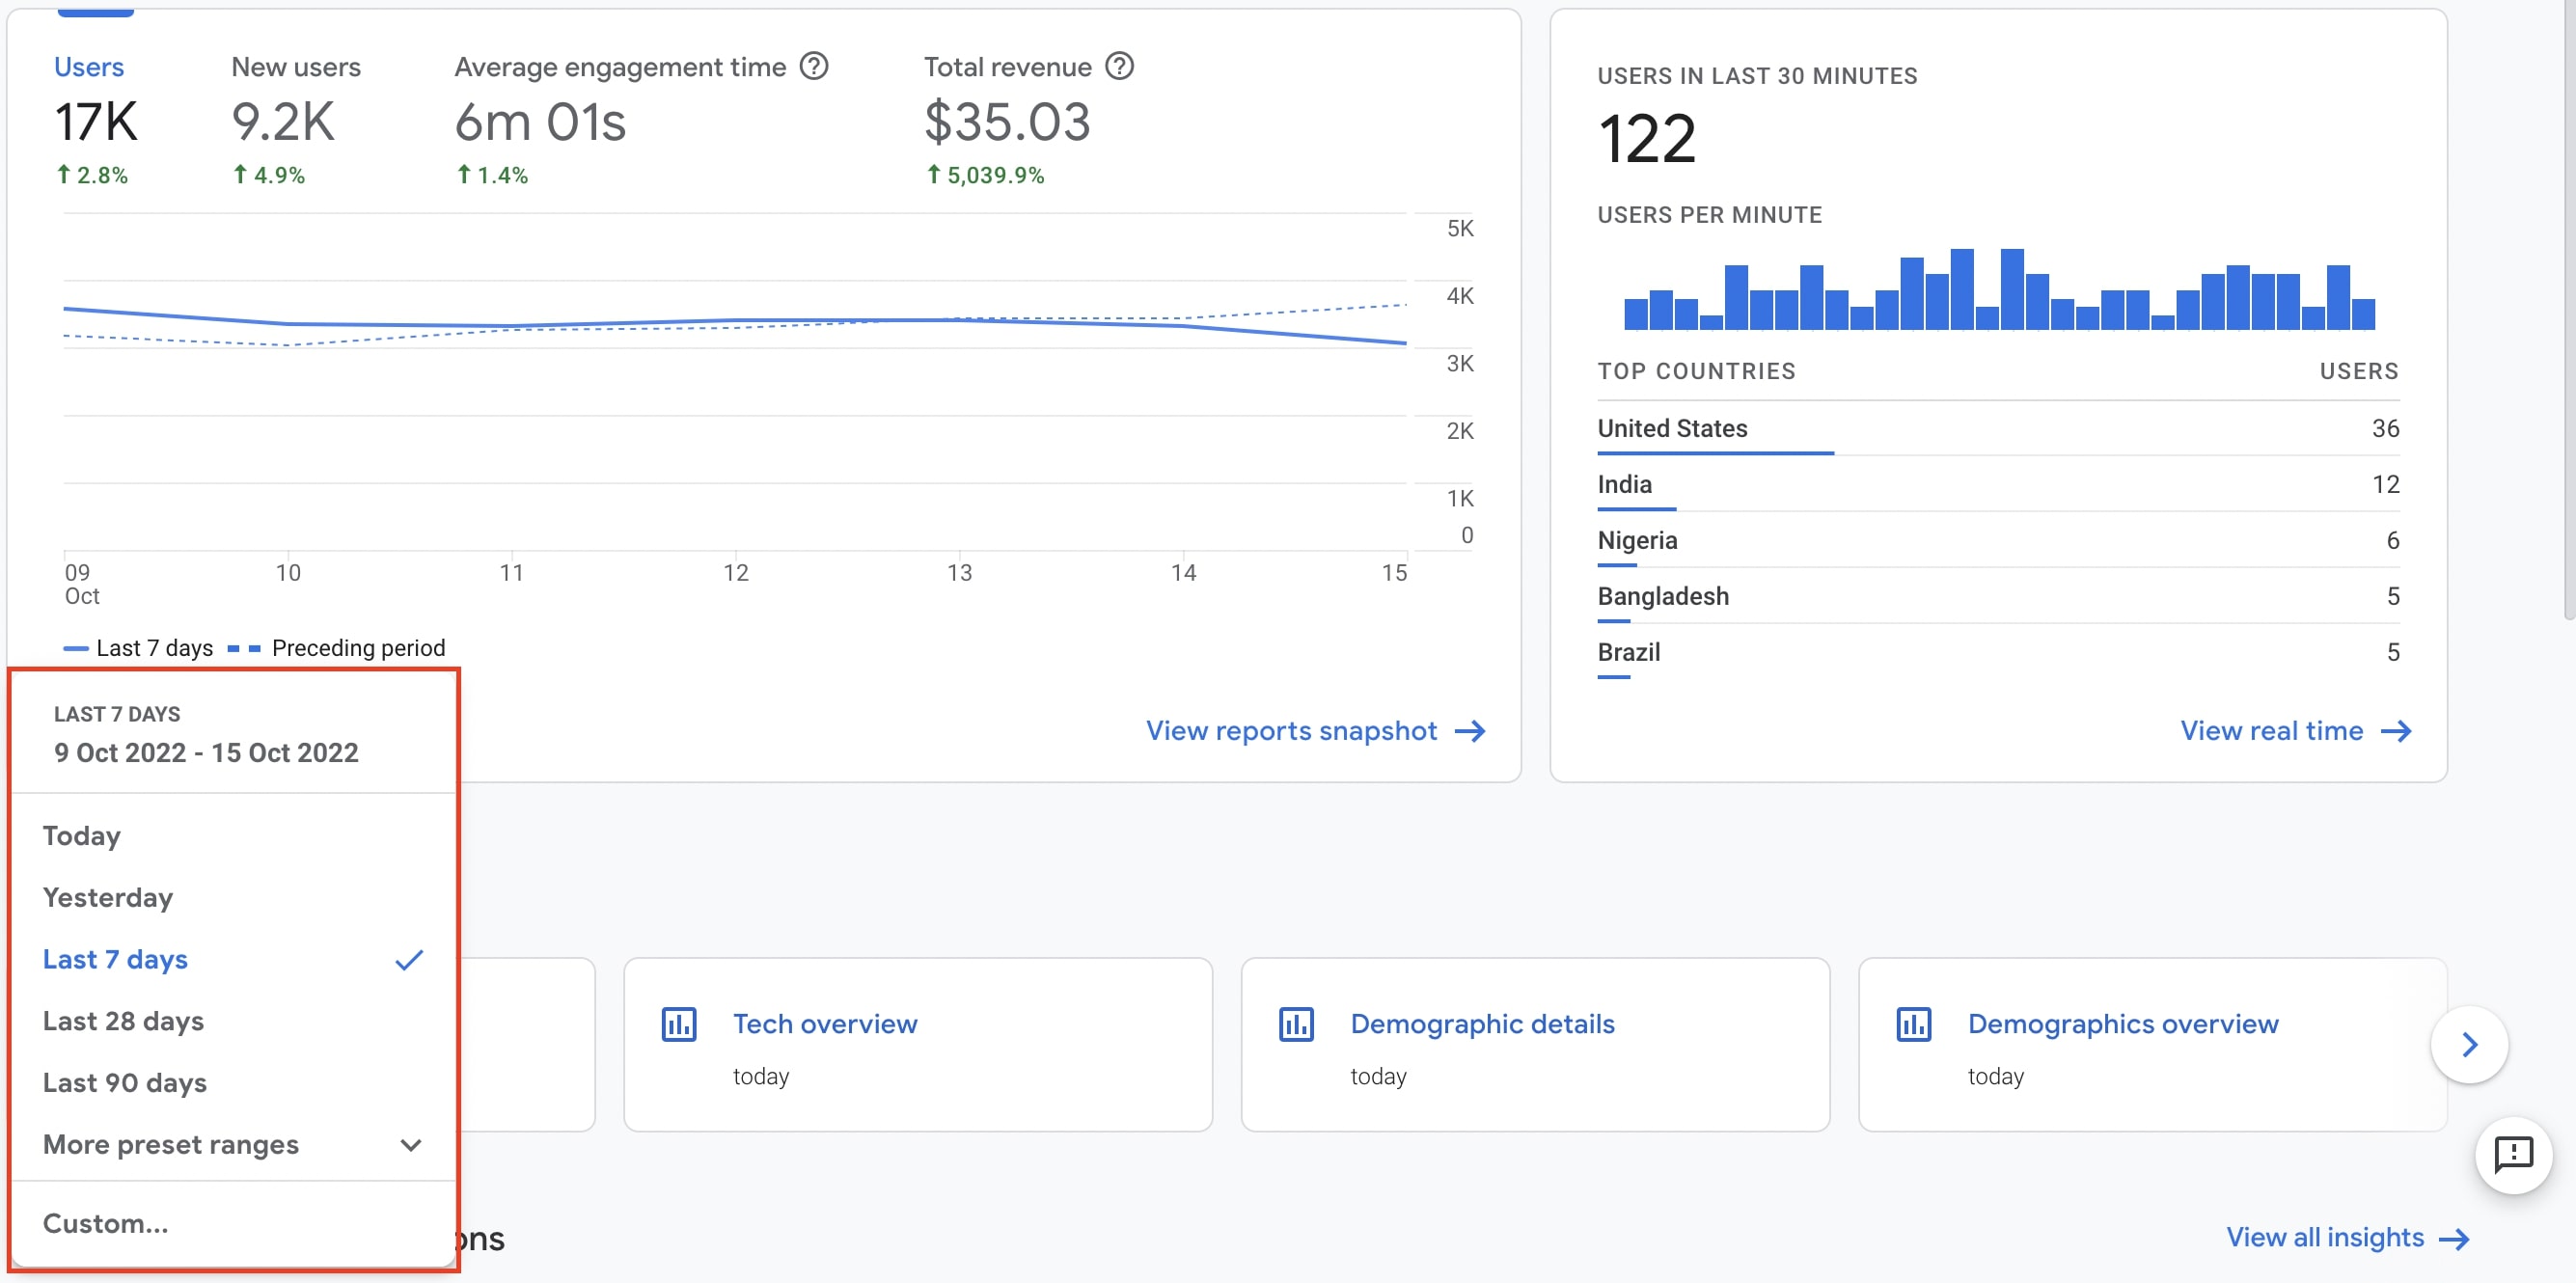
You can select the time field in the lower left corner and select the desired interval. If you don't want to use the preset time slot, you can also create your own custom time slot from the Custom field.
If you want to see the report in more detail, you can click on the View Reports Snapshot field.
Realtime in Google Analytics 4 Interface
The Realtime card shows the activity status of users in the last 30 minutes in up to 5 countries.
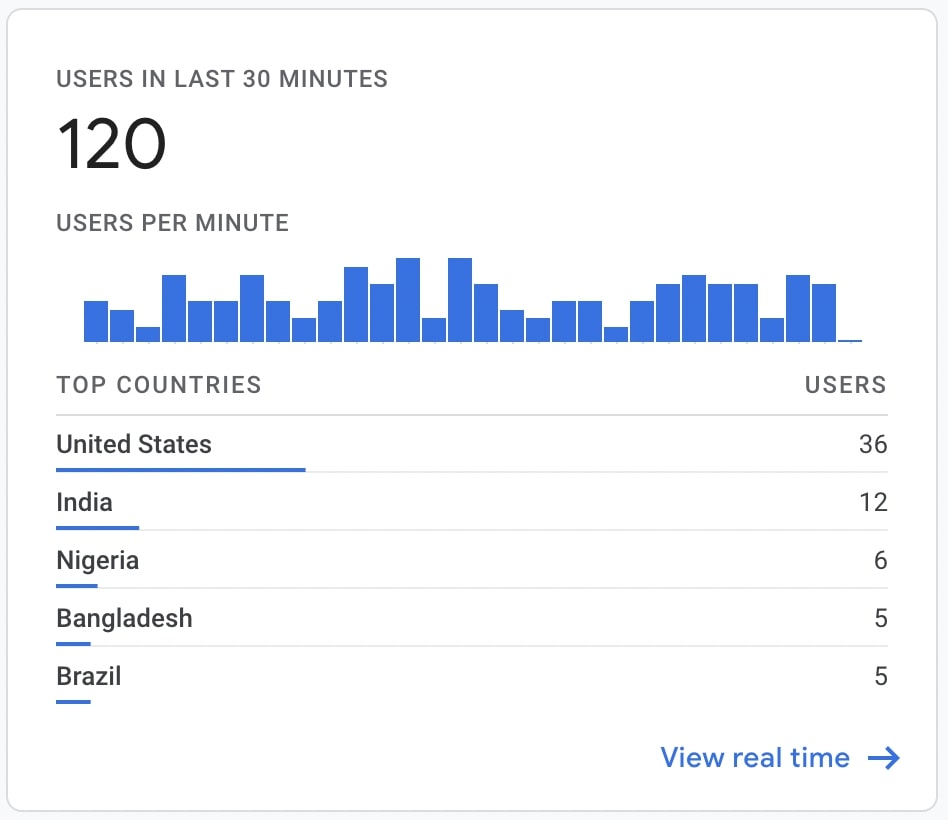
If you want to see the report in more detail, you can click on the View Realtime field.
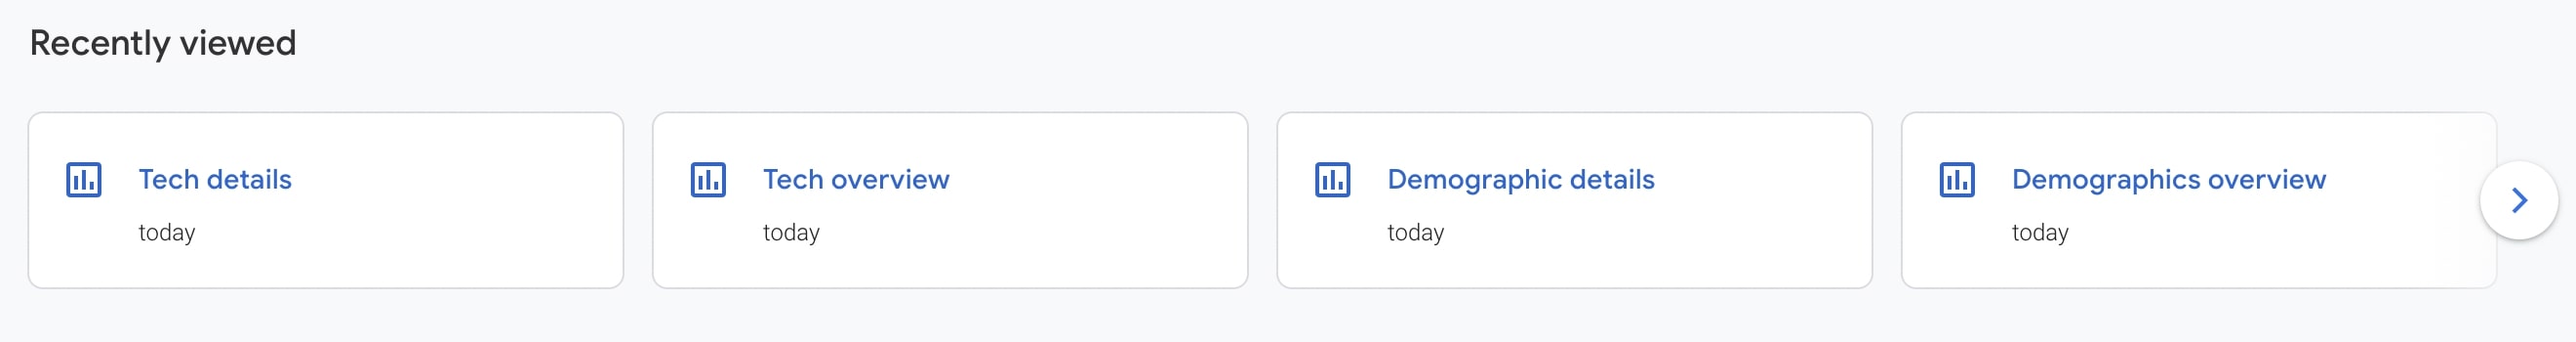
Recently Accessed in Google Analytics 4 Interface
On the Recently Viewed card, you can access the names and links of the last pages you visited in the analytics panel.
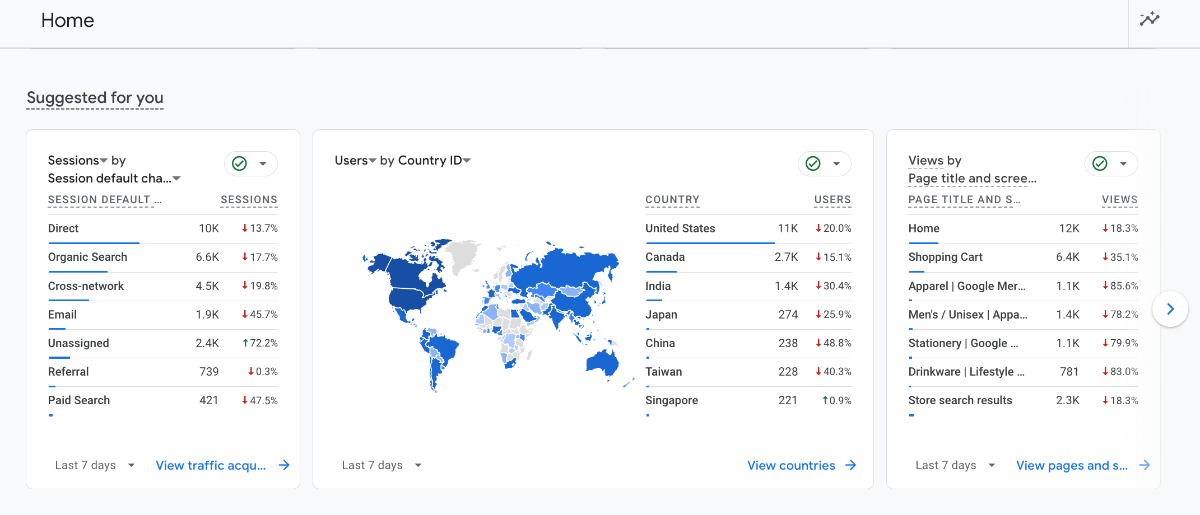
Suggested For You in Google Analytics 4 Interface
Google suggests cards that are used a lot across all of its sites. This part also has cards that you've looked at a lot.
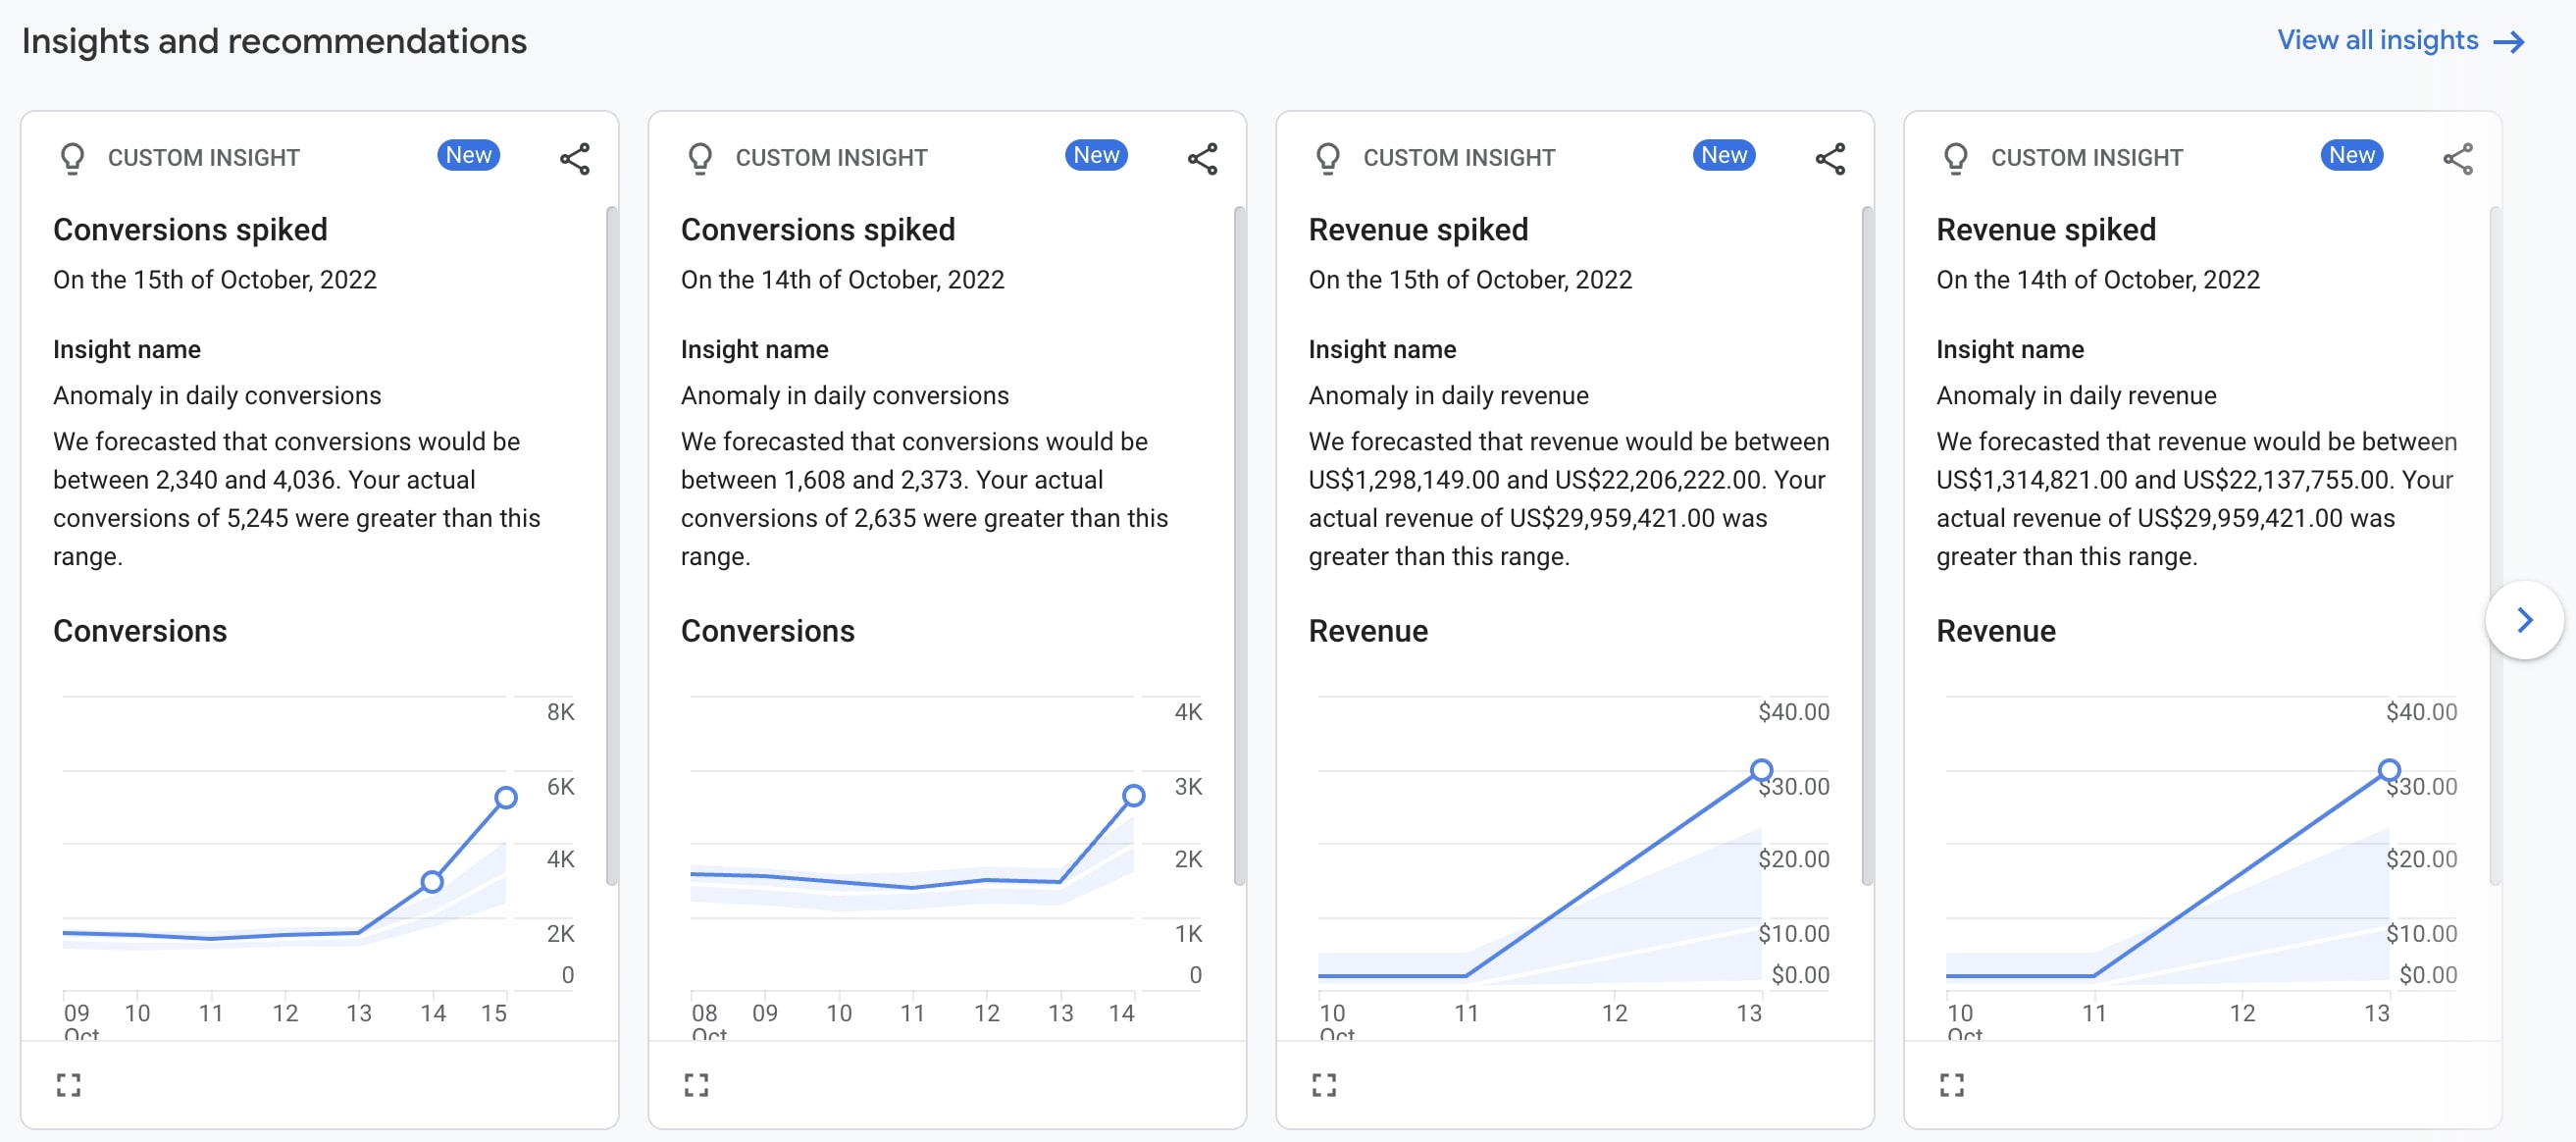
Insights in Google Analytics 4 Interface
If your site or app has unusual changes, emerging trends, anomalies, or areas that need improvement, you can see it in the Insights card.
Conclusion: Understanding Google Analytics 4 Interface
The GA4 homepage gives you quick access to your most important data with a clean, customizable interface.
You can easily track key metrics, monitor real-time activity, and access your frequently used reports all in one place.
Google even helps you spot unusual patterns through the Insights section, saving you time when looking for opportunities or issues.
