Advertising provides you with top-notch information on user journeys.
You can easily monitor the ROI of your advertising campaigns across all channels to make wise decisions about budget allocation and check out attribution models.

In this section, you can find invaluable details ranging from insights into your campaigns, and paid and organic traffic sources. These details help you see:
- The impact of paid and organic channels on conversions,
- How many touchpoints users take to convert,
- Which channels provide the most conversion,
- How long it takes for a customer to make a purchase after initial interest,
- The revenue a specific conversion path generates.
In addition, GA4 currently provides three attribution models which are very important for the reports created here.
You can choose between data-driven attribution, rules-based models for paid and organic channels (like time decay for paid and organic channels), or the Google paid channels last click model in the Attribution settings.
You will decide which attribution model (or models) you want to apply to the metrics so you can try multiple models to make performance comparisons.
As of November 2023, you can no longer use the first click, linear, time decay, and position-based attribution models.
To use Advertising efficiently, you should make sure that your GA4 property is linked to your Google Ads account(s).
Also, you need to configure your conversions and apply campaign tags to all your inbound marketing campaigns
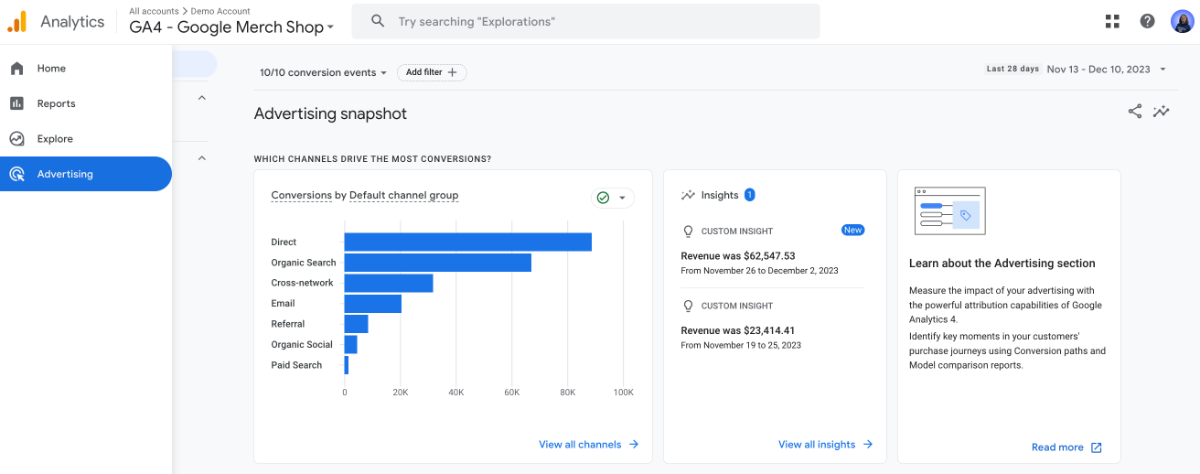
Advertising Snapshot In GA4
You can see a general overview of your conversion performance and business metrics, and discover more through adding filters and summary cards focusing on important questions here.
For example, Advertising Snapshot allows you to monitor which channels drive the most conversions, or the most efficient conversion paths.
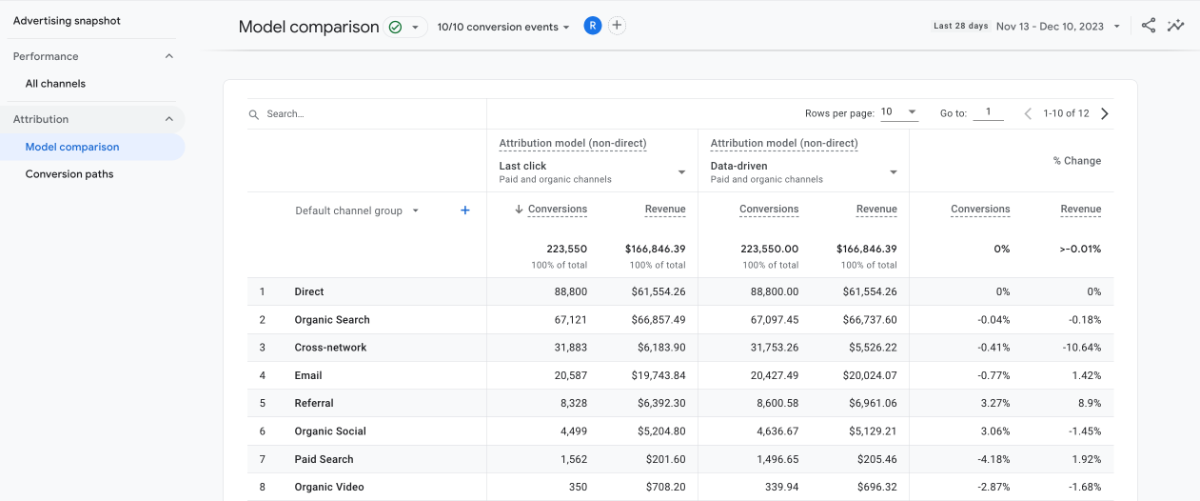
Model Comparison In GA4
With Model Comparison, you can choose two attribution models to view and compare the number of conversions and the revenue related to your marketing channels. The reports here provide a percentage change when using different models to let you better analyze the conversions. You can customize your reports by choosing which conversion events to be monitored, setting reporting time, and adding filters to include particular events or users.

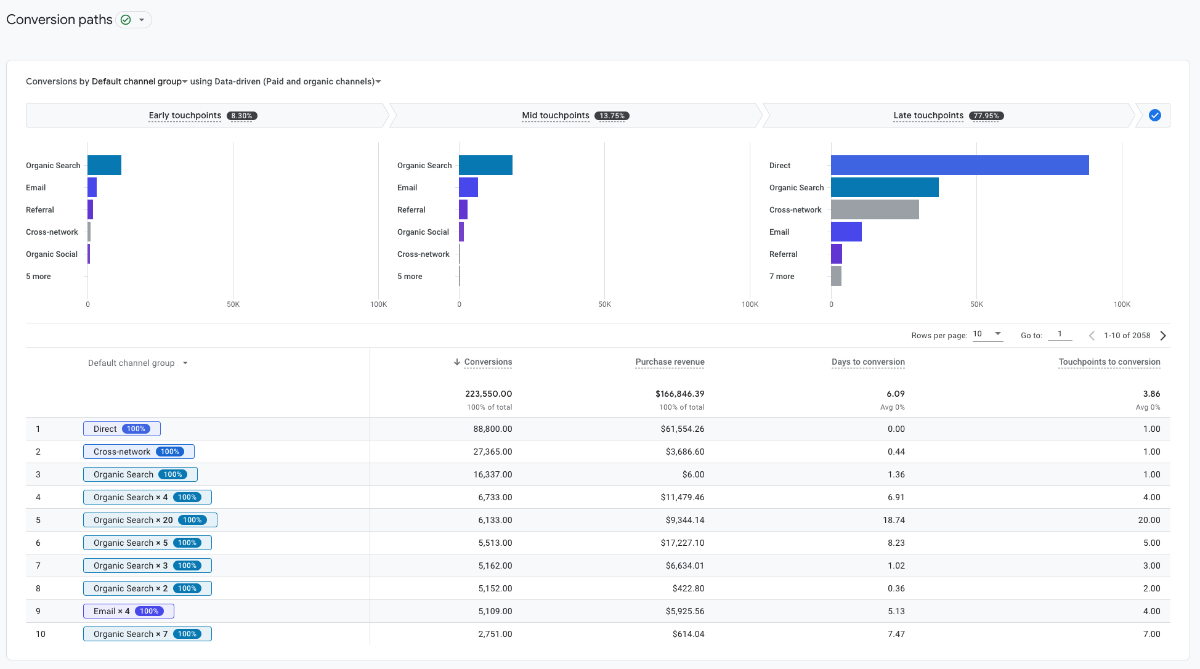
Conversion Paths In GA4
The reports and graphics that you can see here display the touchpoints that lead to conversions under a specific attribution model and a time period.
They provide significant details such as conversion credit distribution for each touchpoint which can give you a better idea about how your users convert.
You can customize the data provided here by choosing the events to be displayed, the number of touchpoints to be included, and specific users to be filtered.

