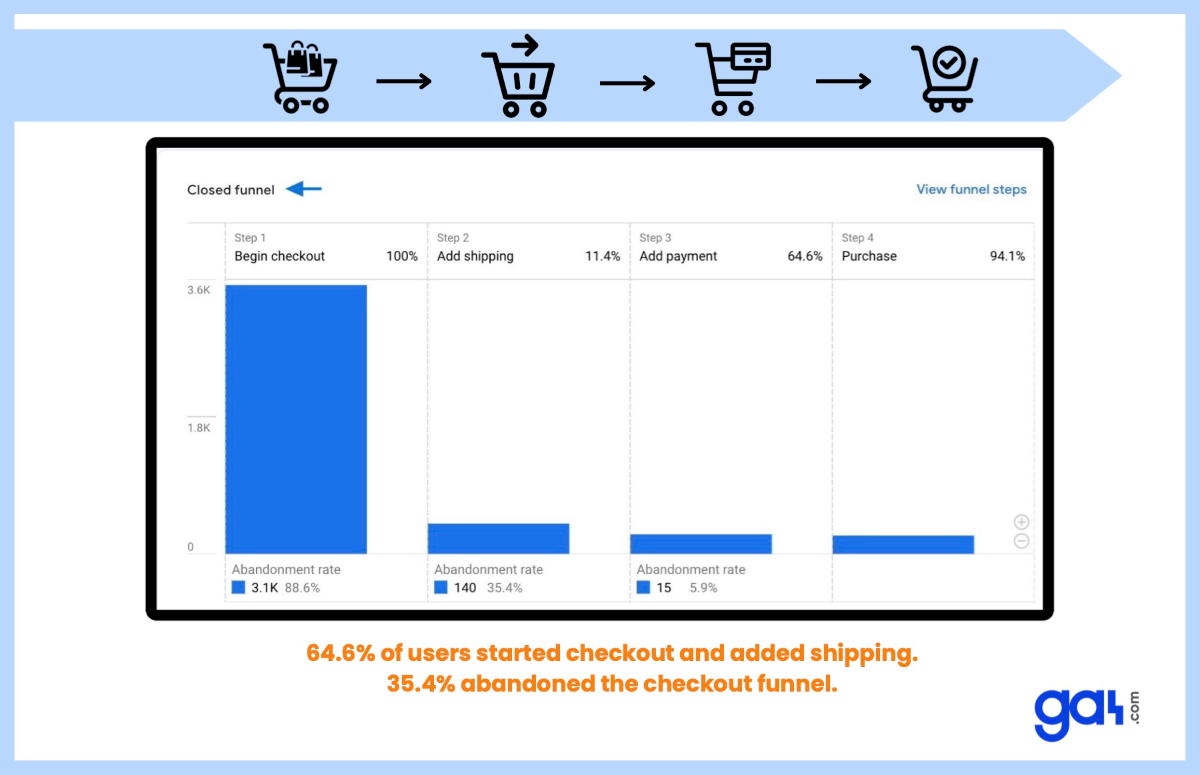
Google has recently introduced a new report called Checkout journey report that aims to assist ecommerce brands in identifying potential issues during the checkout process. You can locate the problems and delays in the checkout process using this report.
Checkout journey report shows the number of users who successfully
completed each step of the checkout process
(
add_shipping_info
,
add_payment_info
, and
purchase
) after starting the checkout process on your eCommerce website or app.
But it only focuses on users who started at the first step (
begin_checkout
event) and did not start at a different step in the funnel.
Example:
Let's say you run an online clothing store and notice that a lot of people leave before they get to the page where they enter their payment information. At this point, a lot of people are abandoning their shopping carts. You should pay attention to the payment page itself to fix this problem. Look at the available payment methods, the design of the payment form, the security claims, and any error messages that could stop people from completing their purchases.
What is GA4 Checkout Journey Report?
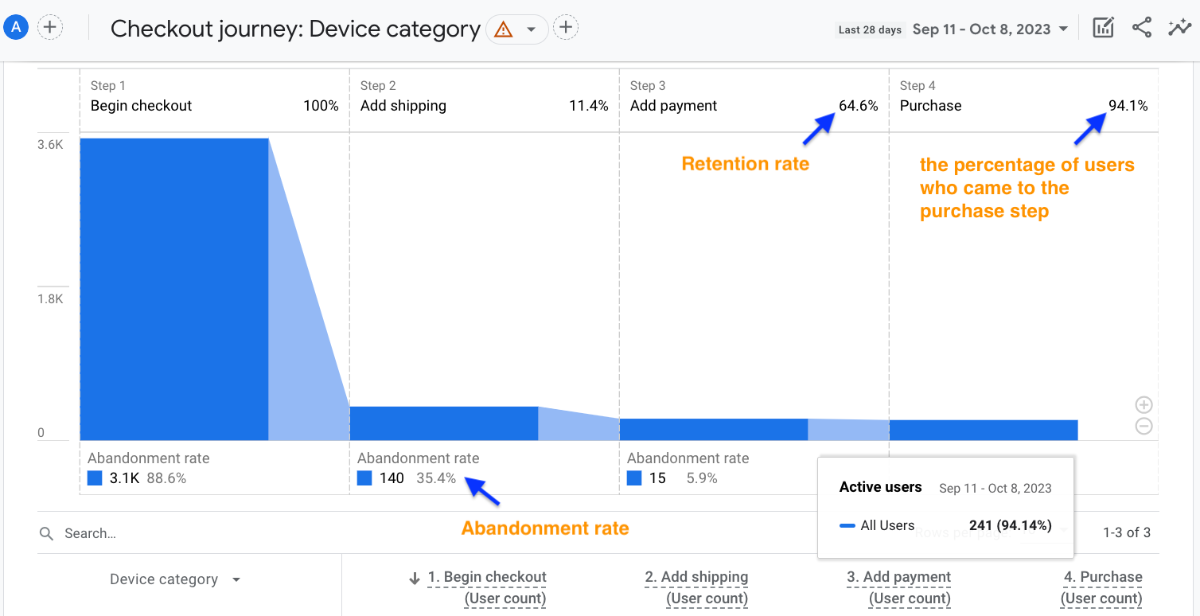
If you move your mouse over the bar chart in this report, you can see how many users finished the current step. 94.14% of users made it to the purchase step, which is a good rate.
The abandonment rate , which is shown below every step except the last one, tells you how many users didn't move on to the next step of the funnel.
The retention rate is the number of users who successfully went from the previous step to the next one.
You need to set up the eCommerce events in order to see data in the Checkout journey report.
These events are:
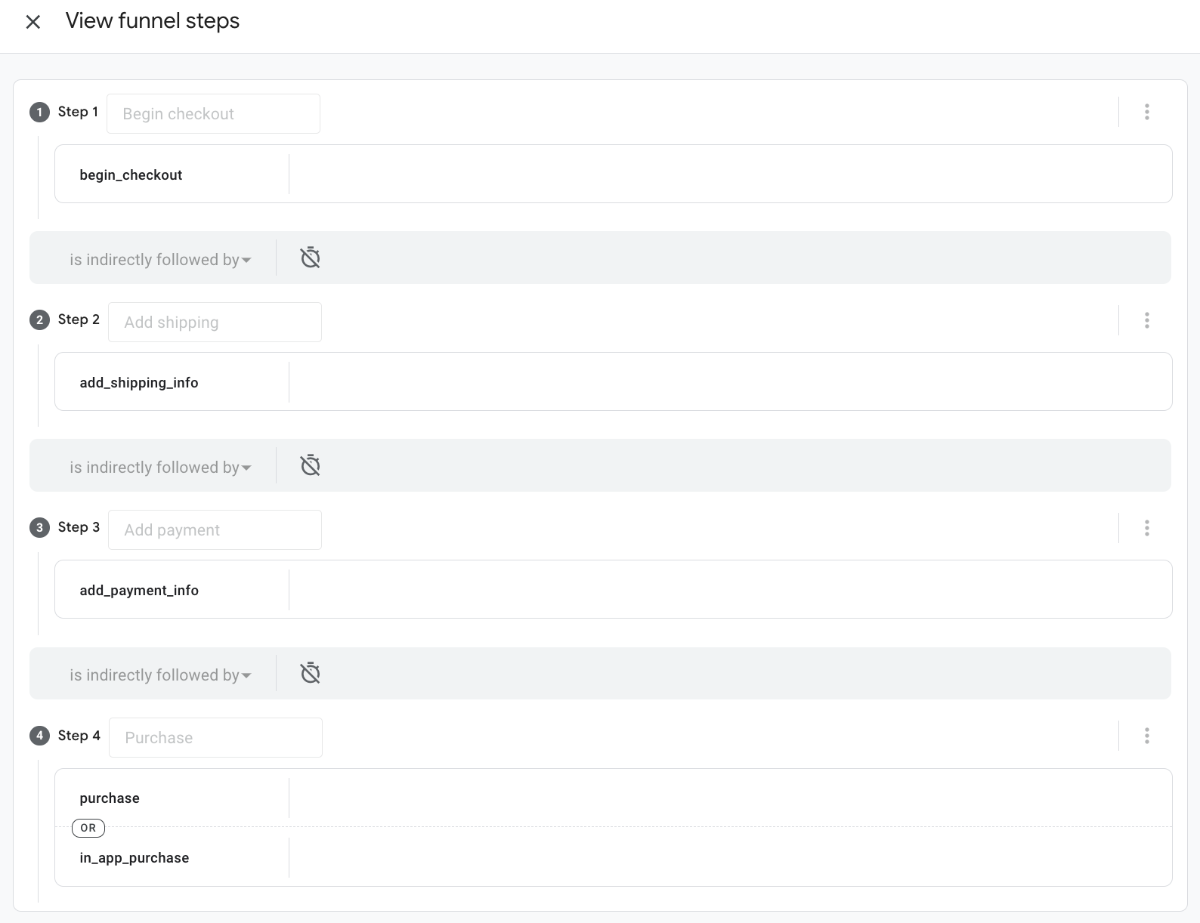
- begin_checkout: the first step of the checkout process
- add_shipping_info: populates the Add shipping step
- add_payment_info: populates the Add payment step
- purchase: populates the Purchase step
Where to Find the Checkout Journey Report in GA4?
It is very simple, follow the steps:
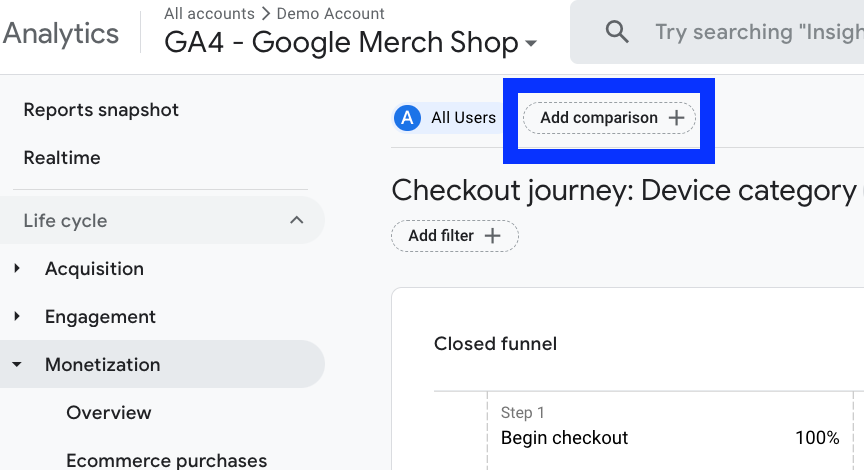
Go to reports section in the left side menu.
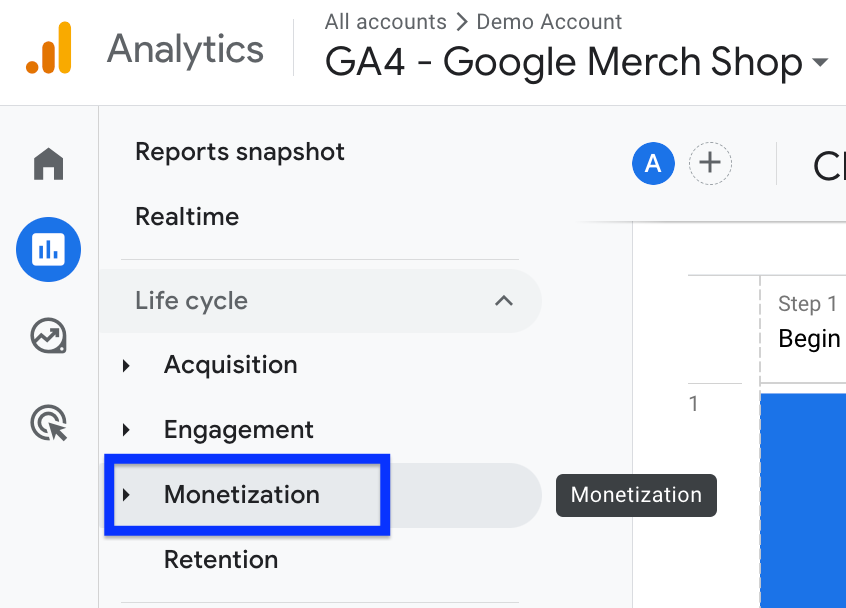
Find Monetization report under Lifecycle.
Here is your checkout journey report.
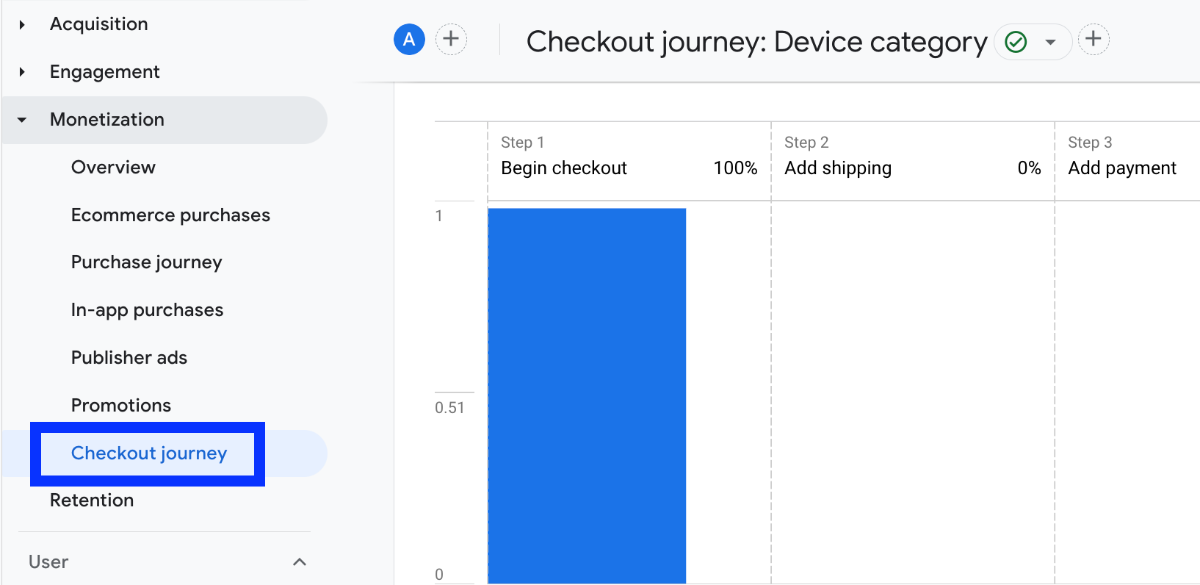
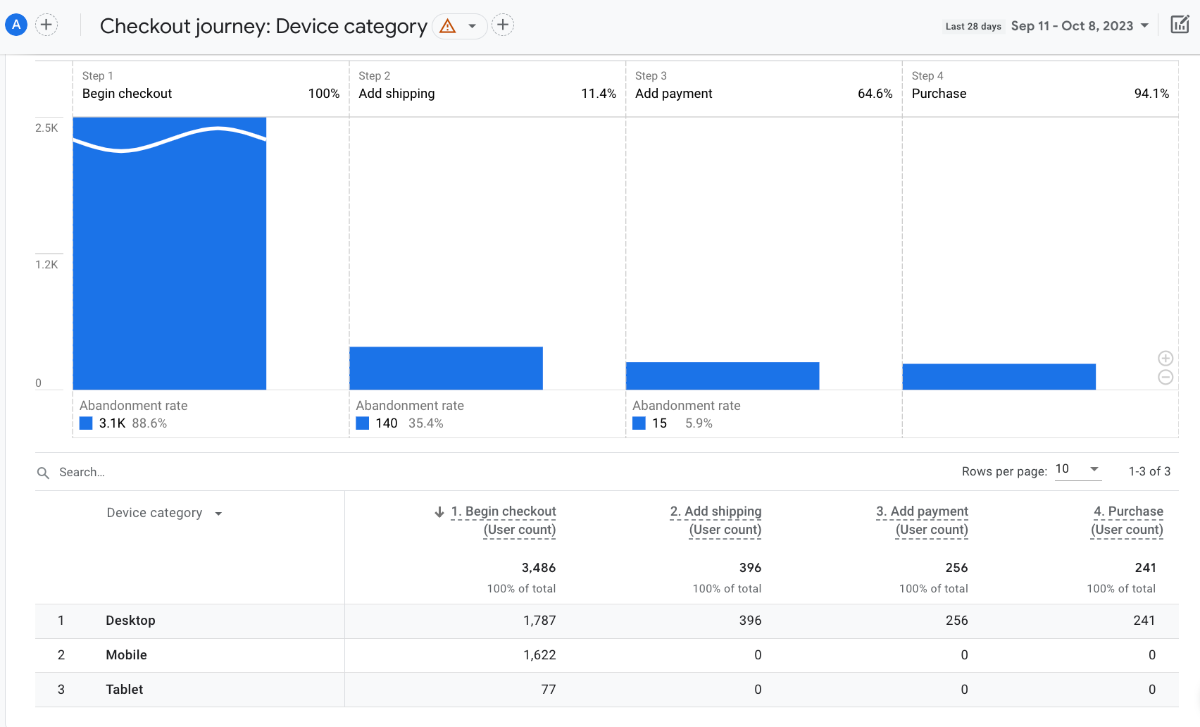
By default, the report displays the data by the "Device Category" dimension (see the image above).
By clicking the drop-down arrow in the dimension column, you can change the view and choose one of the following dimensions: Device category, Country, Region, City, Language, Age, Gender, and Browser.
If you don't see the report, you can change the navigation to add it to any collection. Read this post: Customize GA4 Dashboards .
Currently, you can see the steps by clicking on View funnel steps , but you can't change the conditions.
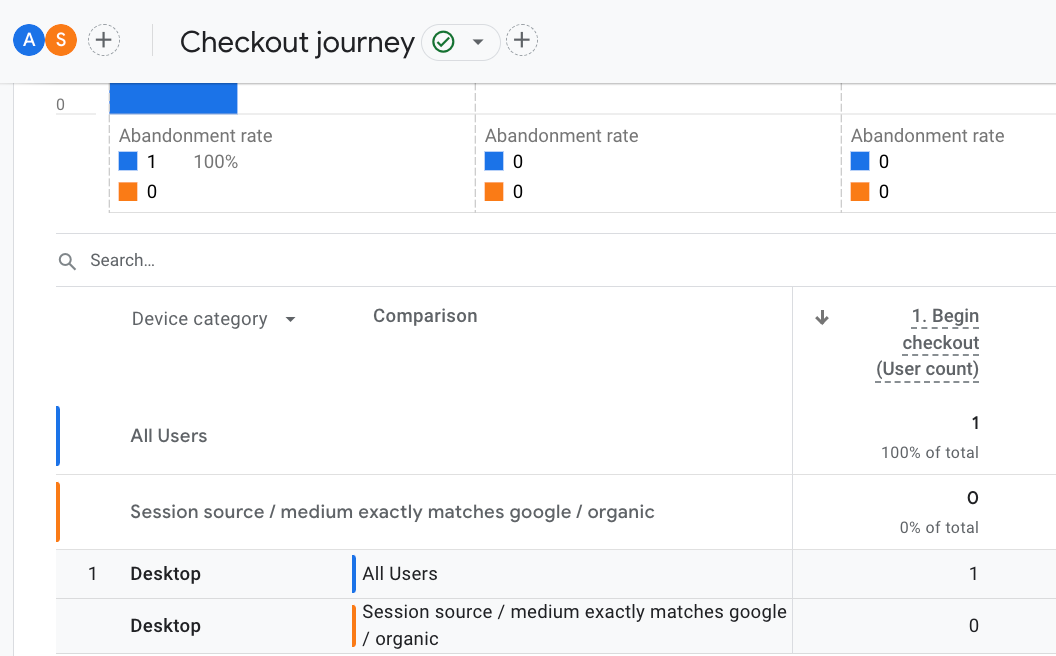
Customize Checkout Journey Report by Comparison
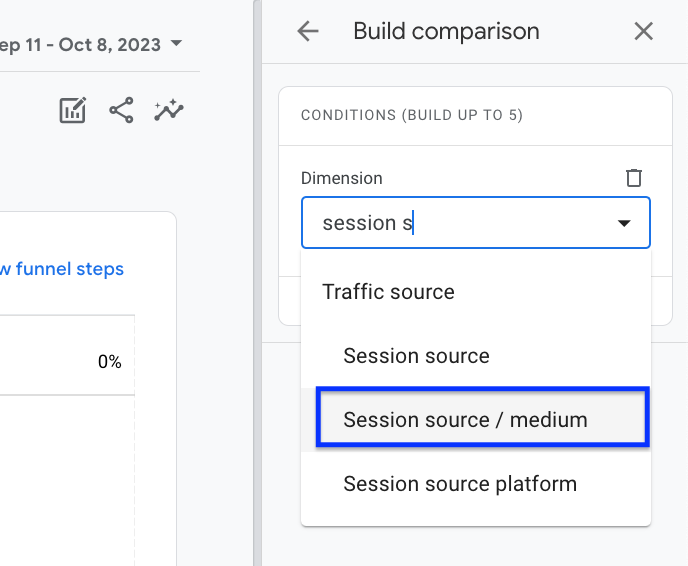
You can use the comparison feature to segment your report. For instance, we can segment our checkout funnel by organic search traffic. To do that:
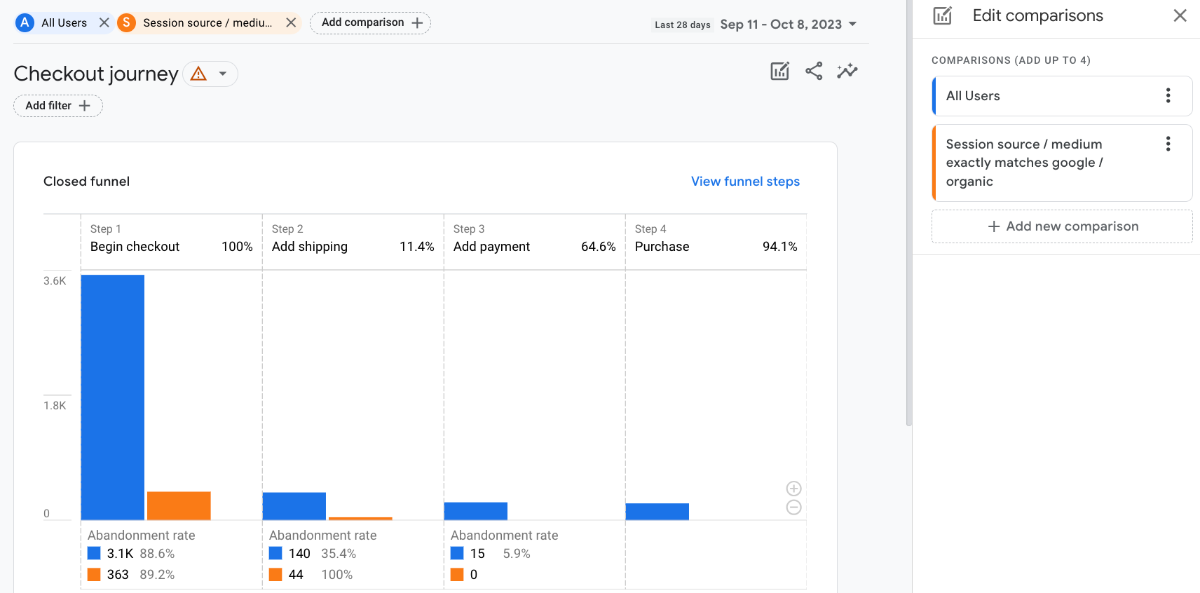
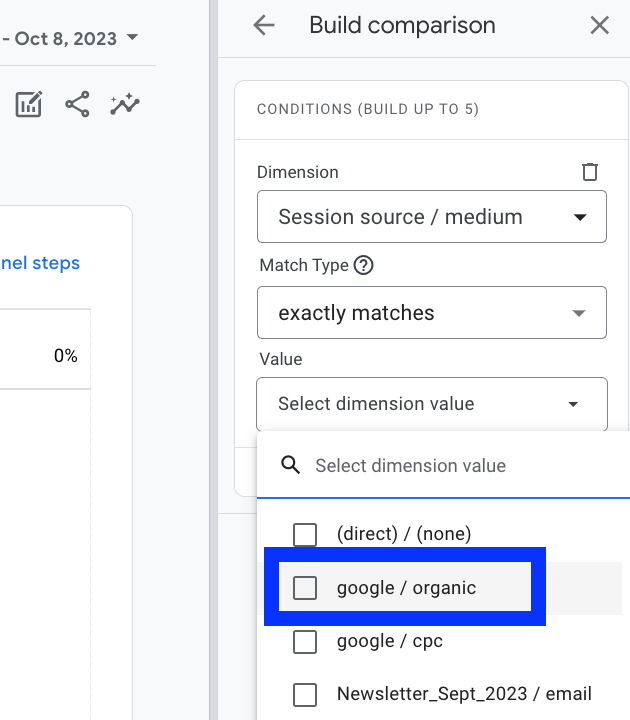
In this case, we choose "session source/medium".
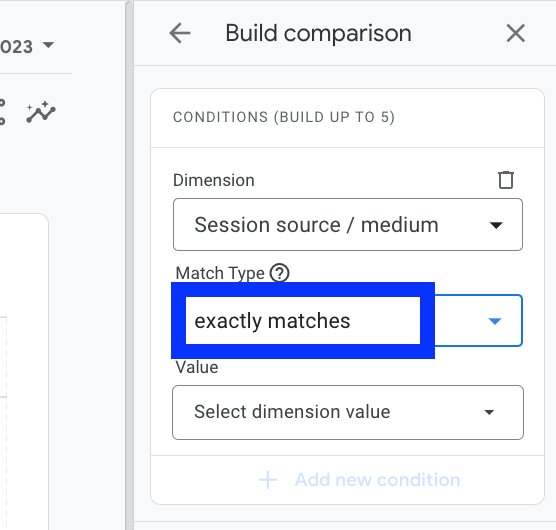
Select "google/organic" since we segment by organic traffic.
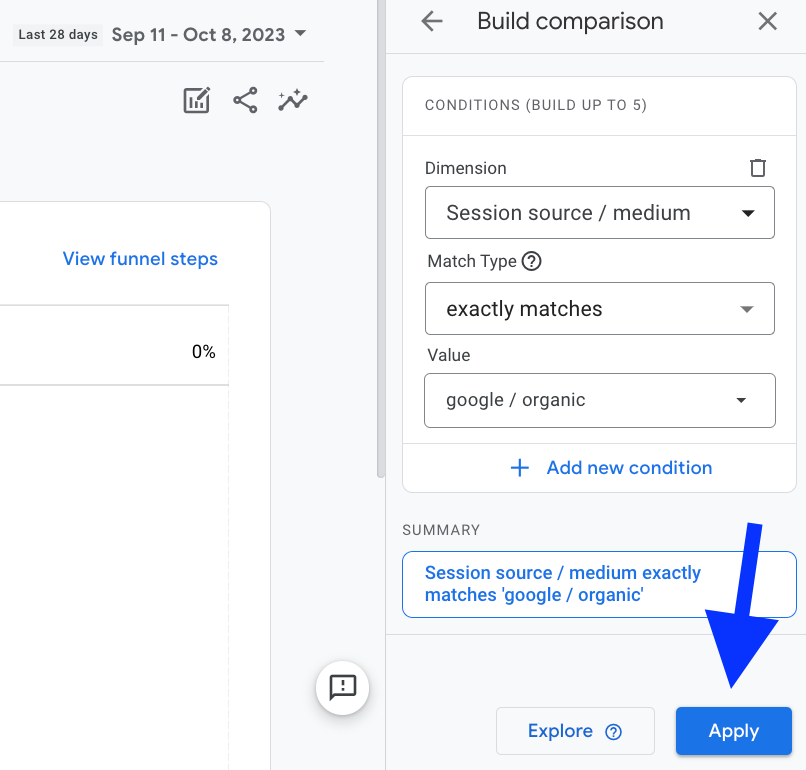
Your report is ready.