Tracking page and screen views is an important part of reporting in Google Analytics 4 (GA4). The pages and screens report emerges as a user-friendly solution for this purpose.
Pages and screens report enables you to monitor and analyze user engagement with their specific web pages and application screens among their users.
We'll uncover the steps to find, access, interpret, and customize the report within the Google Analytics 4 (GA4) interface.
What is Pages and Screens Report Google Analytics 4 (GA4) ?
The pages and screens report is a useful tool in GA4 for tracking how your website and mobile apps are performing according to page and screen views.
With the pages and screens report, you can access a range of data points, including the total number of page and screen views, the average time spent on each page or screen, and conversions. You can also view data on unique page or screen views.
How to View Pages and Screens Report in GA4?
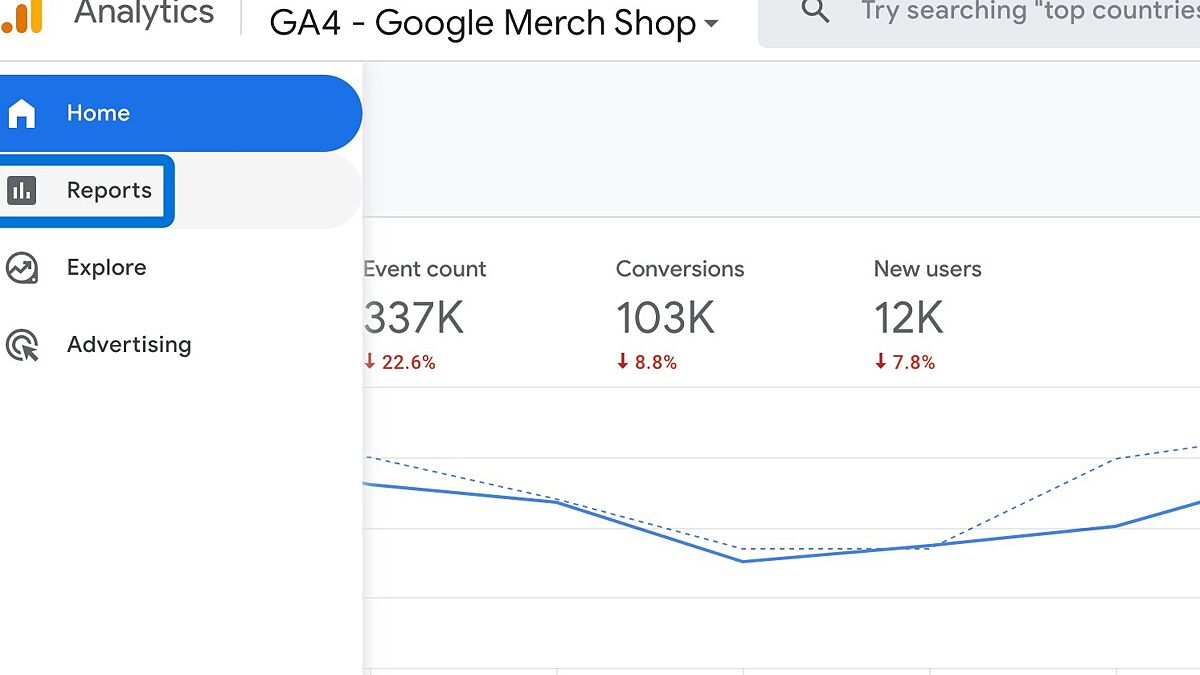
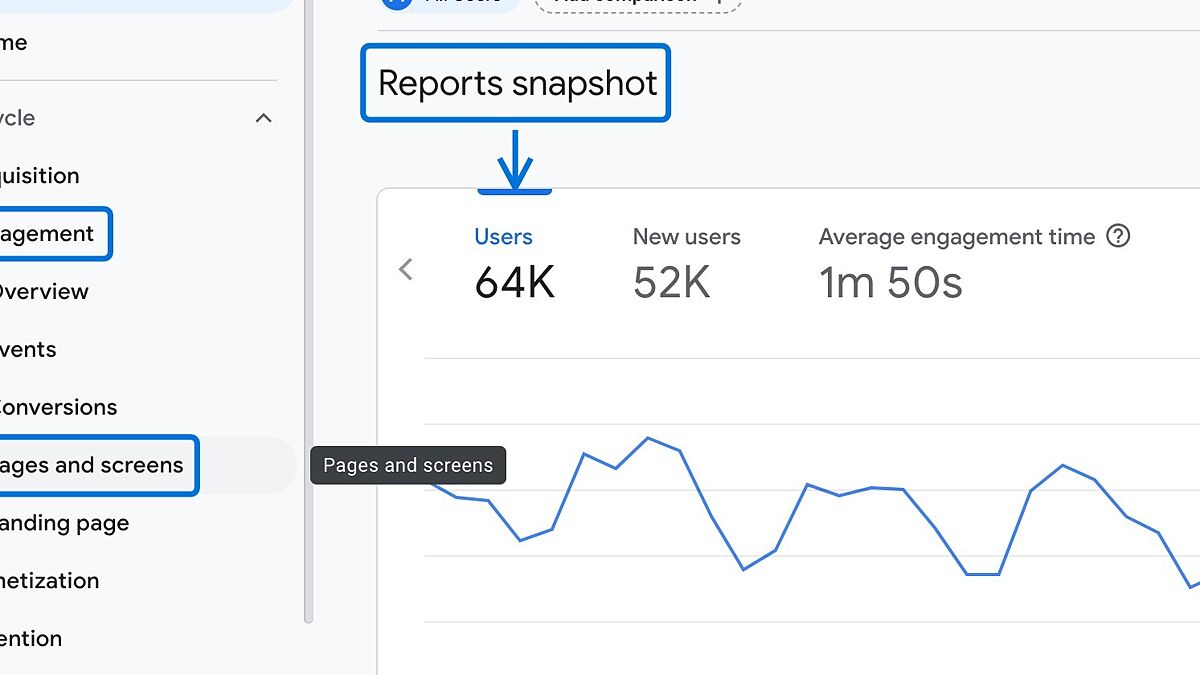
It's easy! Here's how: Go to Reports > Engagement and click on the Pages and screens tab to access this report snapshot.
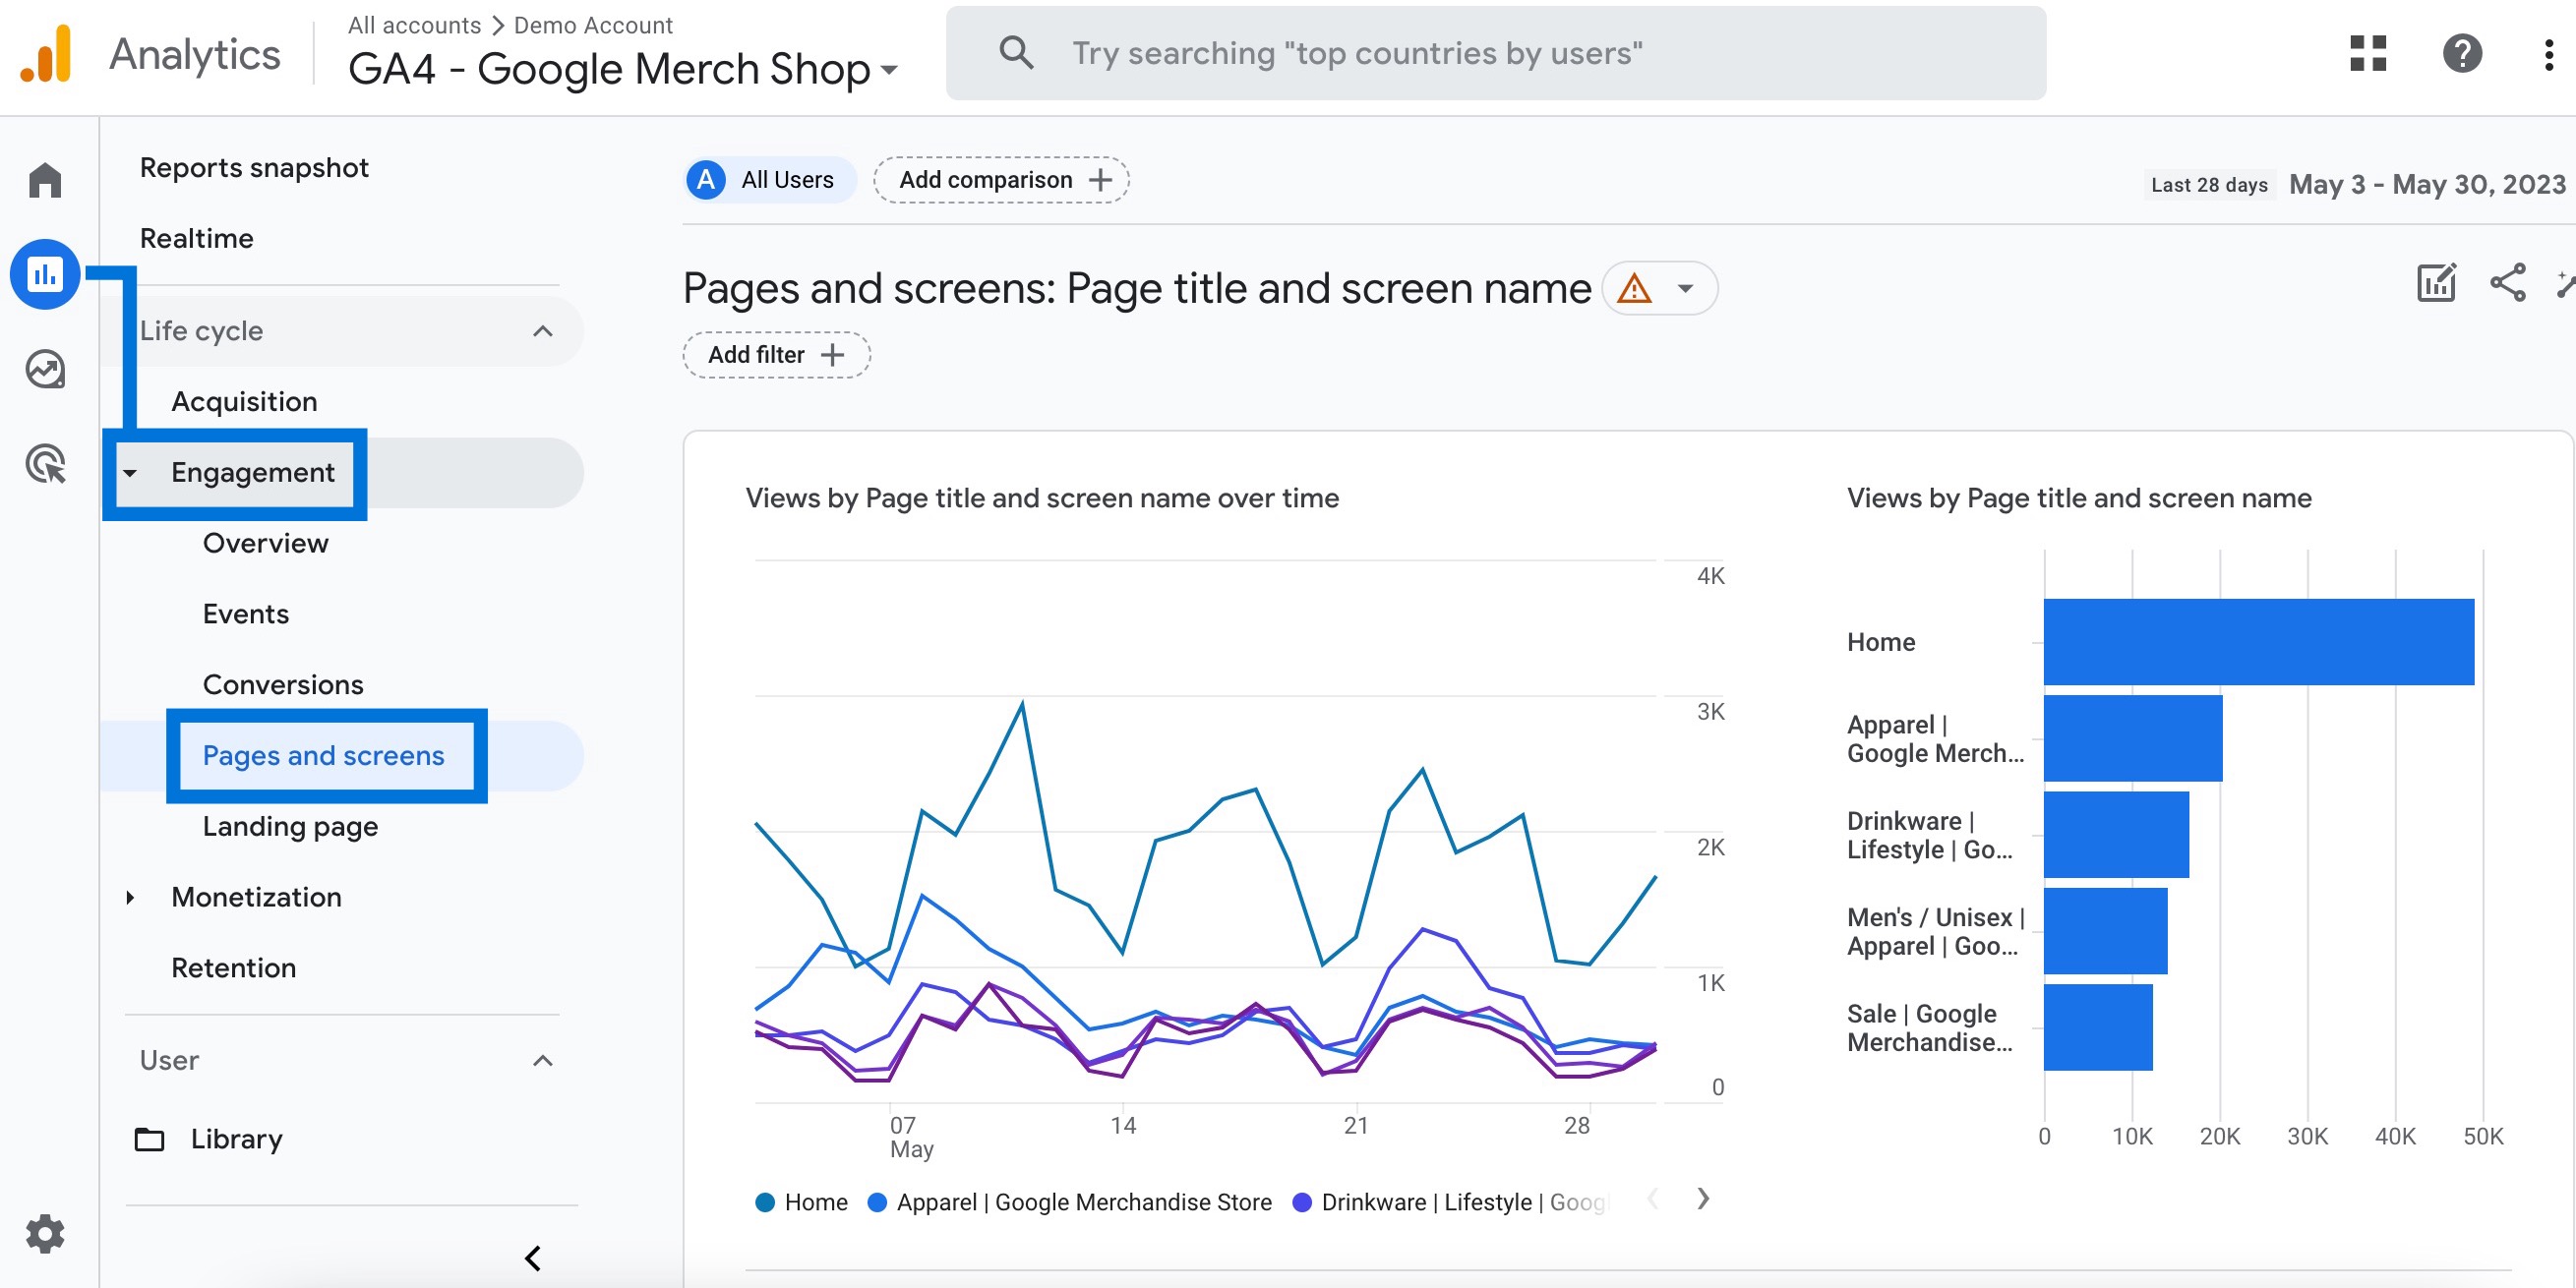
When you initially access the report, you will find your data presented in a breakdown based on the page path and screen class.
This allows you to analyze the pages on your website and screens on your app that people visit and engage with over a specified time period, which you can select in the top-right corner.
First, the report will be shown in the default view, but you have the flexibility to customize it by applying filters or comparisons , as well as by modifying the dimensions, metrics, or charts.
The bar chart on the right displays the most popular pages among all users, while the line chart on the left gives more detail on any given day.
If you prefer a tabular representation, you can refer to the table below instead of the charts. Both of these graphs are interactive, simply hover your mouse over them.
If you wish to focus on data for a specific page or screen, you can apply a filter to the report or utilize the search bar located above the report table.
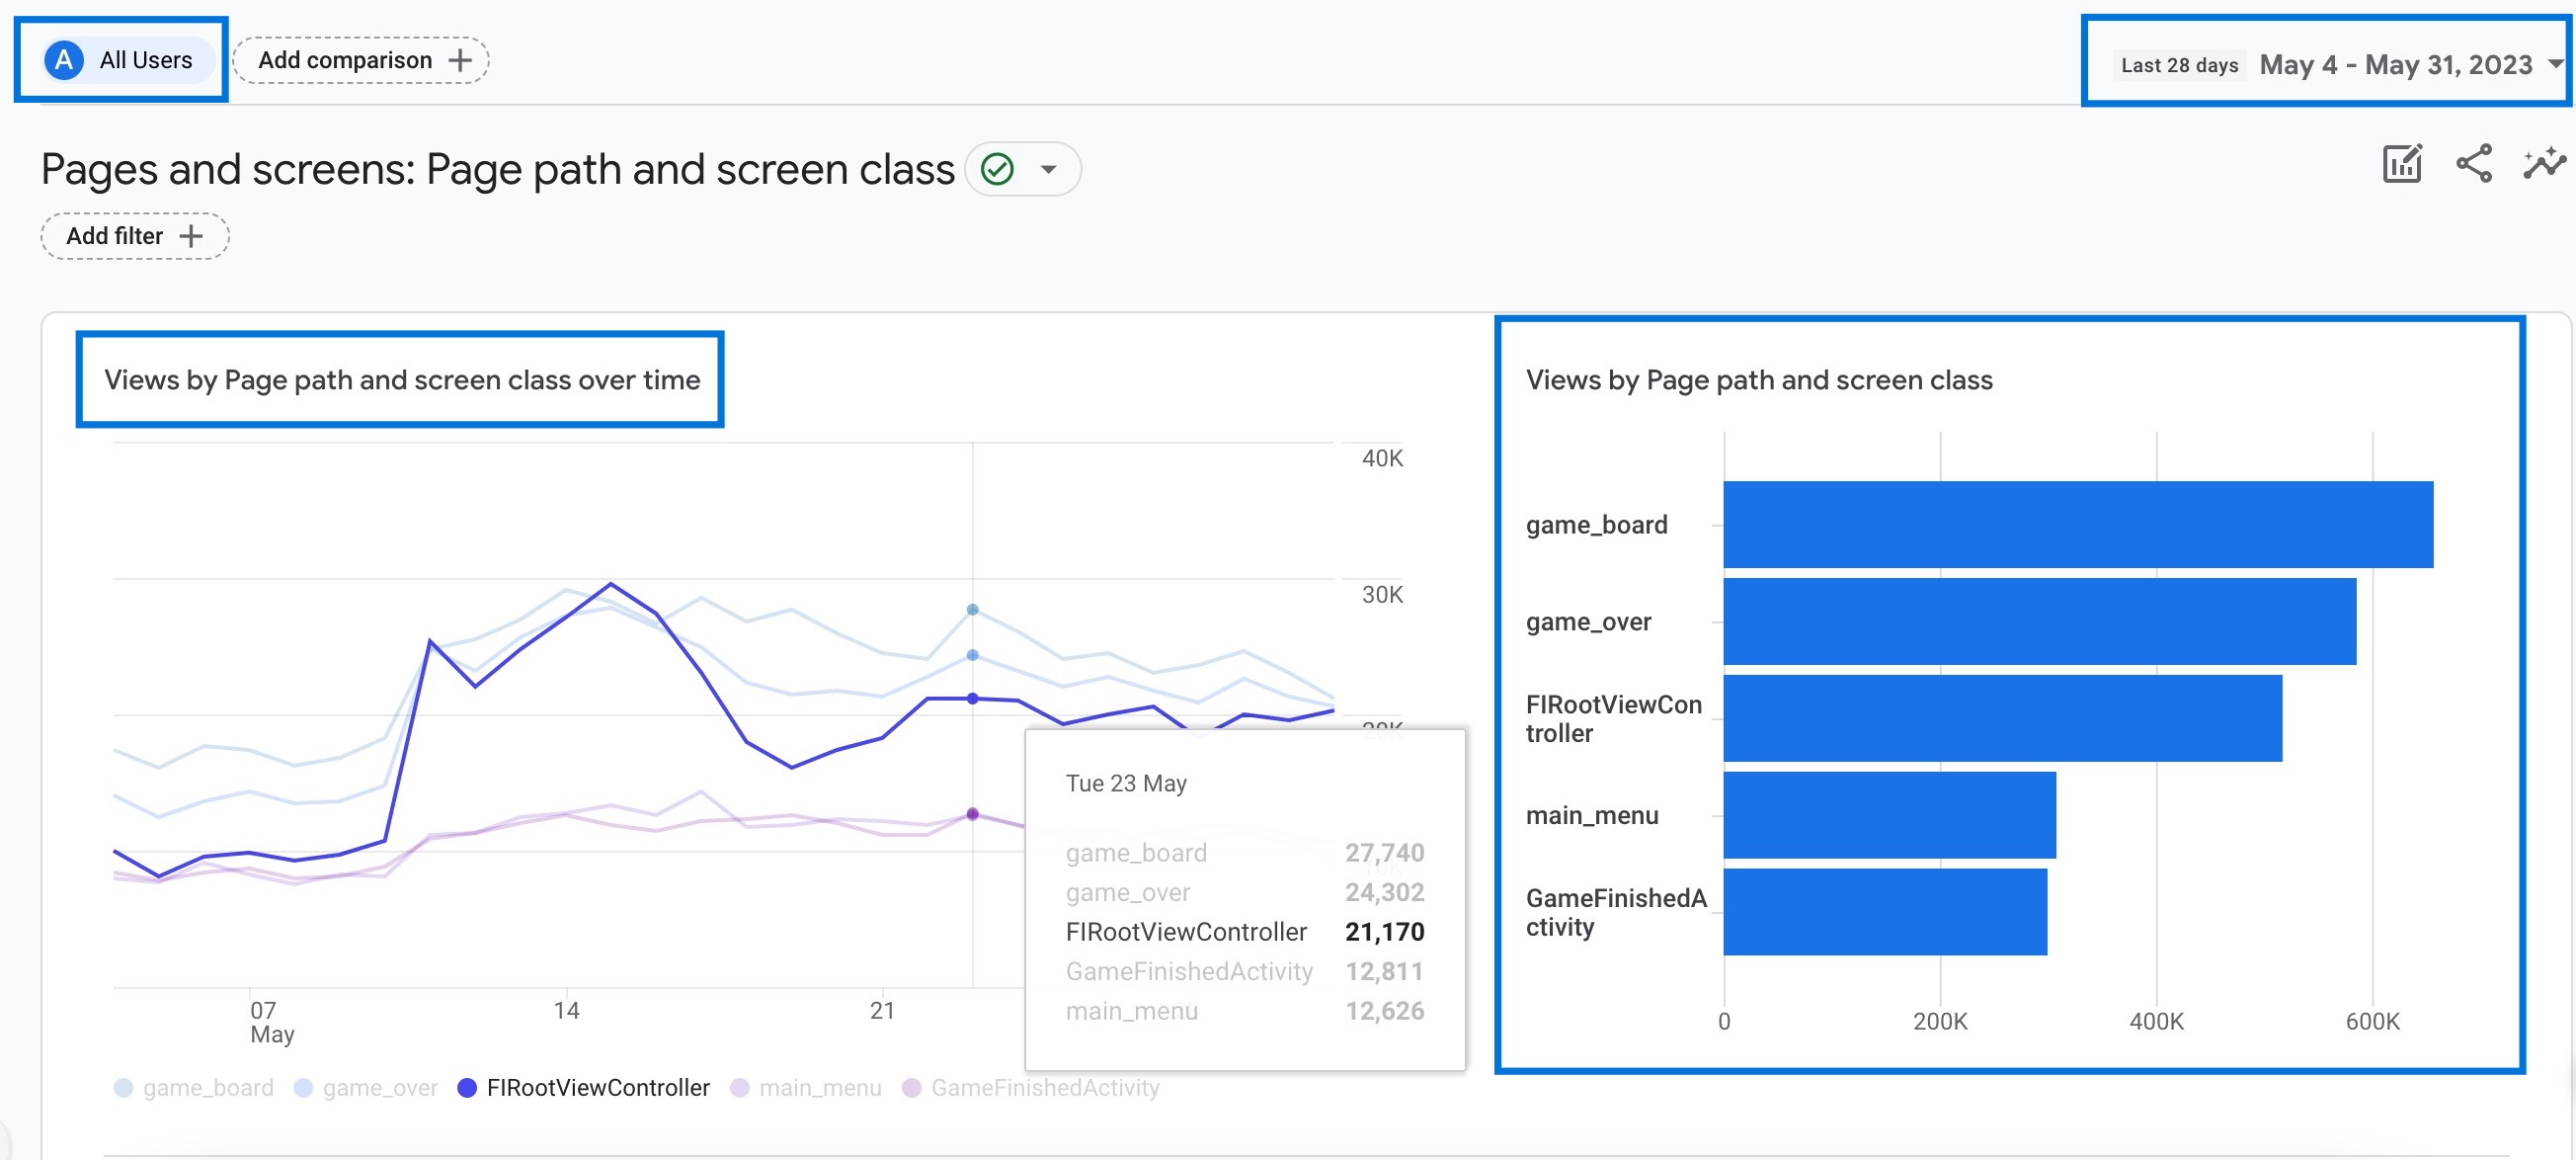
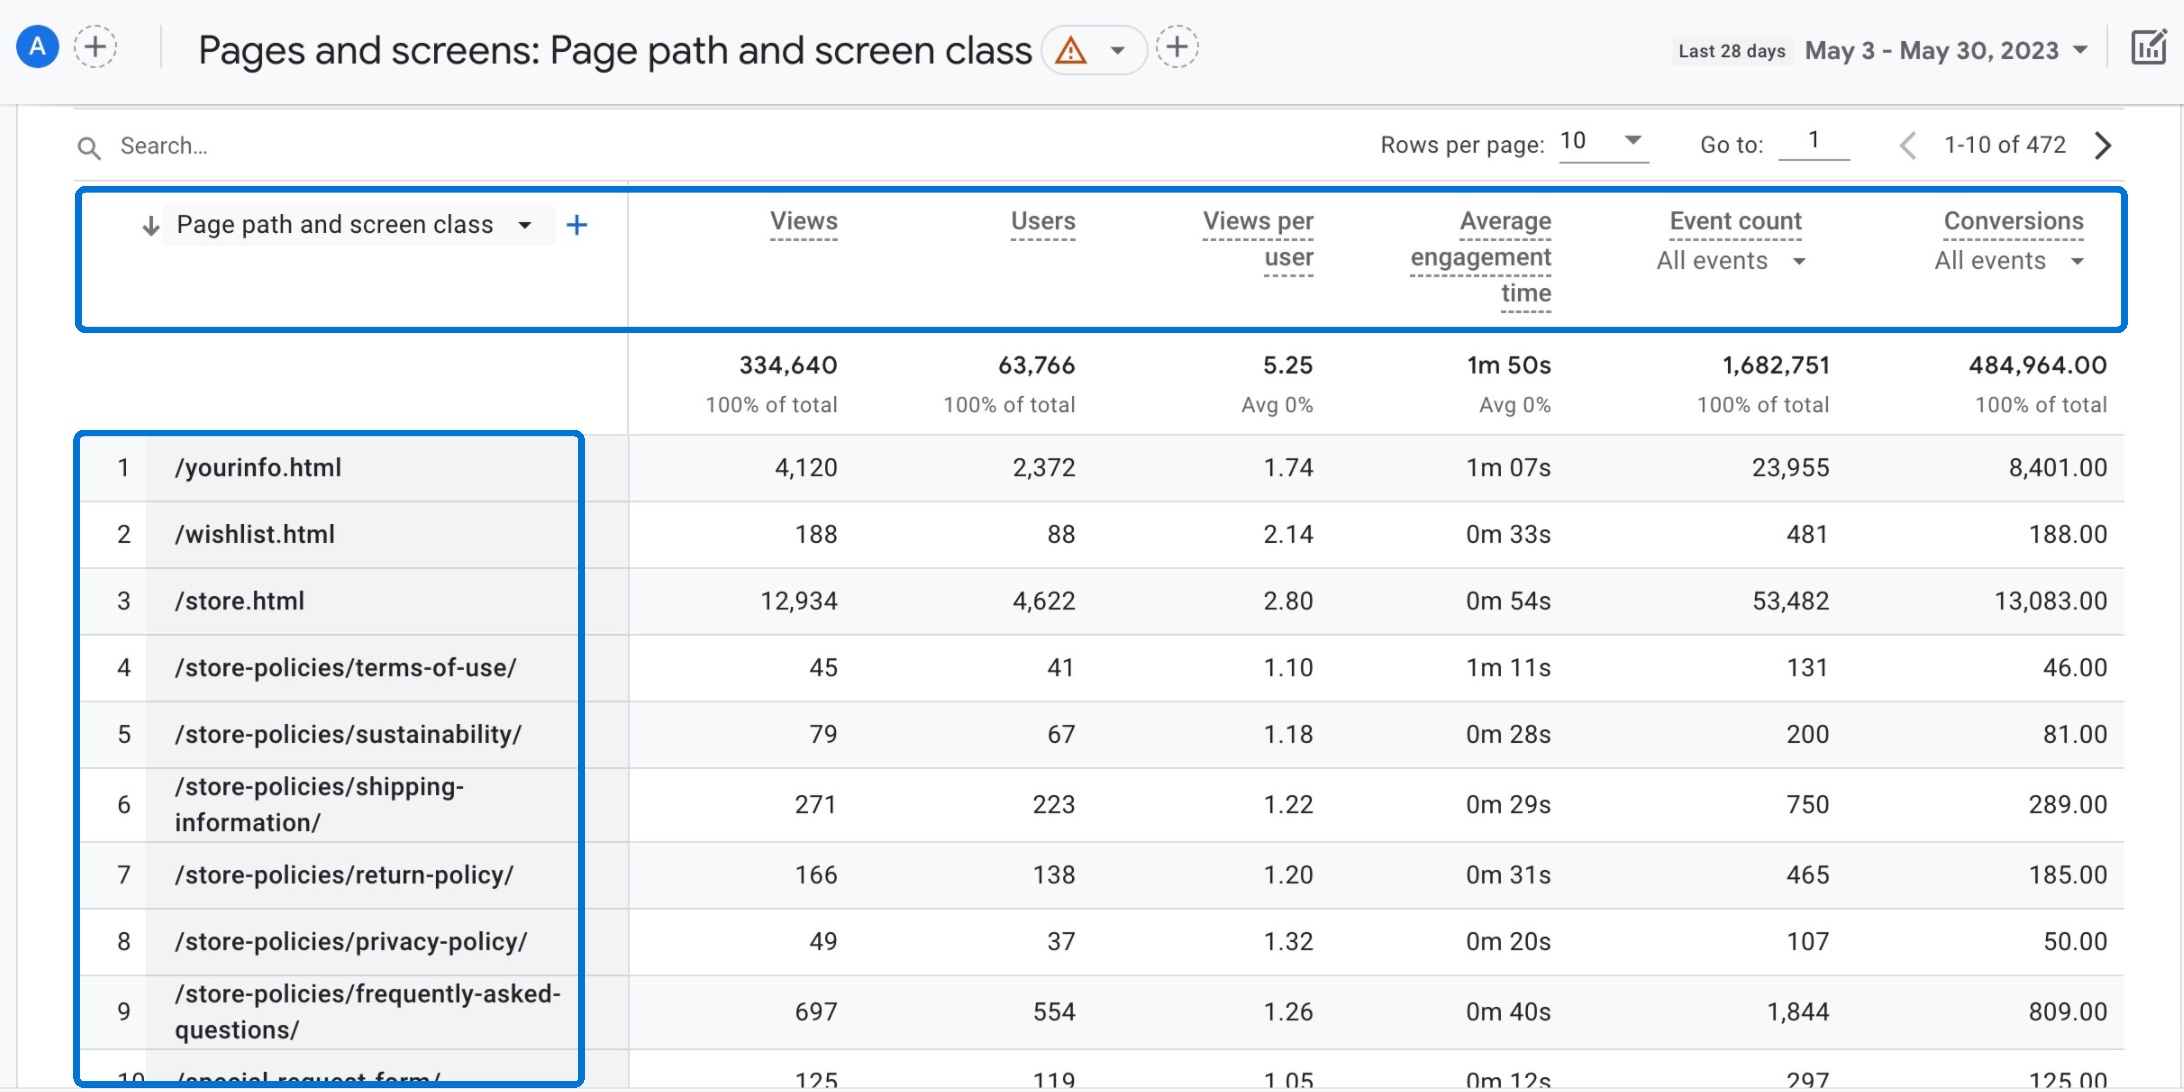
When you scroll down, a detailed overview will provide you with various data points such as views, new users , average engagement time, event count, conversions, and more for each specific page or screen.
Key Dimensions and Metrics in Google Analytics 4 (GA4)
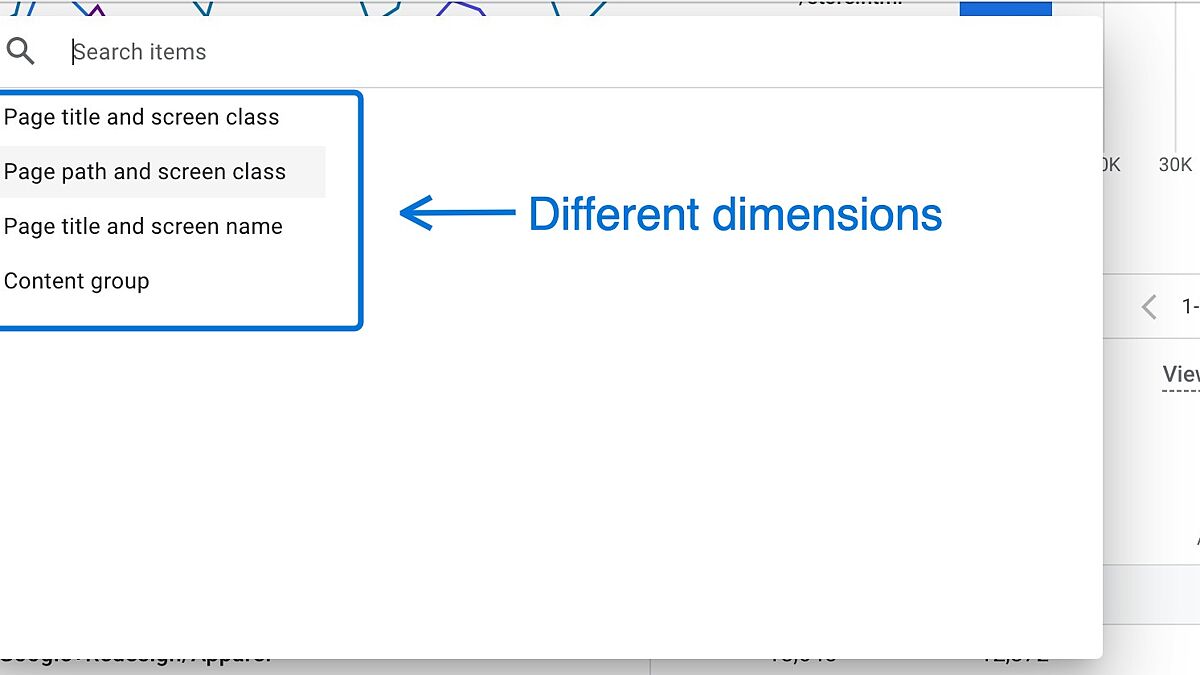
There are dimensions that you can choose for your report: Page title and screen class, Page path and screen class, Page title and screen name, and Content group.
Most popular and important metrics are listed below:
- Page path is represents the page URL or path within a website . It can be used to group page views by their location on the website.
- Screen class is a dimension that represents the type of screen within a mobile app . It can be used to group screens by their functionality or purpose.
- Page title and screen name are the page title from a website and screen name from a mobile app.
- Conversions are the number of times users triggered a conversion event. You should populate this metric by marking an event as a conversion .
- Event count is the number of times users triggered an event.
If you're only tracking a website, you can ignore the screen class as it's just a naming convention. Instead, focus on the page path, which is the URL.
However, keep in mind that the page title might not be very useful since many companies don't customize it consistently. Please check this article to learn more.
How to View Specific Pages and URLs in GA4?
Follow along to discover how you can access to specific pages and URLs in pages and screens report:
Log in to your Google Analytics account and go to Reports in the left side menu.
Navigate to "Pages and screens" under Engagement.
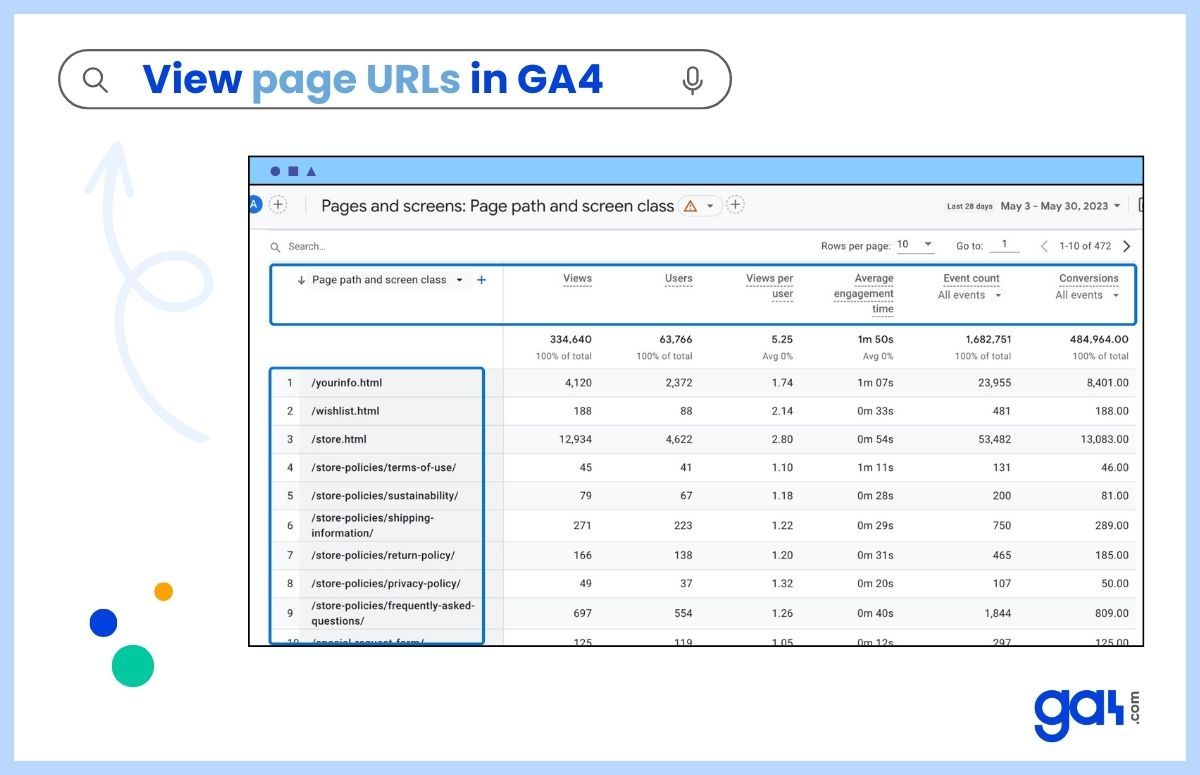
By clicking on this in the first column, you can choose a dimension among 4 options.
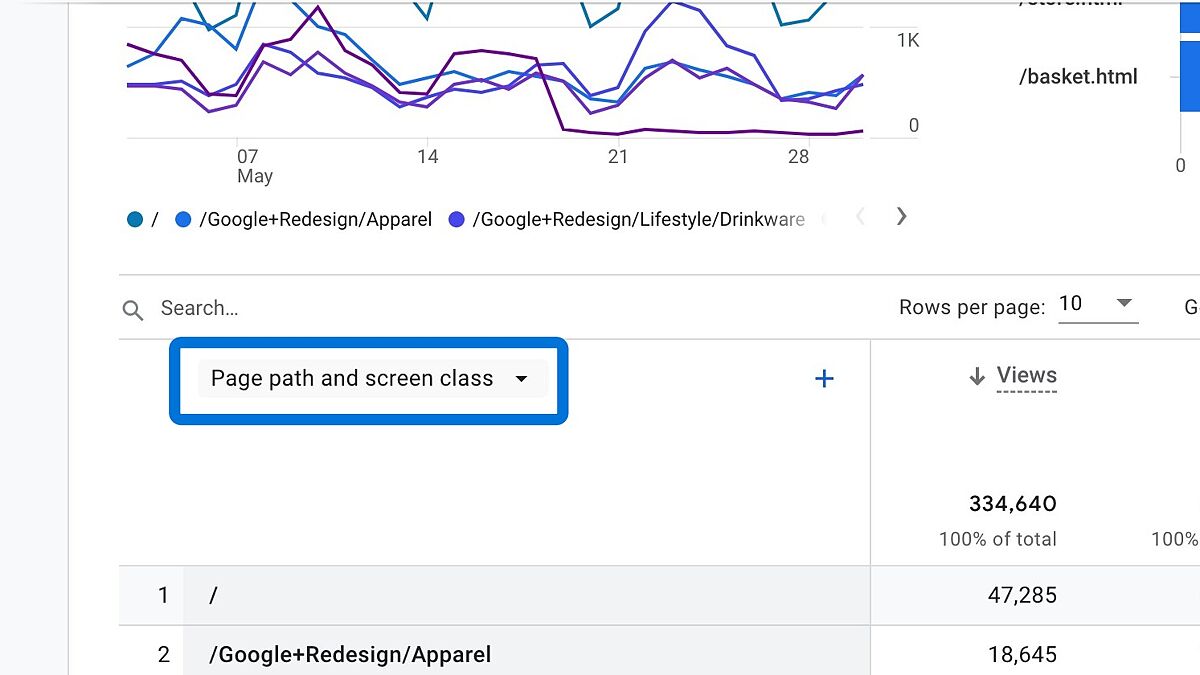
To be able to view URLs of pages, you should choose "Page path and screen class" as a dimension.
You can see several metrics based on specific URLs here. Also, you can use the search button to filter words that are contained in a URL.
How to Customize Pages and Screens Report in GA4?
The Pages and Screens Report is also highly customizable. You can customize your report to focus on specific pages or screens, or to include or exclude certain data.
One way to personalize your report is by using comparisons .
Example :
Let's say you want to see the pages that are most popular among your female visitors in the United States.
Notice that we have two dimensions here: gender and country .
We will add these two dimensions to the same comparison because we want them to be considered together as a condition. To proceed, follow the steps:
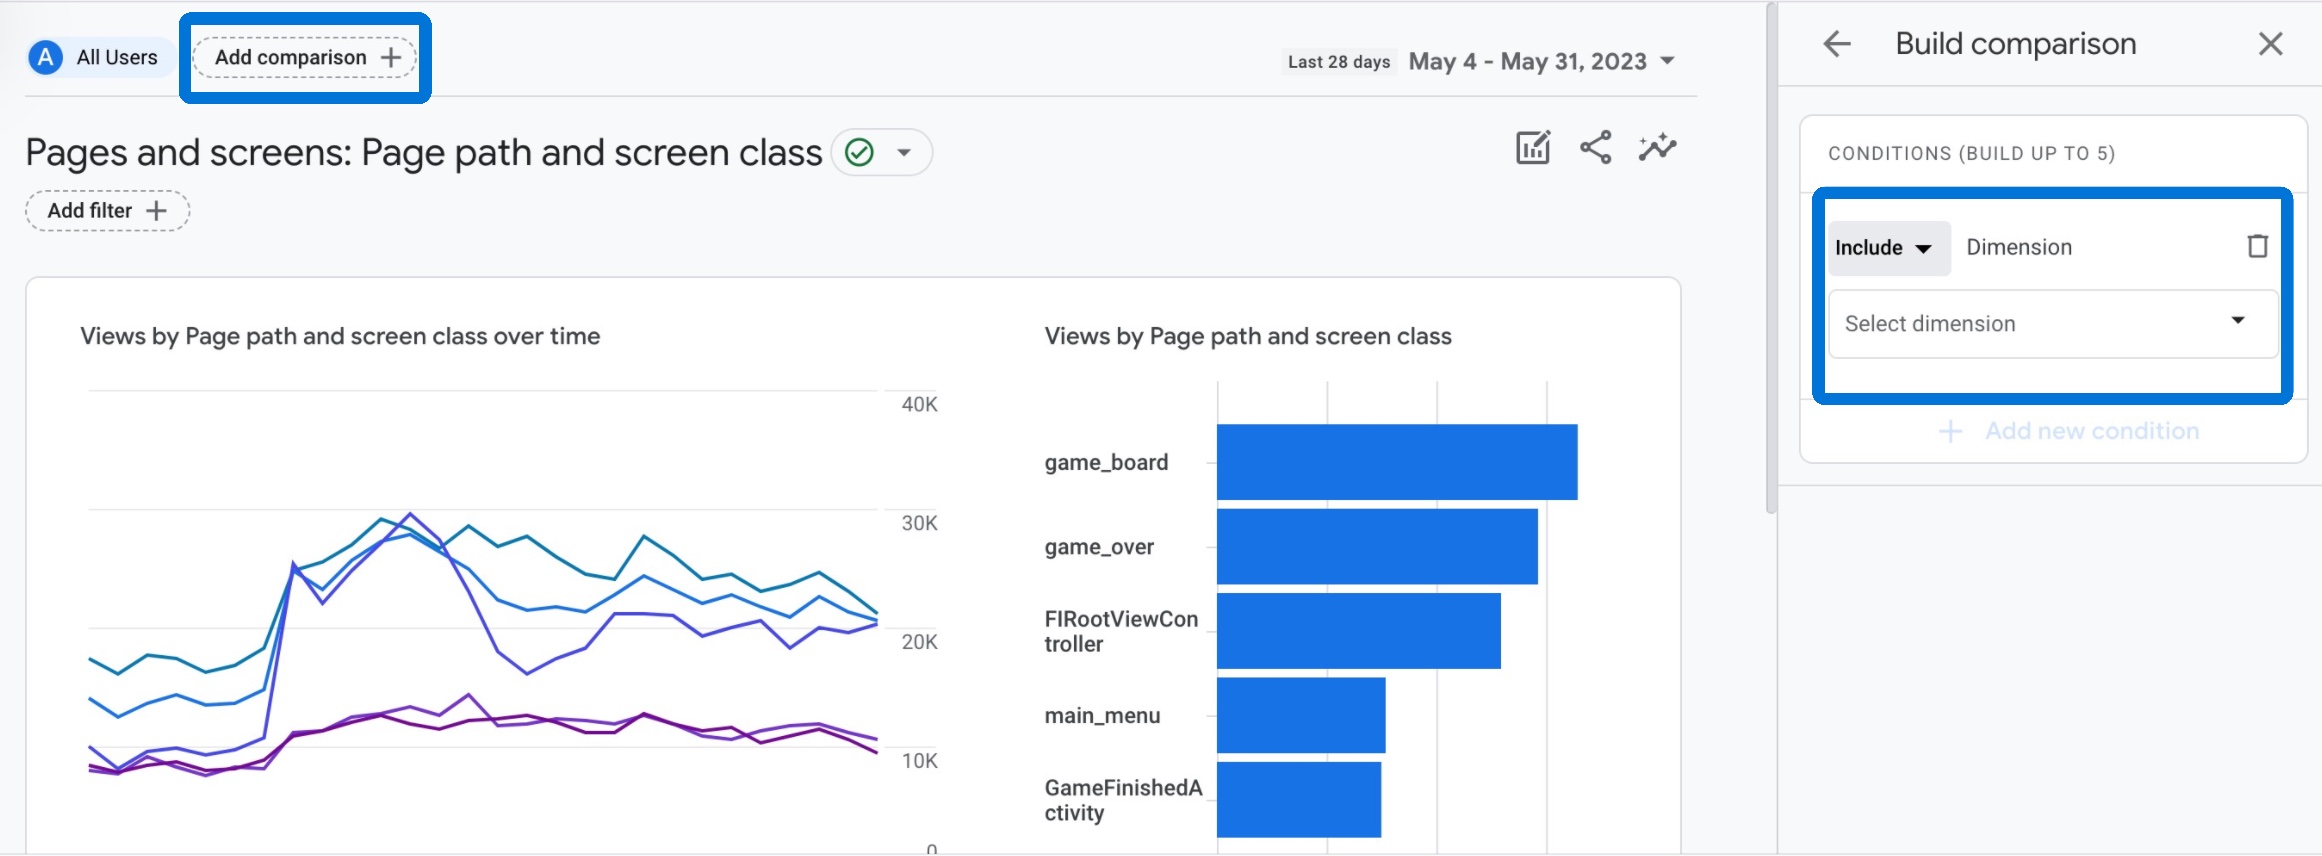
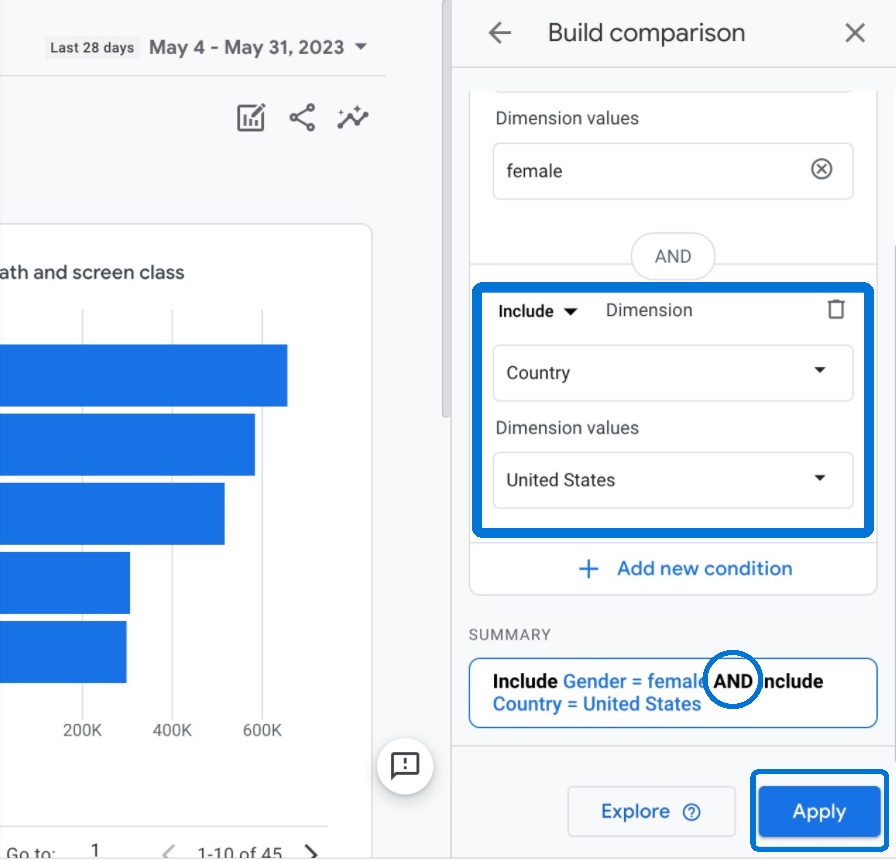
Click on "Add comparison". Then select first dimension and leave the comparison as "include."
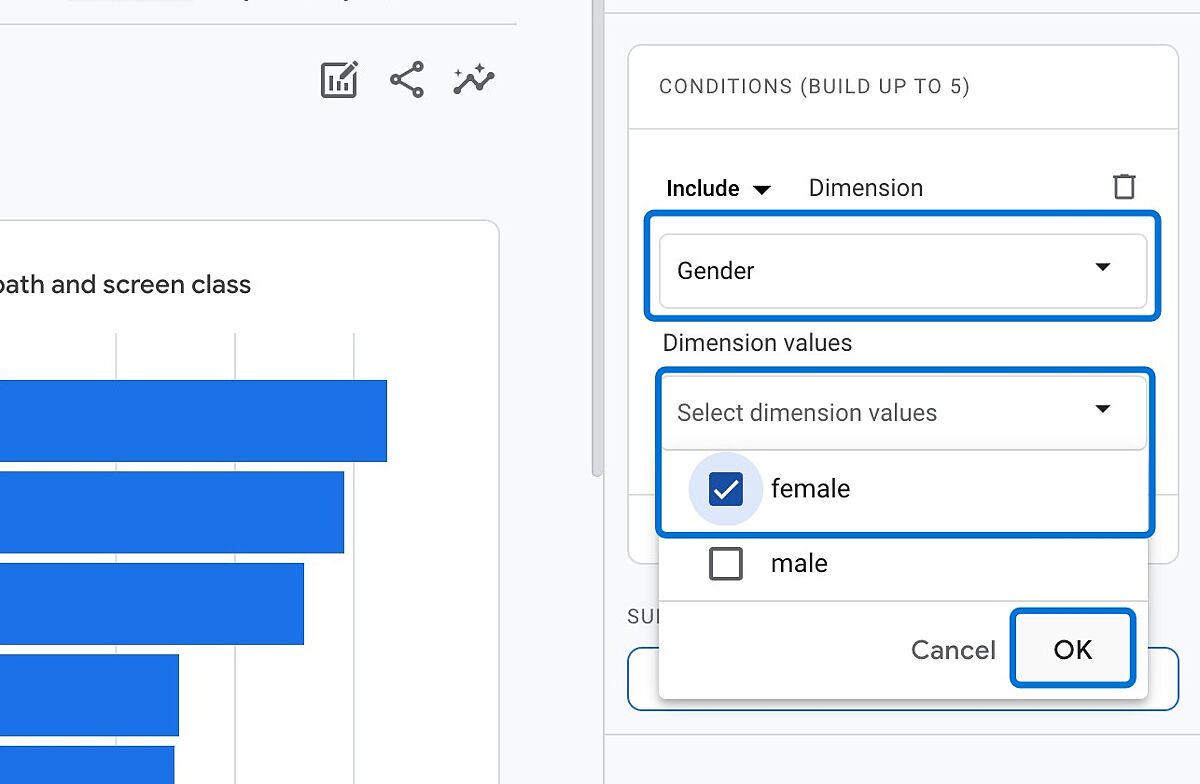
From the drop-down menu, select the "gender" dimension and choose "female" and click OK.
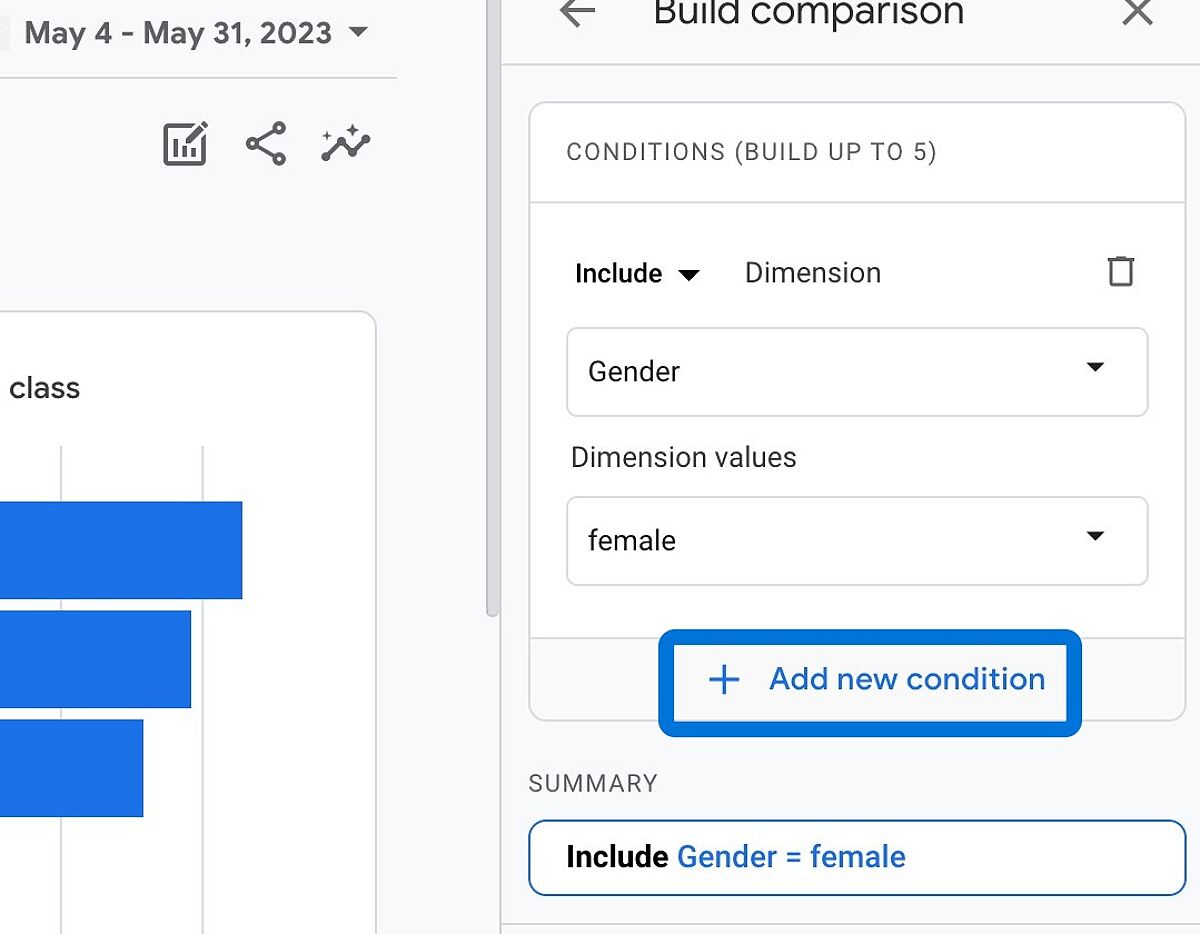
Click on "Add new condition" to add the second dimension.
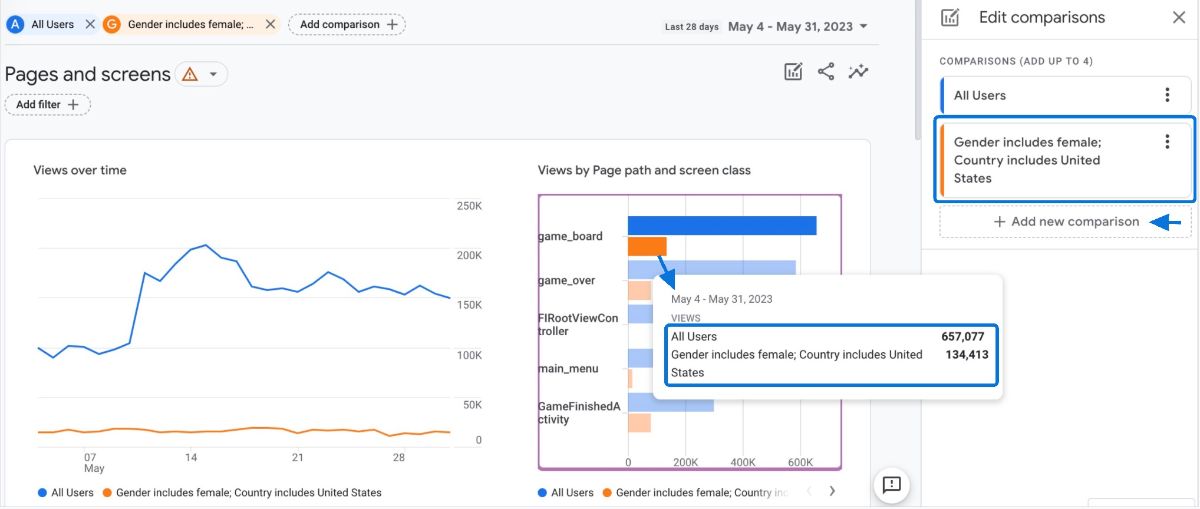
Select the "country" dimension and choose "United States." Finally, click "Apply" to see the comparison integrated into your report. Notice that our dimensions are combined.
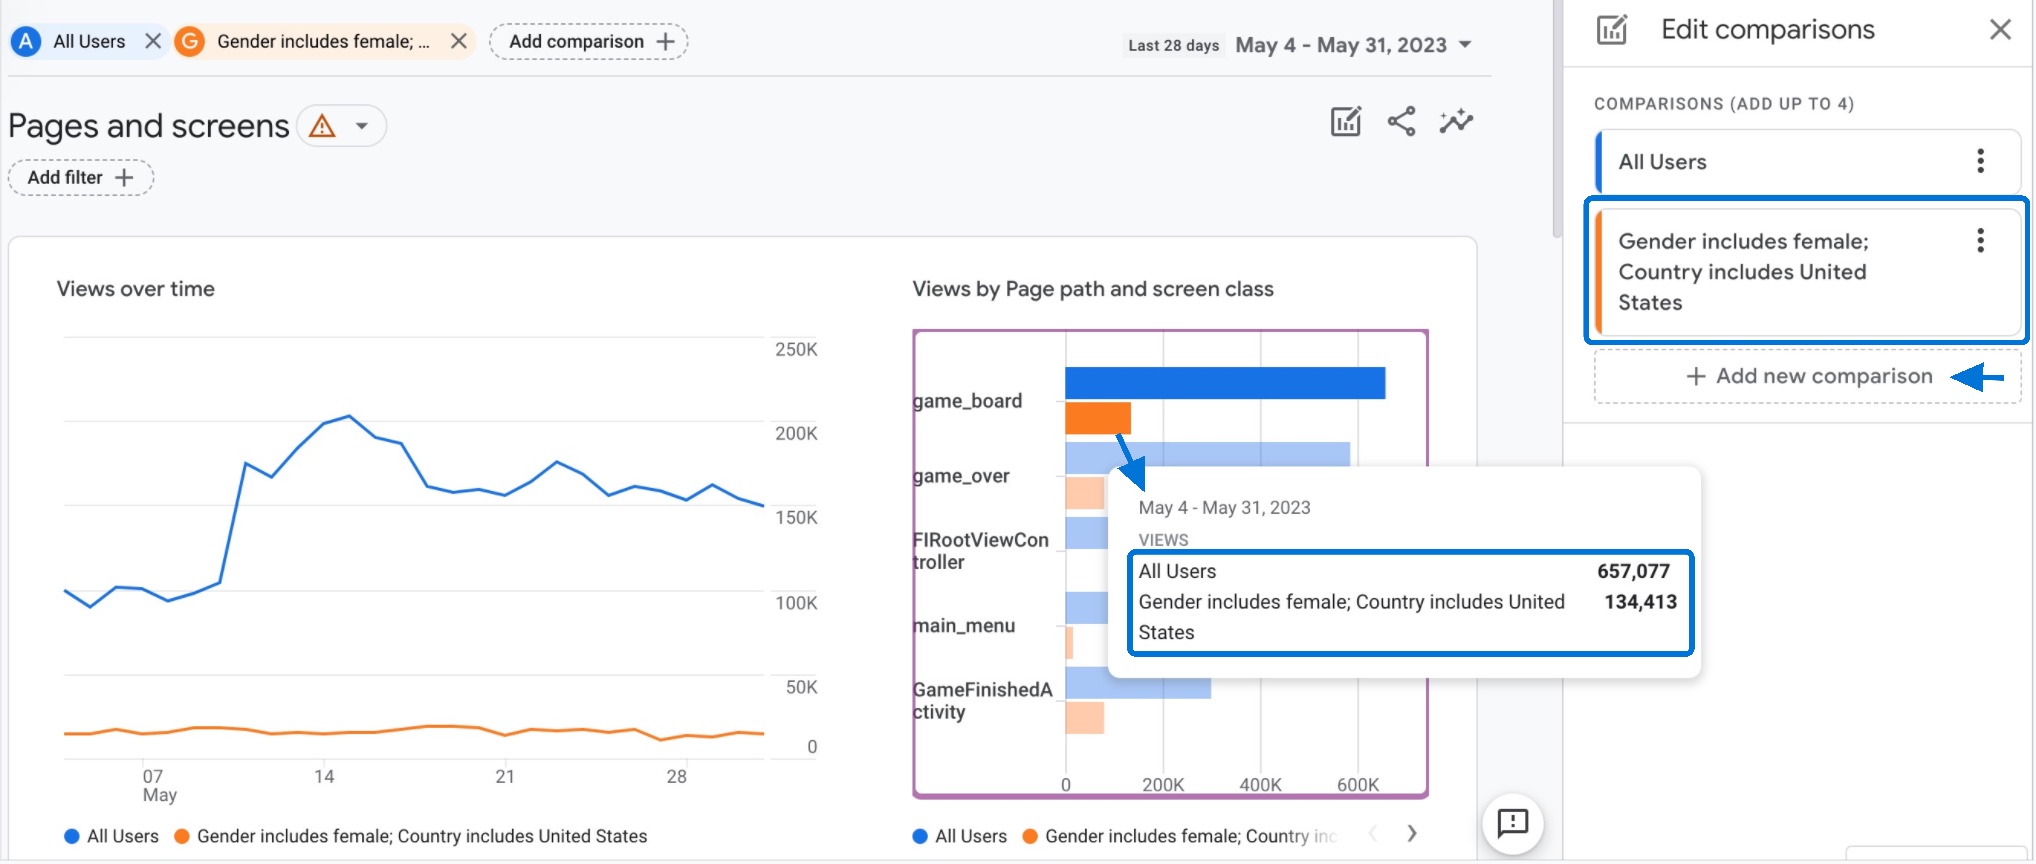
You can view the data on the combined criteria of gender and country on the graphs. By including both the "gender" and "country" dimensions in the same comparison, you will obtain insights specifically tailored to the pages or screens that are most popular with female visitors from the United States. You have the option to add other comparisons separately or combine them, as shown in this example.
You can further customize the report by incorporating an additional category into the table. To do this, scroll down to the table and click on the "+" sign under the search bar.
By doing so, you can include another dimension in the table, such as operating system, device category, age, and more.
This allows you to expand the level of detail and insights provided in the table.
Here as a representation:
FAQ: Pages and Screens Report in GA4
Here are the frequently asked questions about the pages and screens report in GA4:
Conclusion
In conclusion, the Pages and Screens report in GA4 is an important tool for understanding how users interact with your website and app.
By using its customizable features, you can gain deeper insights into user behavior, optimize your content, and enhance overall engagement.
