PPC stands for pay-per-click , which is a type of online advertising where you pay a fee each time one of your ads is clicked.
It can be an effective way for you to reach your target audience and drive traffic to your website, but it's important to carefully manage and optimize a PPC campaign to ensure that it's successful.
Here is a list of important Google Analytics 4 reports primarily focused on measuring and optimizing PPC performance:
1. Location Report in Google Analytics 4 (GA4)
Location reports help you understand how your website traffic is performing in different locations.
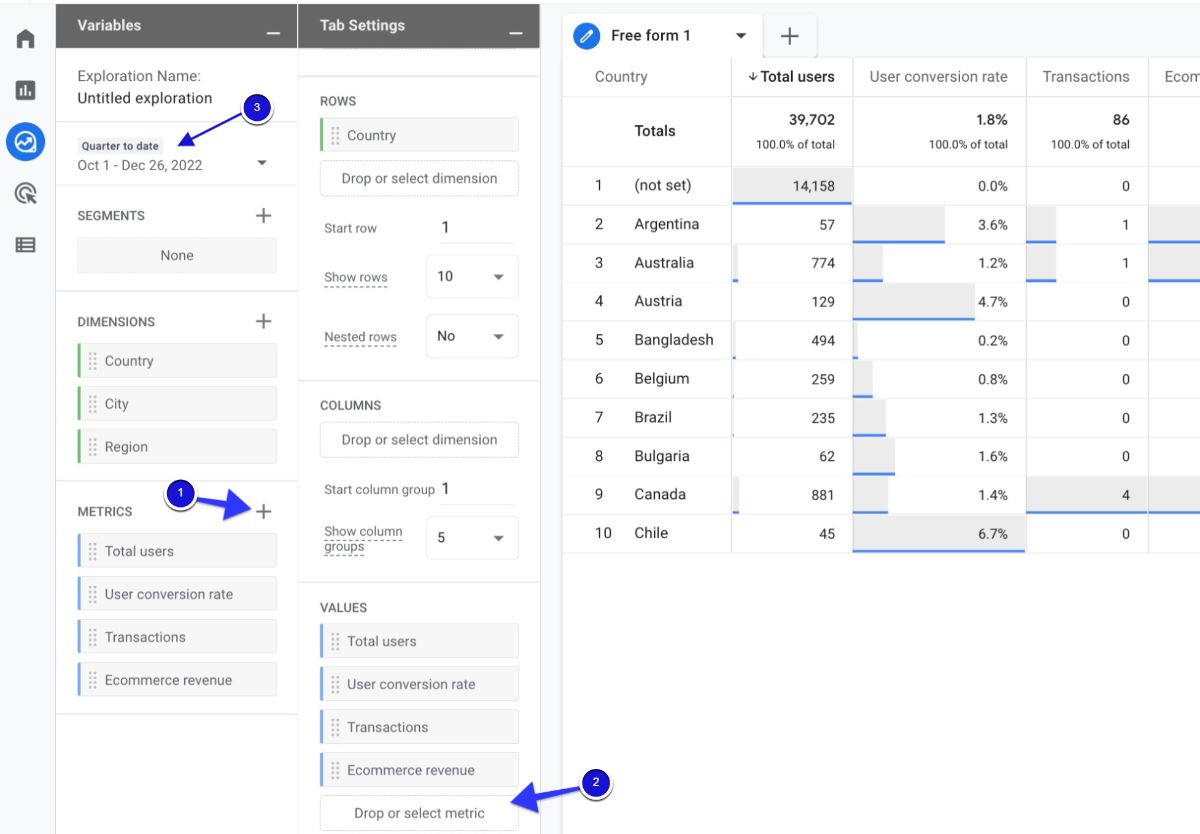
With GA4, you can easily access the location data of all your site traffic at country, region, and city levels.
For these 3 dimensions, you can analyze important data such as the total number of users coming to your site, transaction/conversion rate, and revenue.
Why should you create a Location Report for PPC (Paid Search) in GA4?
Why is it important to compare this data in location reports? Because it will allow you to measure from which position you get the most return on investment (ROI).
With this data, you can adjust your location targeting in your PPC campaigns and optimize your location-based bid adjustments.
Thus, you can accelerate your growth rate by showing your ads to people in regions with high sales potential.
How to create a Location Report in GA4?
Here is a step-by-step guide to creating a location report in Google Analytics 4.
The only thing you need to do is to follow the steps carefully so you can accurately capture and analyze your data, and use the insights to optimize your marketing strategies.
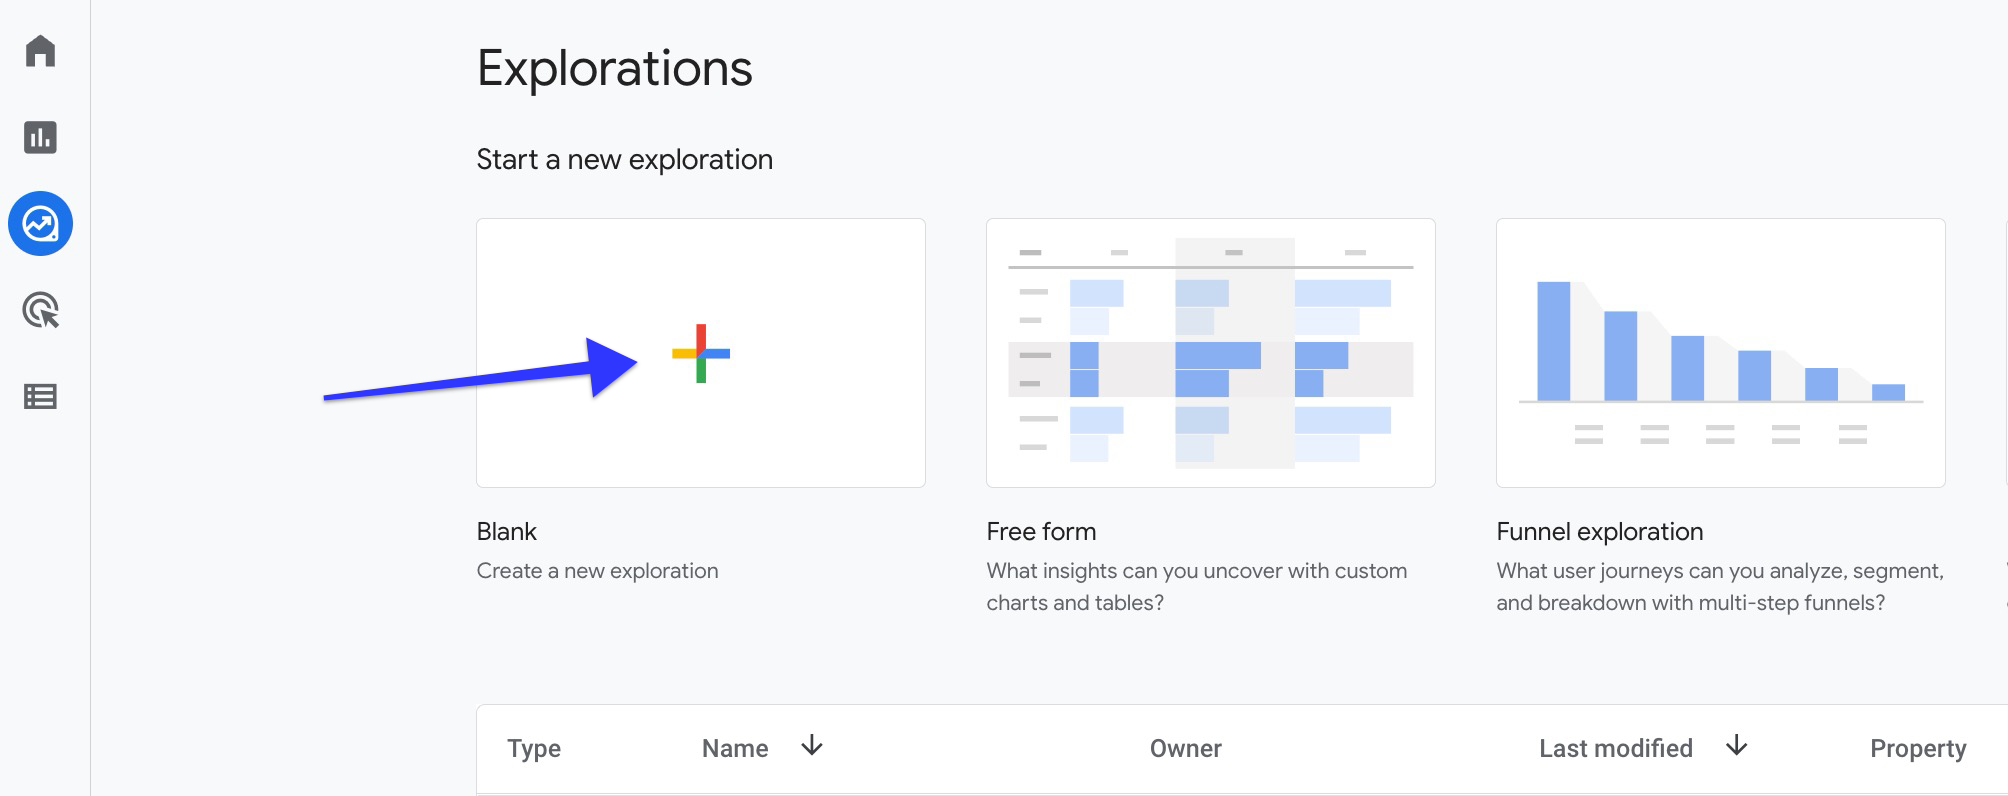
Go to your GA4 account. Then, click on “Explore” in the left-side column and then “Create new exploration”.
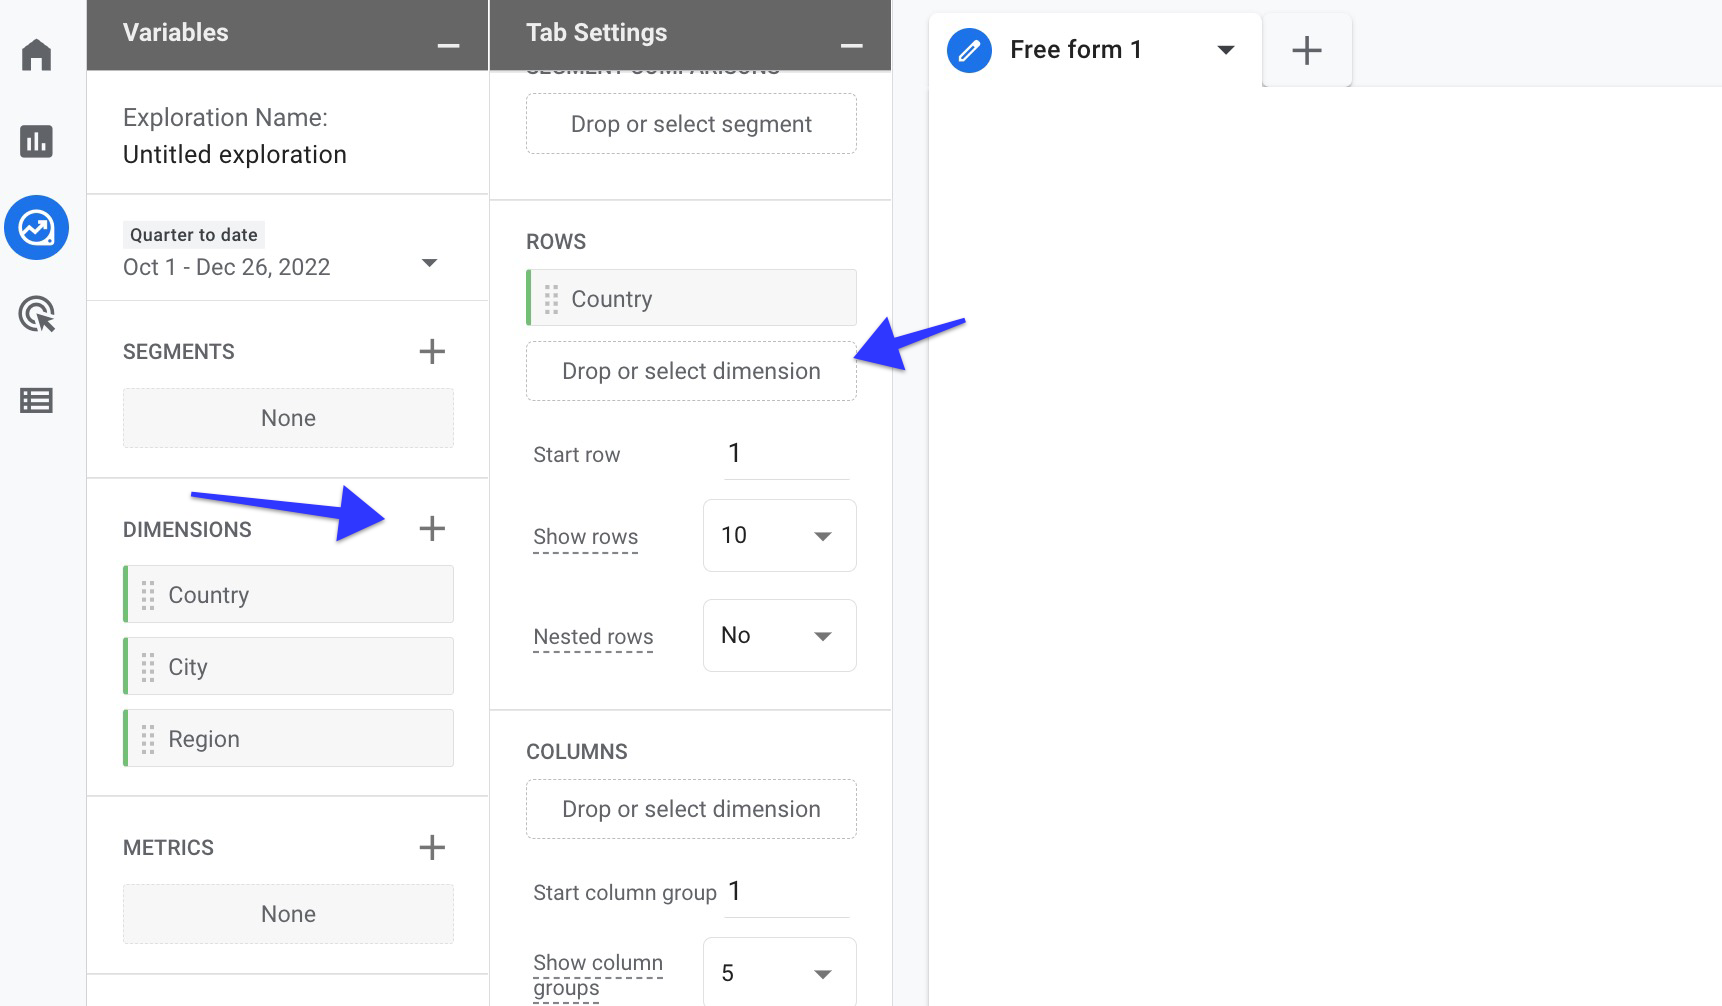
You can choose to add “country”, “region”, and “city” as dimensions to your report. To do this, click on the + button next to “Dimensions” and select the desired dimensions from the list. If you want to use existing dimensions, simply drag and drop the dimension under "rows" in the tab settings.
You can create a metric by clicking o the + button. If you want to use existing metrics, simply drag and drop the metric under "values" in the tab settings. After creating your report, you can start making your comparisons by selecting the date range you want.
We have a few metric suggestions that will be useful for your location data comparison. You can use the total users metric to compare how many users interact with your site from which location. Comparing purchases and revenue will provide important data for measuring the location-based return on investment.
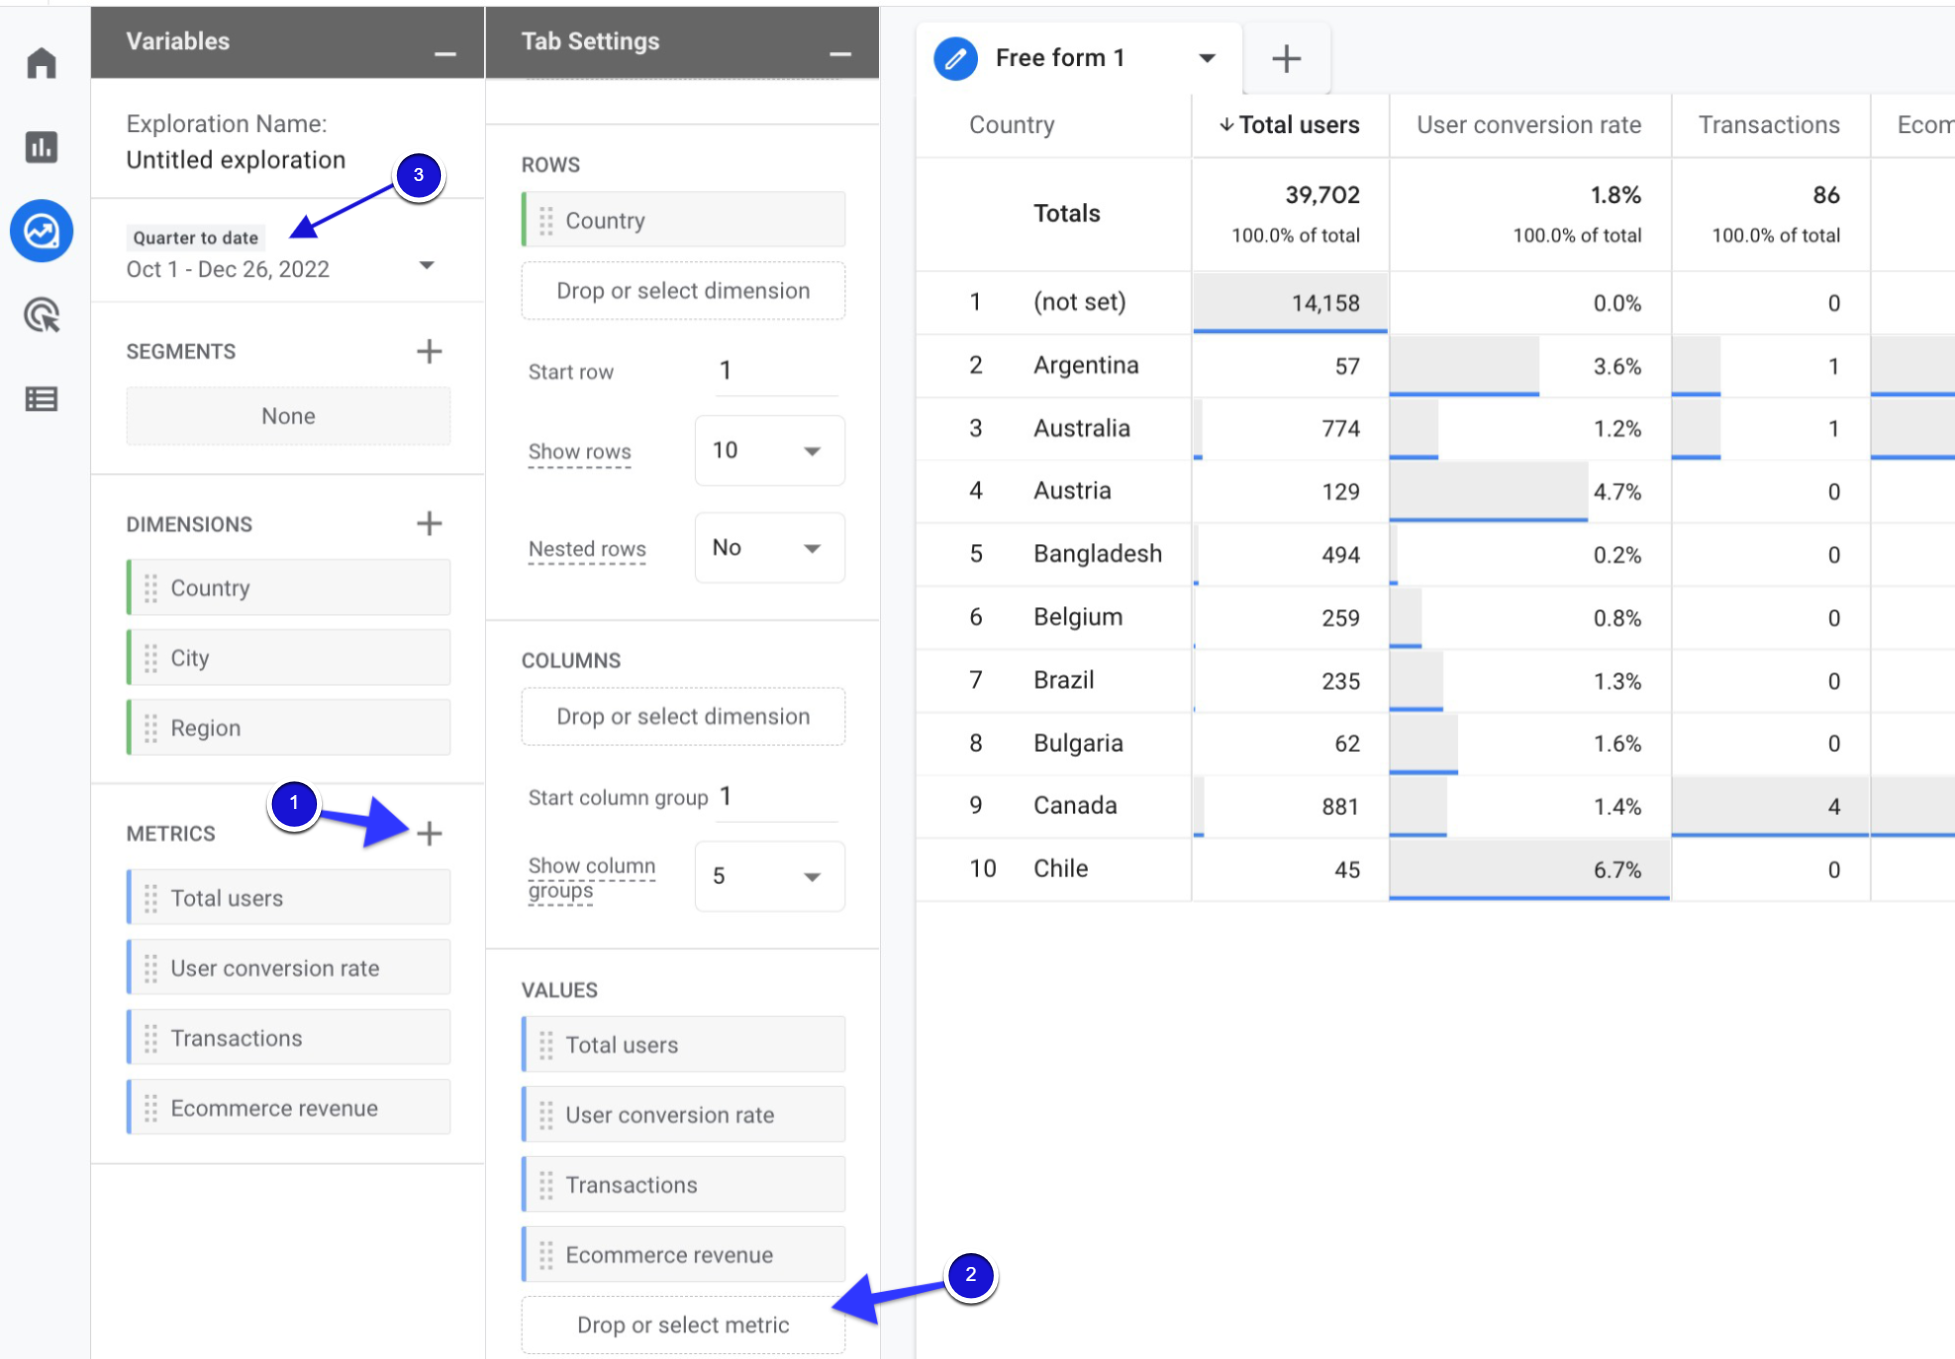
Note: You can also double-click on the Dimension or Metrics name to add it to the Rows or Values section.
This will automatically add the selected item to your report, allowing you to quickly build and customize your report.
To delete a dimension or metric from your report, you can click the X button next to it. This will allow you to focus on the data that is most relevant to you.
Action Advice:
Here are the tricks on how to use the data in your report to optimize your PPC campaigns:
Have you noticed locations in your report that you didn't target in your ad campaigns but with a high conversion rate? We strongly recommend that you add them to your targeting list and test their performance.
Or vice versa, if you have high user flow but the lowest conversion revenue, you can lower your bids in your PPC campaigns for these positions or exclude them completely.
2. Hourly Report in Google Analytics 4 (GA4)
GA4 offers a great opportunity to analyze a lot of data while monitoring your site traffic.
One of them is the data of the interactions made at times of the day.
You can easily get reports in GA4 for hourly comparison, which provides you with data each hour of the day.
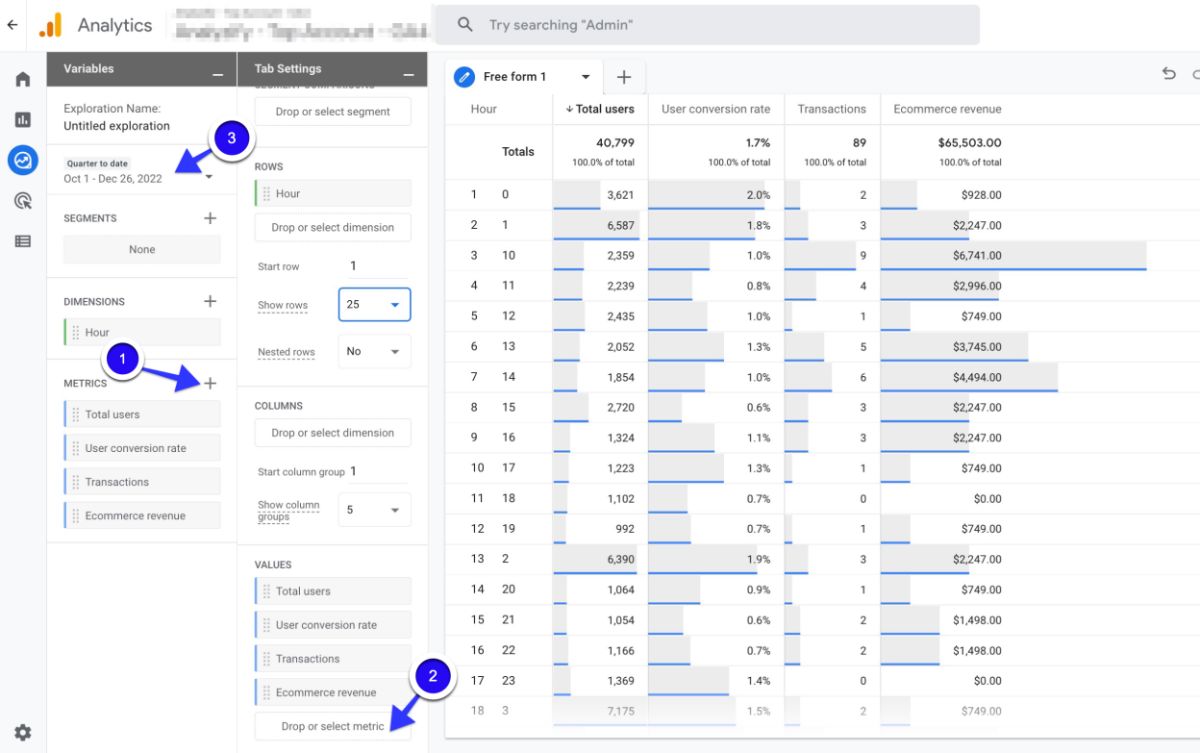
Why should you create Hourly Report for PPC in Google Analytics 4 (GA4)?
By understanding the actions of the users, you can display your ads when their purchasing potential is high.
This way, you can increase your return on investment by targeting the right person at the right time.
How to create Hourly Report in Google Analytics 4 (GA4)?
Creating this report takes much less effort than you might expect. You can follow the steps below to get the basics of creating an hour report in GA4 with easy-to-apply instructions.
Go to your GA4 account, and then click on “Explore” in the left-side column to “Create new exploration”.

At the top of the page, click the "+" icon. Under "Time," select "Hour" as the dimension. If you want to use the existing dimension, simply drag and drop the dimension under "rows" in the tab settings.
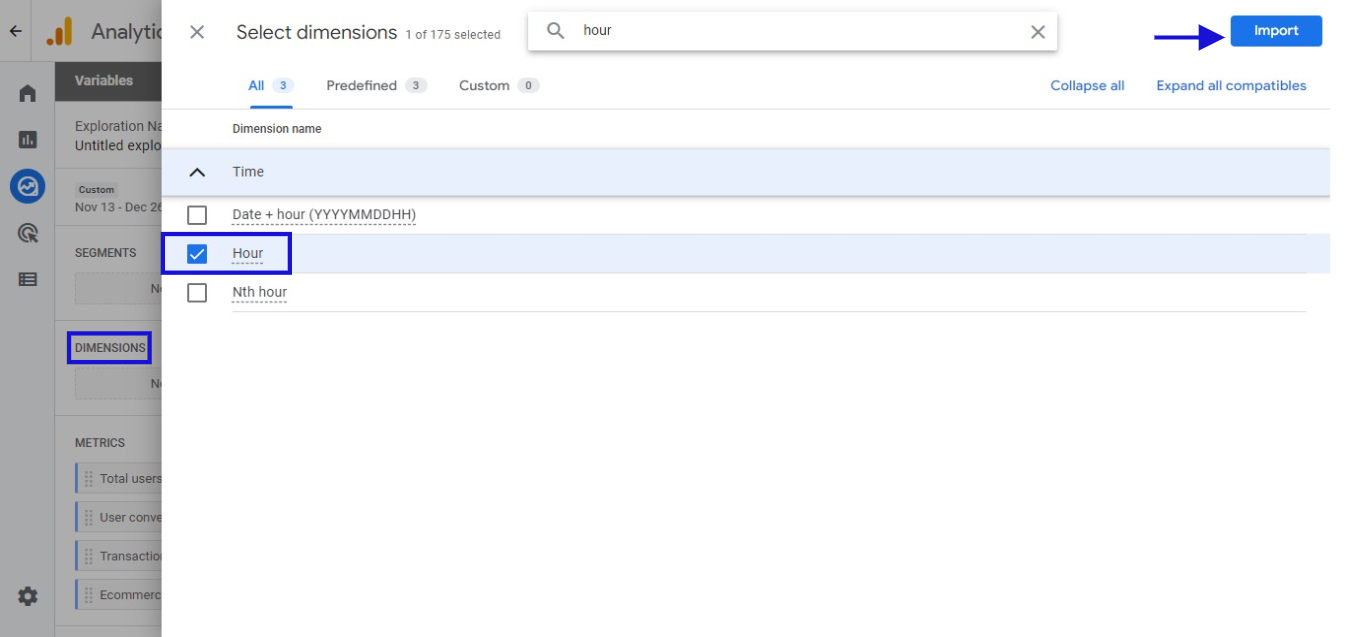
Select the metrics you want to compare and add them to your report. If you want to use existing metrics, simply drag and drop the metric under "values" in the tab settings. For example total users, conversion rate, transactions, or revenue. After creating your report, you can start making your comparisons by selecting the date range you want.
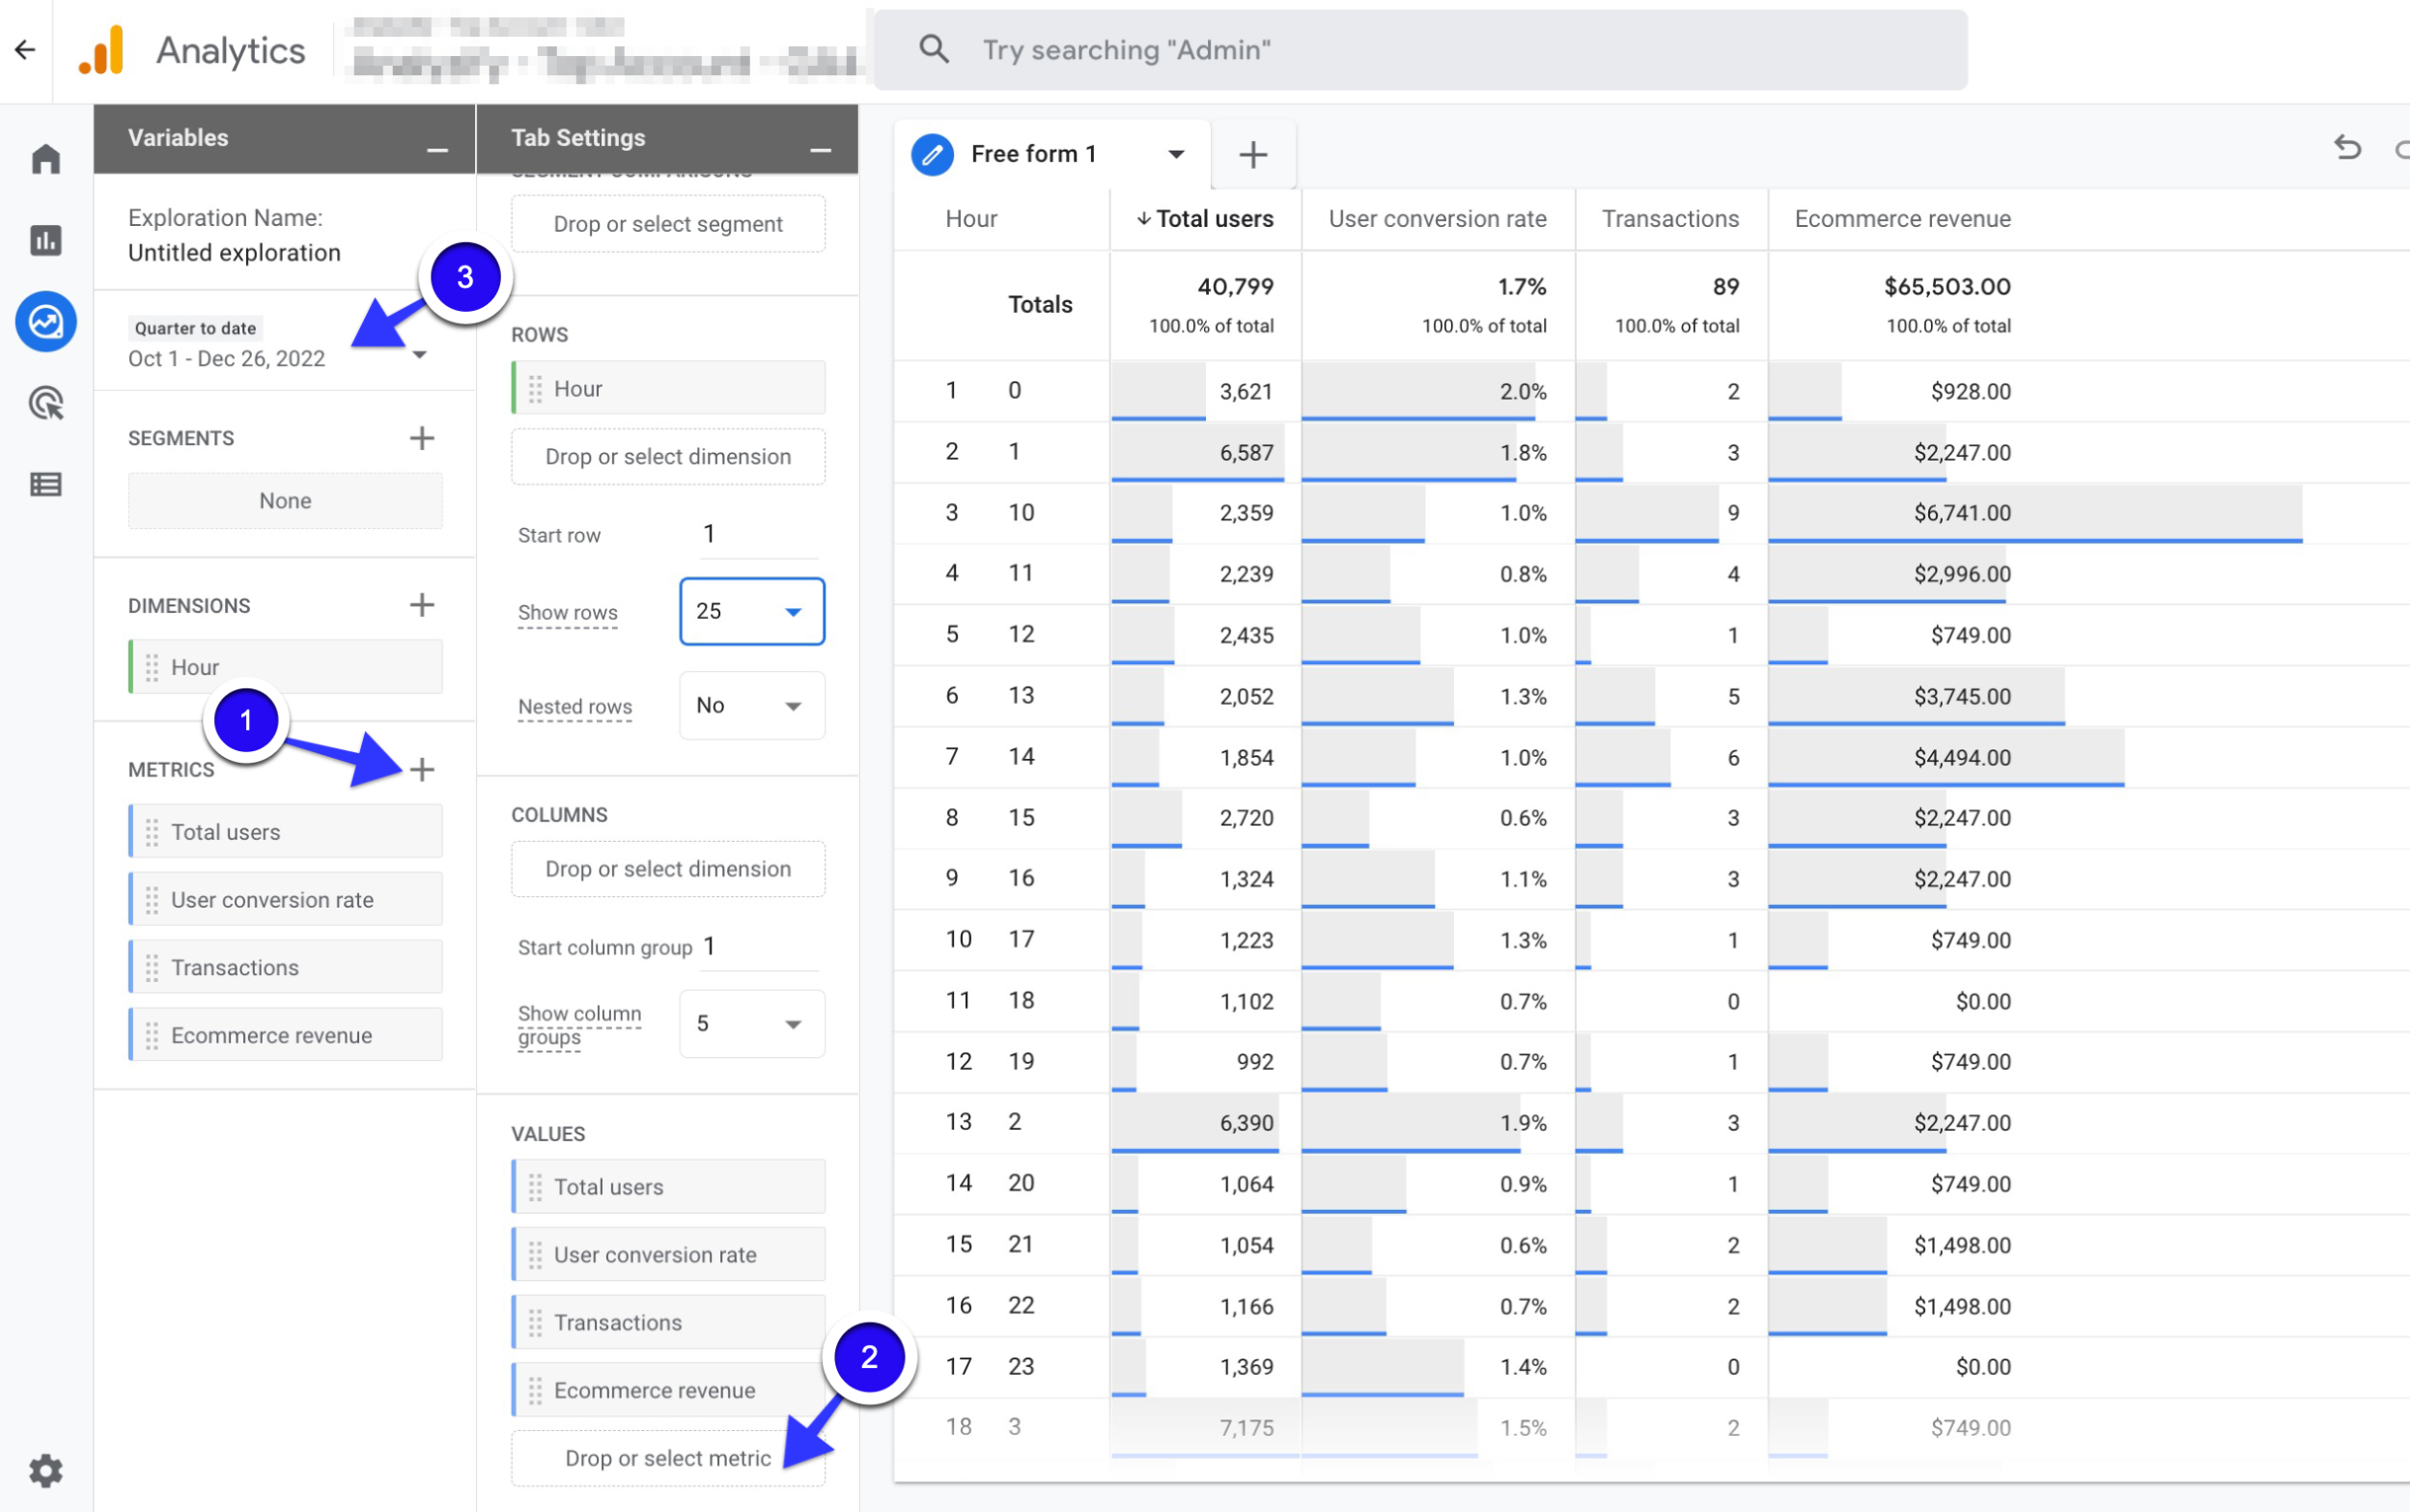
Action Advice:
Analyze the hours when your potential customers visit your website the most and convert the most. Use these analytics in the ad scheduling of your PPC campaigns.
In particular, you can apply a "+ bid adjustment strategy" for the most popular time zones in your Google Ads campaigns. On the other hand, you can pause your ads during low engagement hours.
3. Google Ads Search Term Report in GA4
GA4 does not yet report data containing search terms for all site traffic. However, it presents the search terms of your Google Ads campaigns in detailed reports.
Why should you create Google Ads Search Term Report for Paid Search in Google Analytics 4 (GA4)?
Determining which words the site traffic comes from and the relevance of these words to the product/service allows you to focus on the right keywords in PPC ads.
In these reports, you can compare more metrics than the search terms analysis in Google Ads. For instance, event names and numbers, the number of purchases, or the site abandonment points of users for each search term.
So, you can evaluate your words in light of these data. Plus, word reports are very useful for SEO.
How to create Google Ads Search Term Report in Google Analytics 4 (GA4)?
Learn how to create a Google Ads Search Term Report in GA4 to interpret the results and take action to optimize your campaigns.
You can start getting insights into your search campaigns with a detailed 3-step guide below.
Navigate to your GA4 account and then click on “Explore” in the left-side column. Next, go ahead and “Create new exploration”.

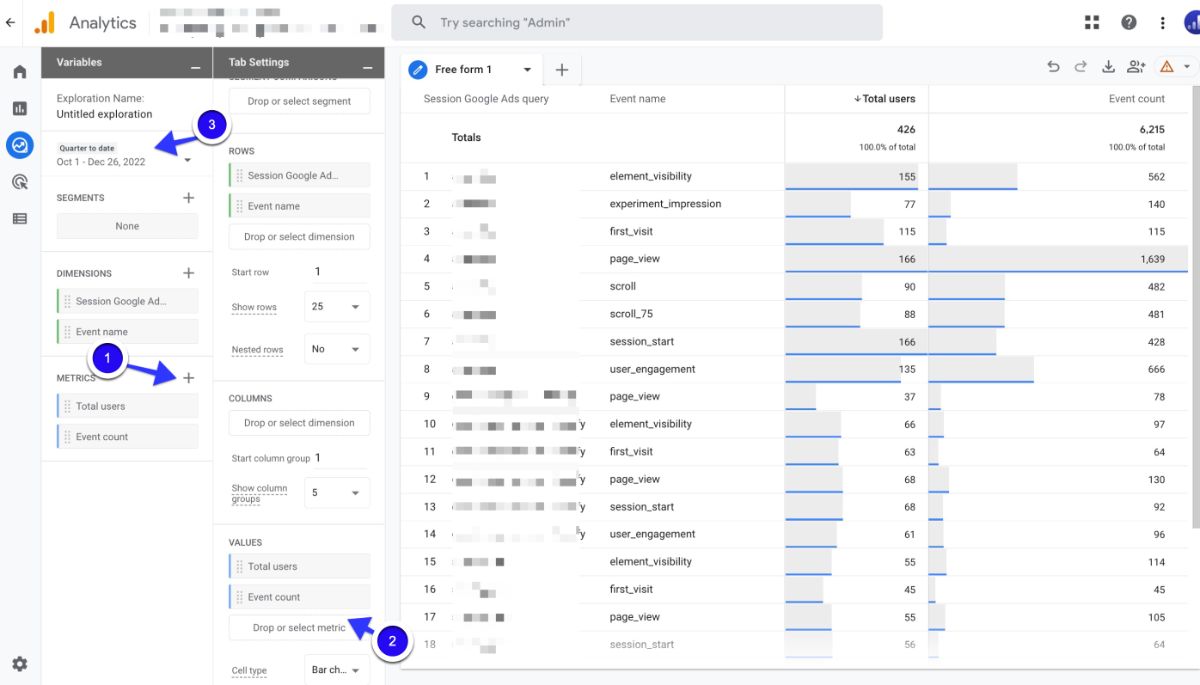
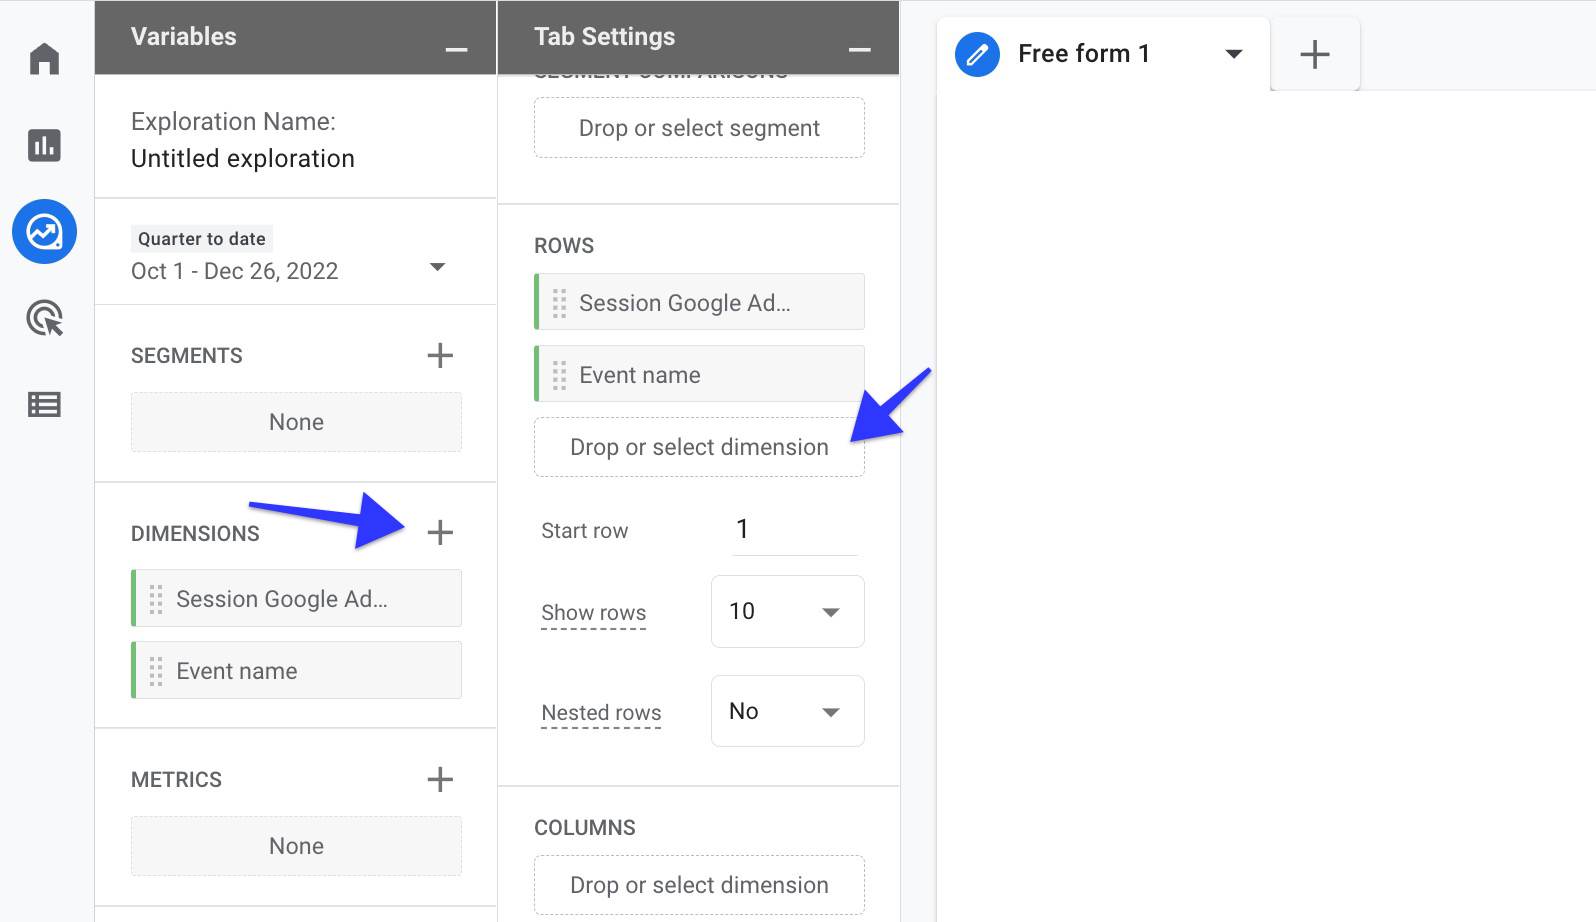
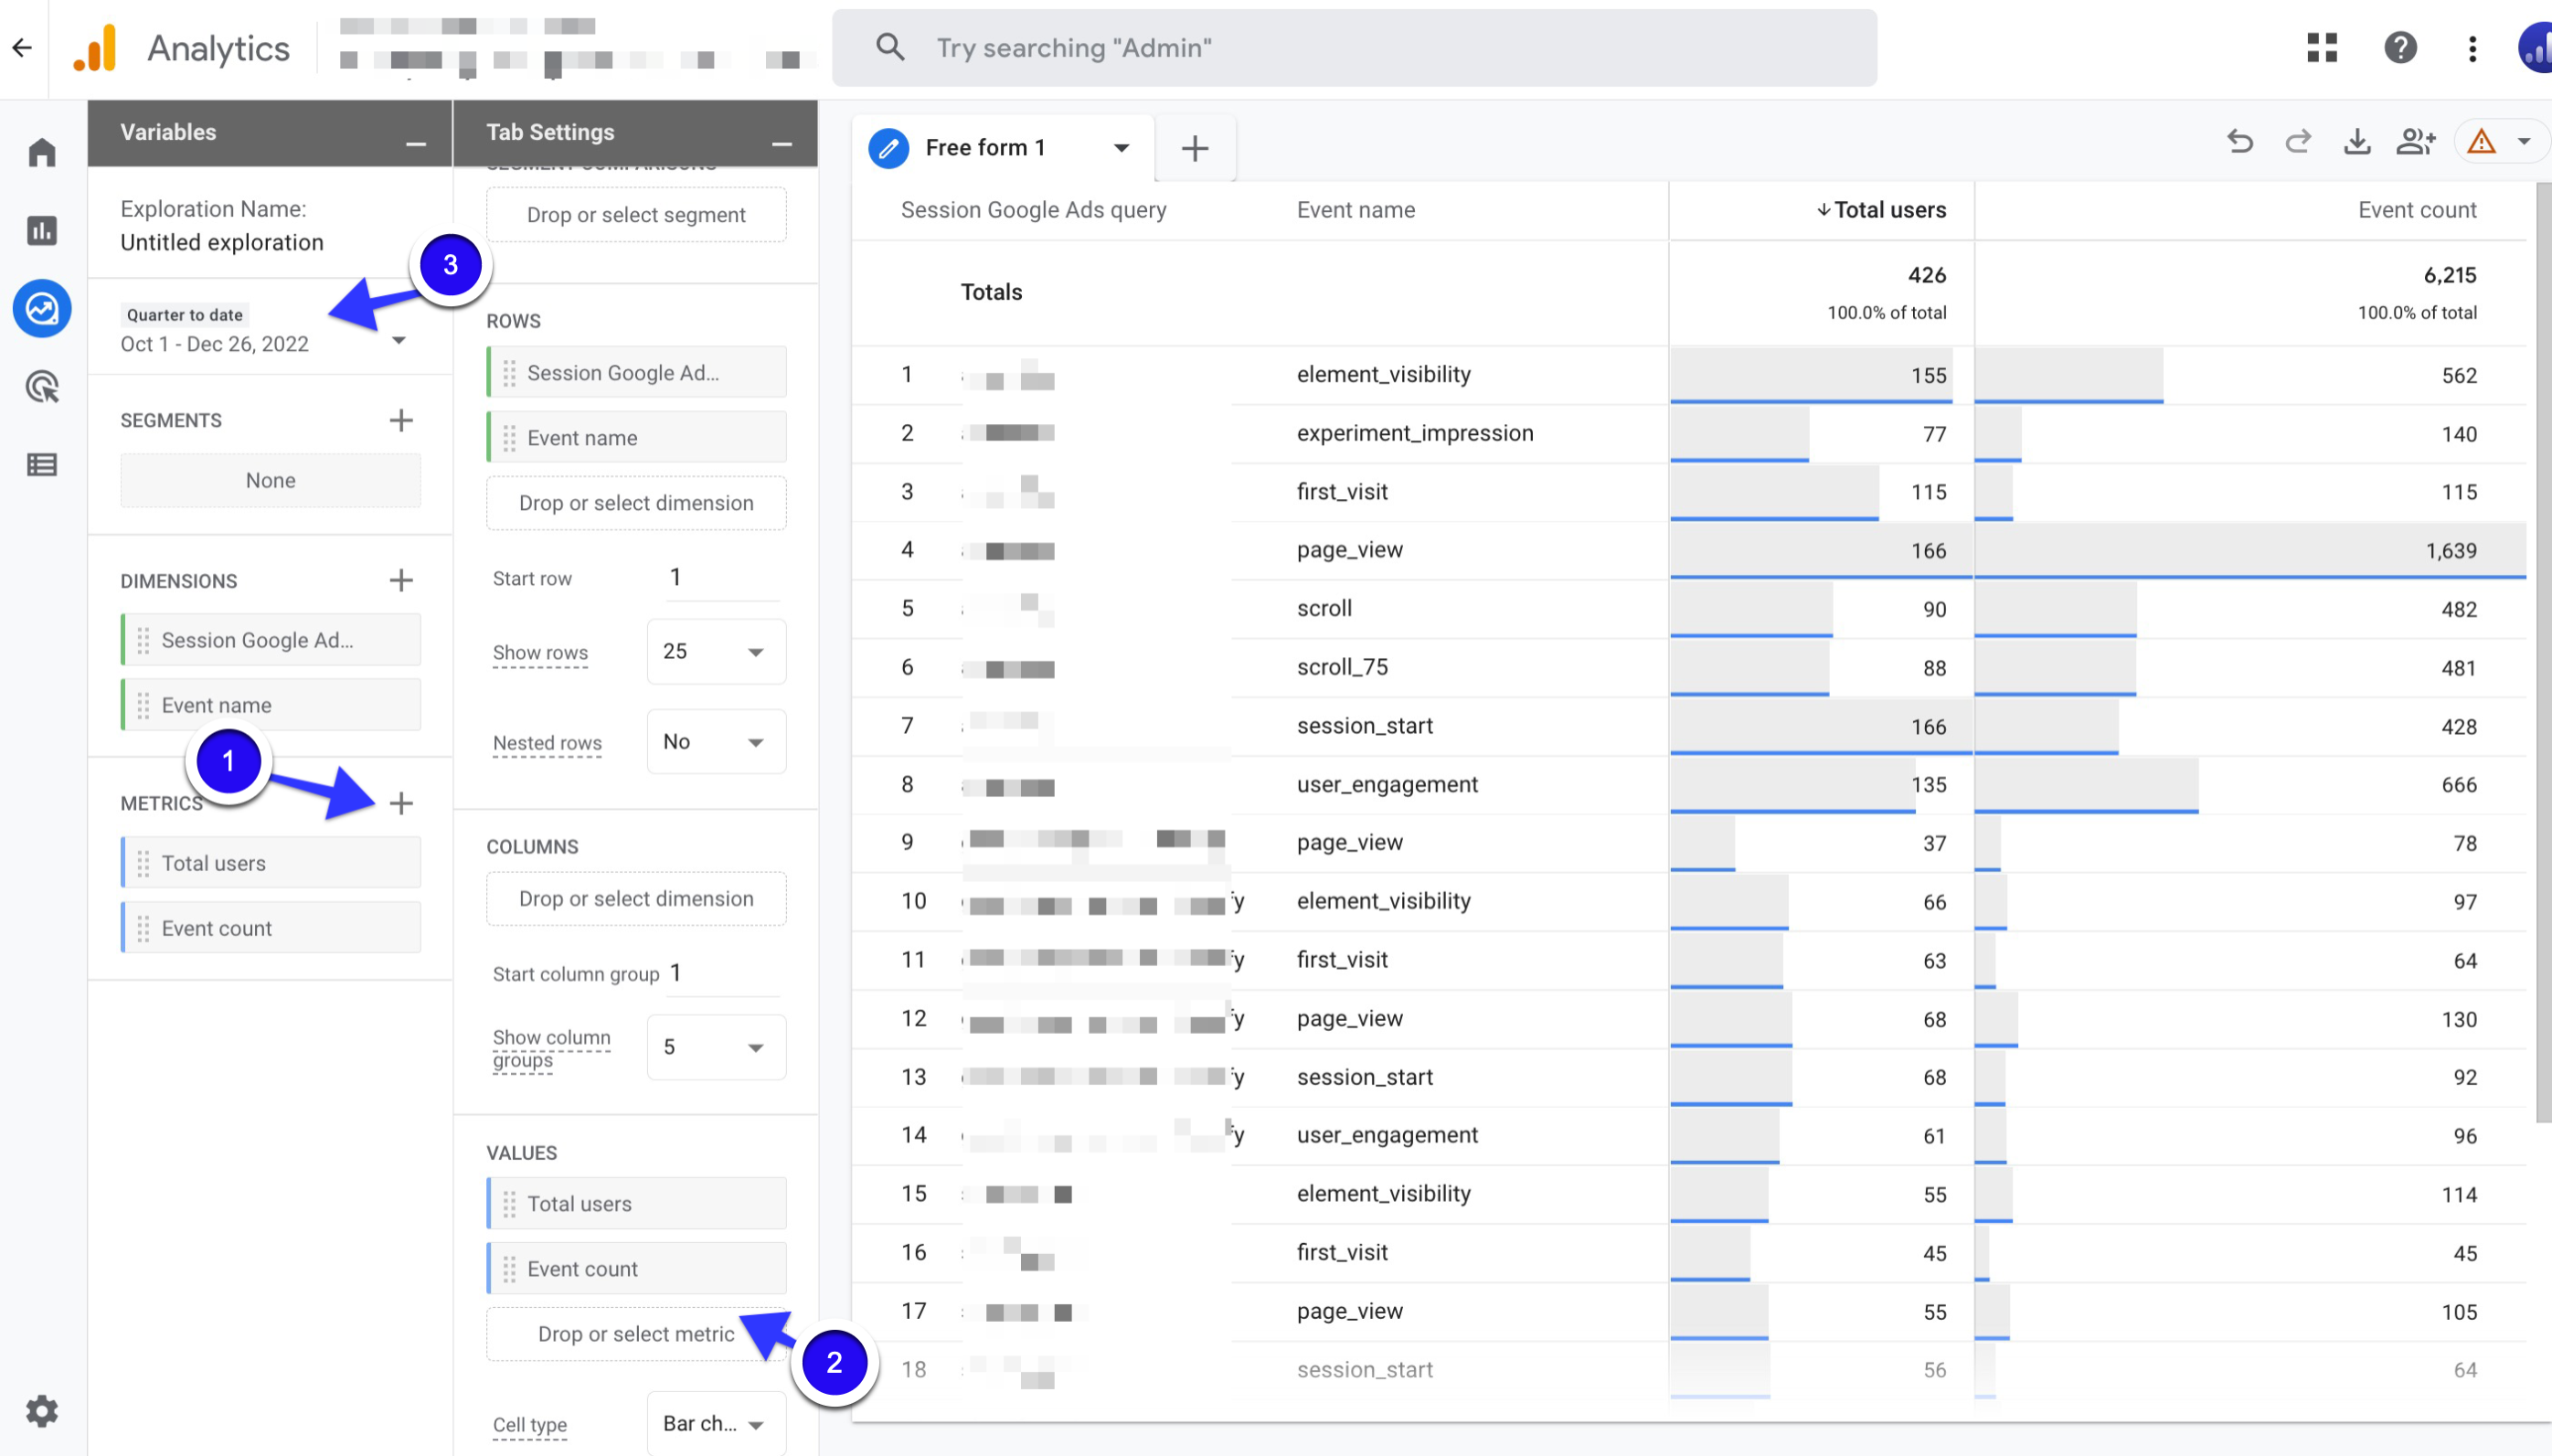
Add “Session Google Ads query” and Event name as dimensions to your report. To do this, click on the + button next to “Dimensions” and select the desired dimensions from the list. If you want to use existing dimensions, simply drag and drop the dimension under "rows" in the tab settings.
Select the metrics you want to compare and add them to your report. If you want to use existing metrics, simply drag and drop the metric under "values" in the tab settings. For example total users and event count. After creating your report, you can start making your comparisons by selecting the date range you want.
Action Advice:
Analyze which search terms you can collect for the events you want. Identify words that meet and exceed your expectations. You can make changes to your bidding strategy for these words. Or you can create a separate ad campaign for these words and apply custom budgets and bids.
You may also consider high-performing word/word groups for your SEO strategy.
You can add low-performance search terms to ad campaigns as negative keywords and avoid advertising costs arising from these words.
4. Landing Page Analysis Report in GA4
The Landing Page Report shows you which website pages get how much traffic and conversion rate. As GA4 collects data for all your website pages, it allows you to analyze your most popular pages very easily.
A landing page analysis report can help you understand how users are interacting with your website by showing you data on the pages that users land on when they visit your site.
This can help you identify which pages are performing well and which pages may need improvement.
Why should you create a Landing Page Analysis Report for PPC (Paid Search) in Google Analytics 4 (GA4)?
One of the crucial steps in getting conversions from PPC ads is to provide a good landing page experience. The first place you greet the user who clicks on your ad is on your landing page.
In addition, the first impression is always very important. With a good landing page, you will be more likely to get conversions from users who click on the ad.
Another importance of the landing page is that it is among the quality score metrics. A quality score is a number from 1 to 10 that has a direct impact on ad ranking.
With higher quality scores, you can have better ad rankings with lower bids. You can increase your quality scores with relevant and impressive landing pages for your ads.
Thus, you can both increase your ad rankings and provide a cost advantage.
How to create a Landing Page Analysis Report in Google Analytics 4 (GA4)?
Follow the easy steps below to analyze data about the pages that users land on when they visit your website, which can help you identify opportunities to optimize those pages for better conversion rates.
Go to your GA4 account and click on “Explore” in the left-side column. Then, click on “Create new exploration”.

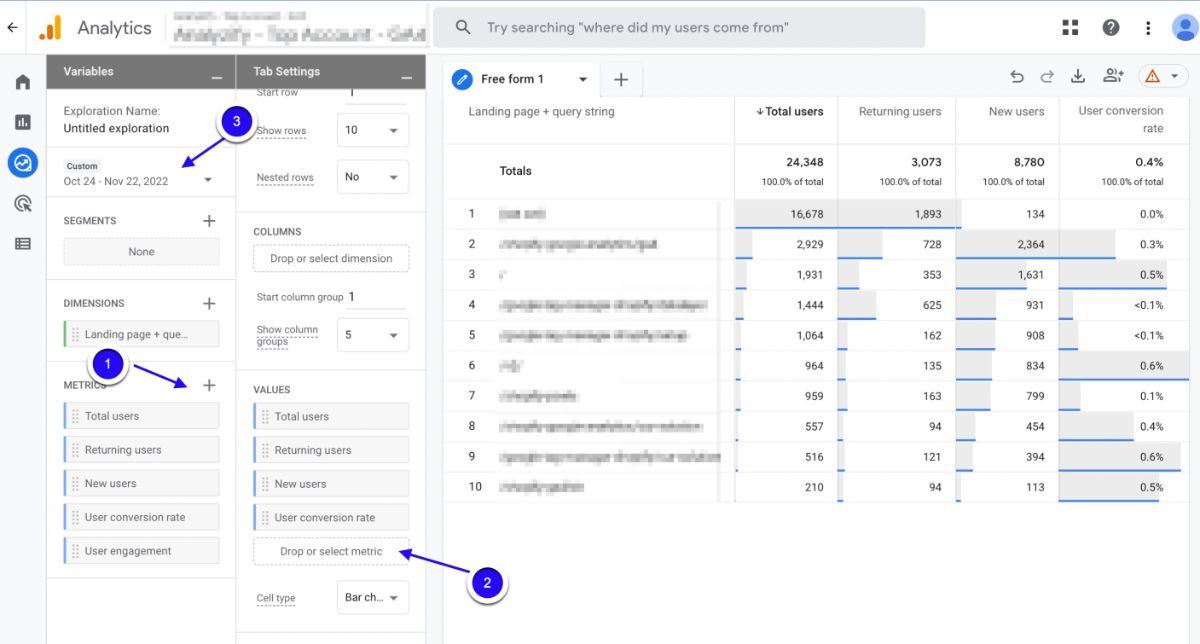
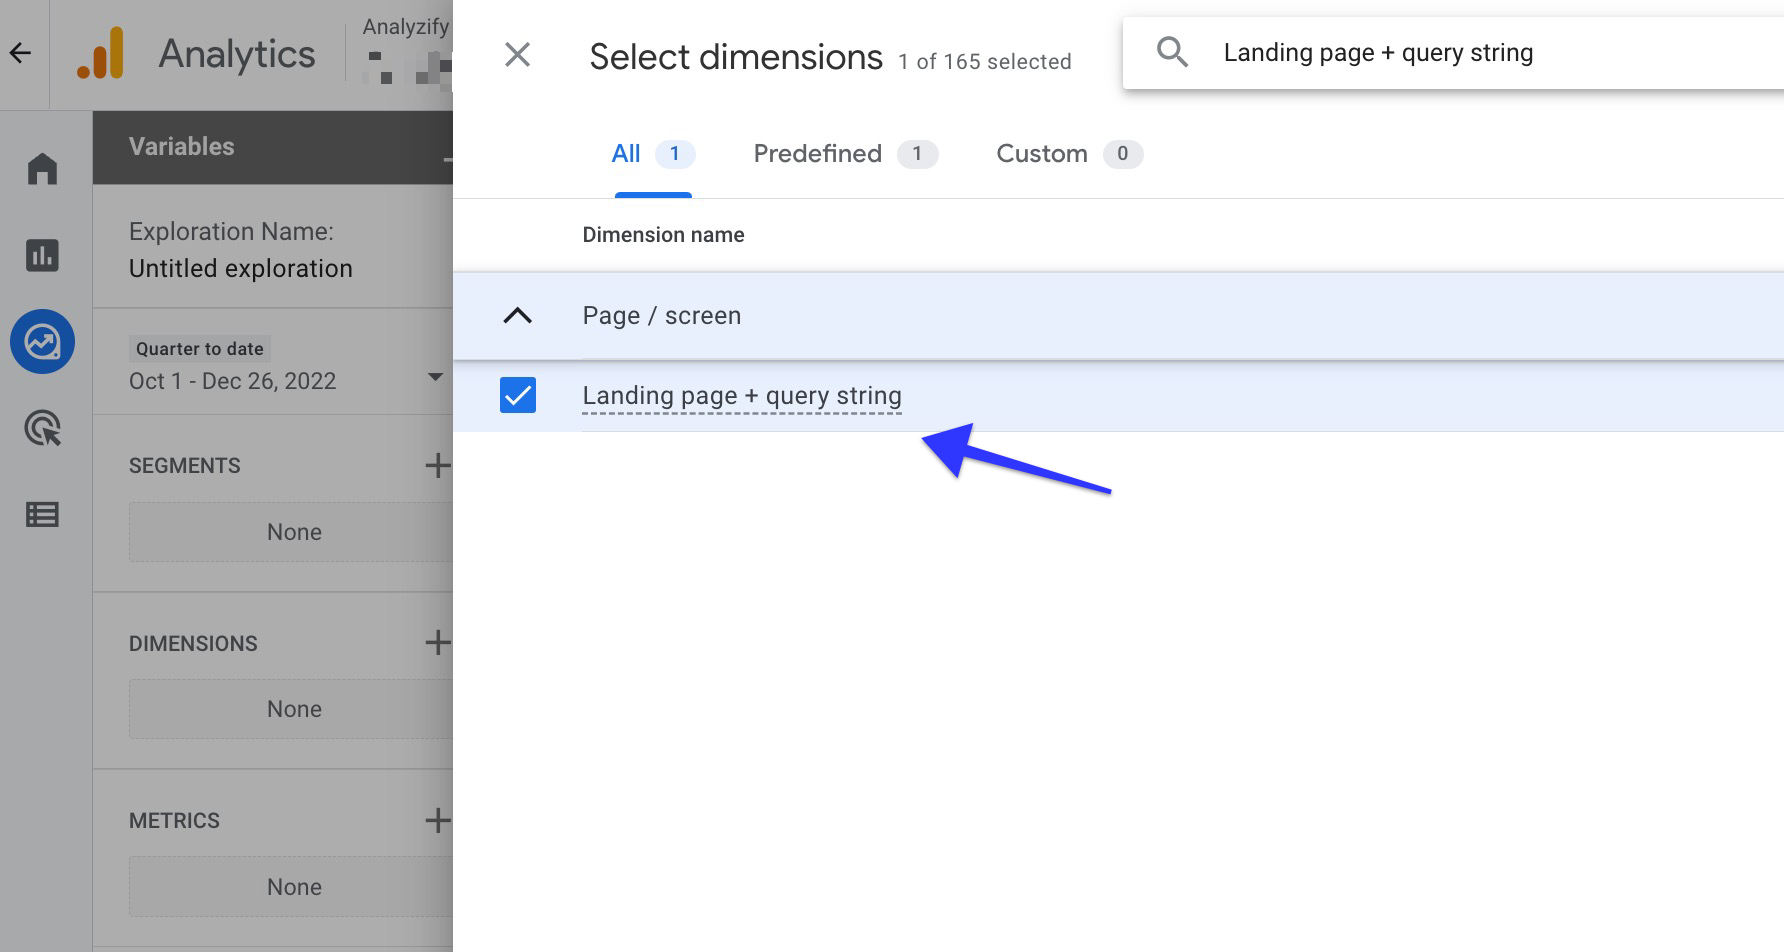
Add “Landing page + query string” as dimensions to your report. To do this, click on the + button next to “Dimensions” and select the desired dimensions from the list. If you want to use existing dimensions, simply drag and drop the dimension under "rows" in the tab settings.
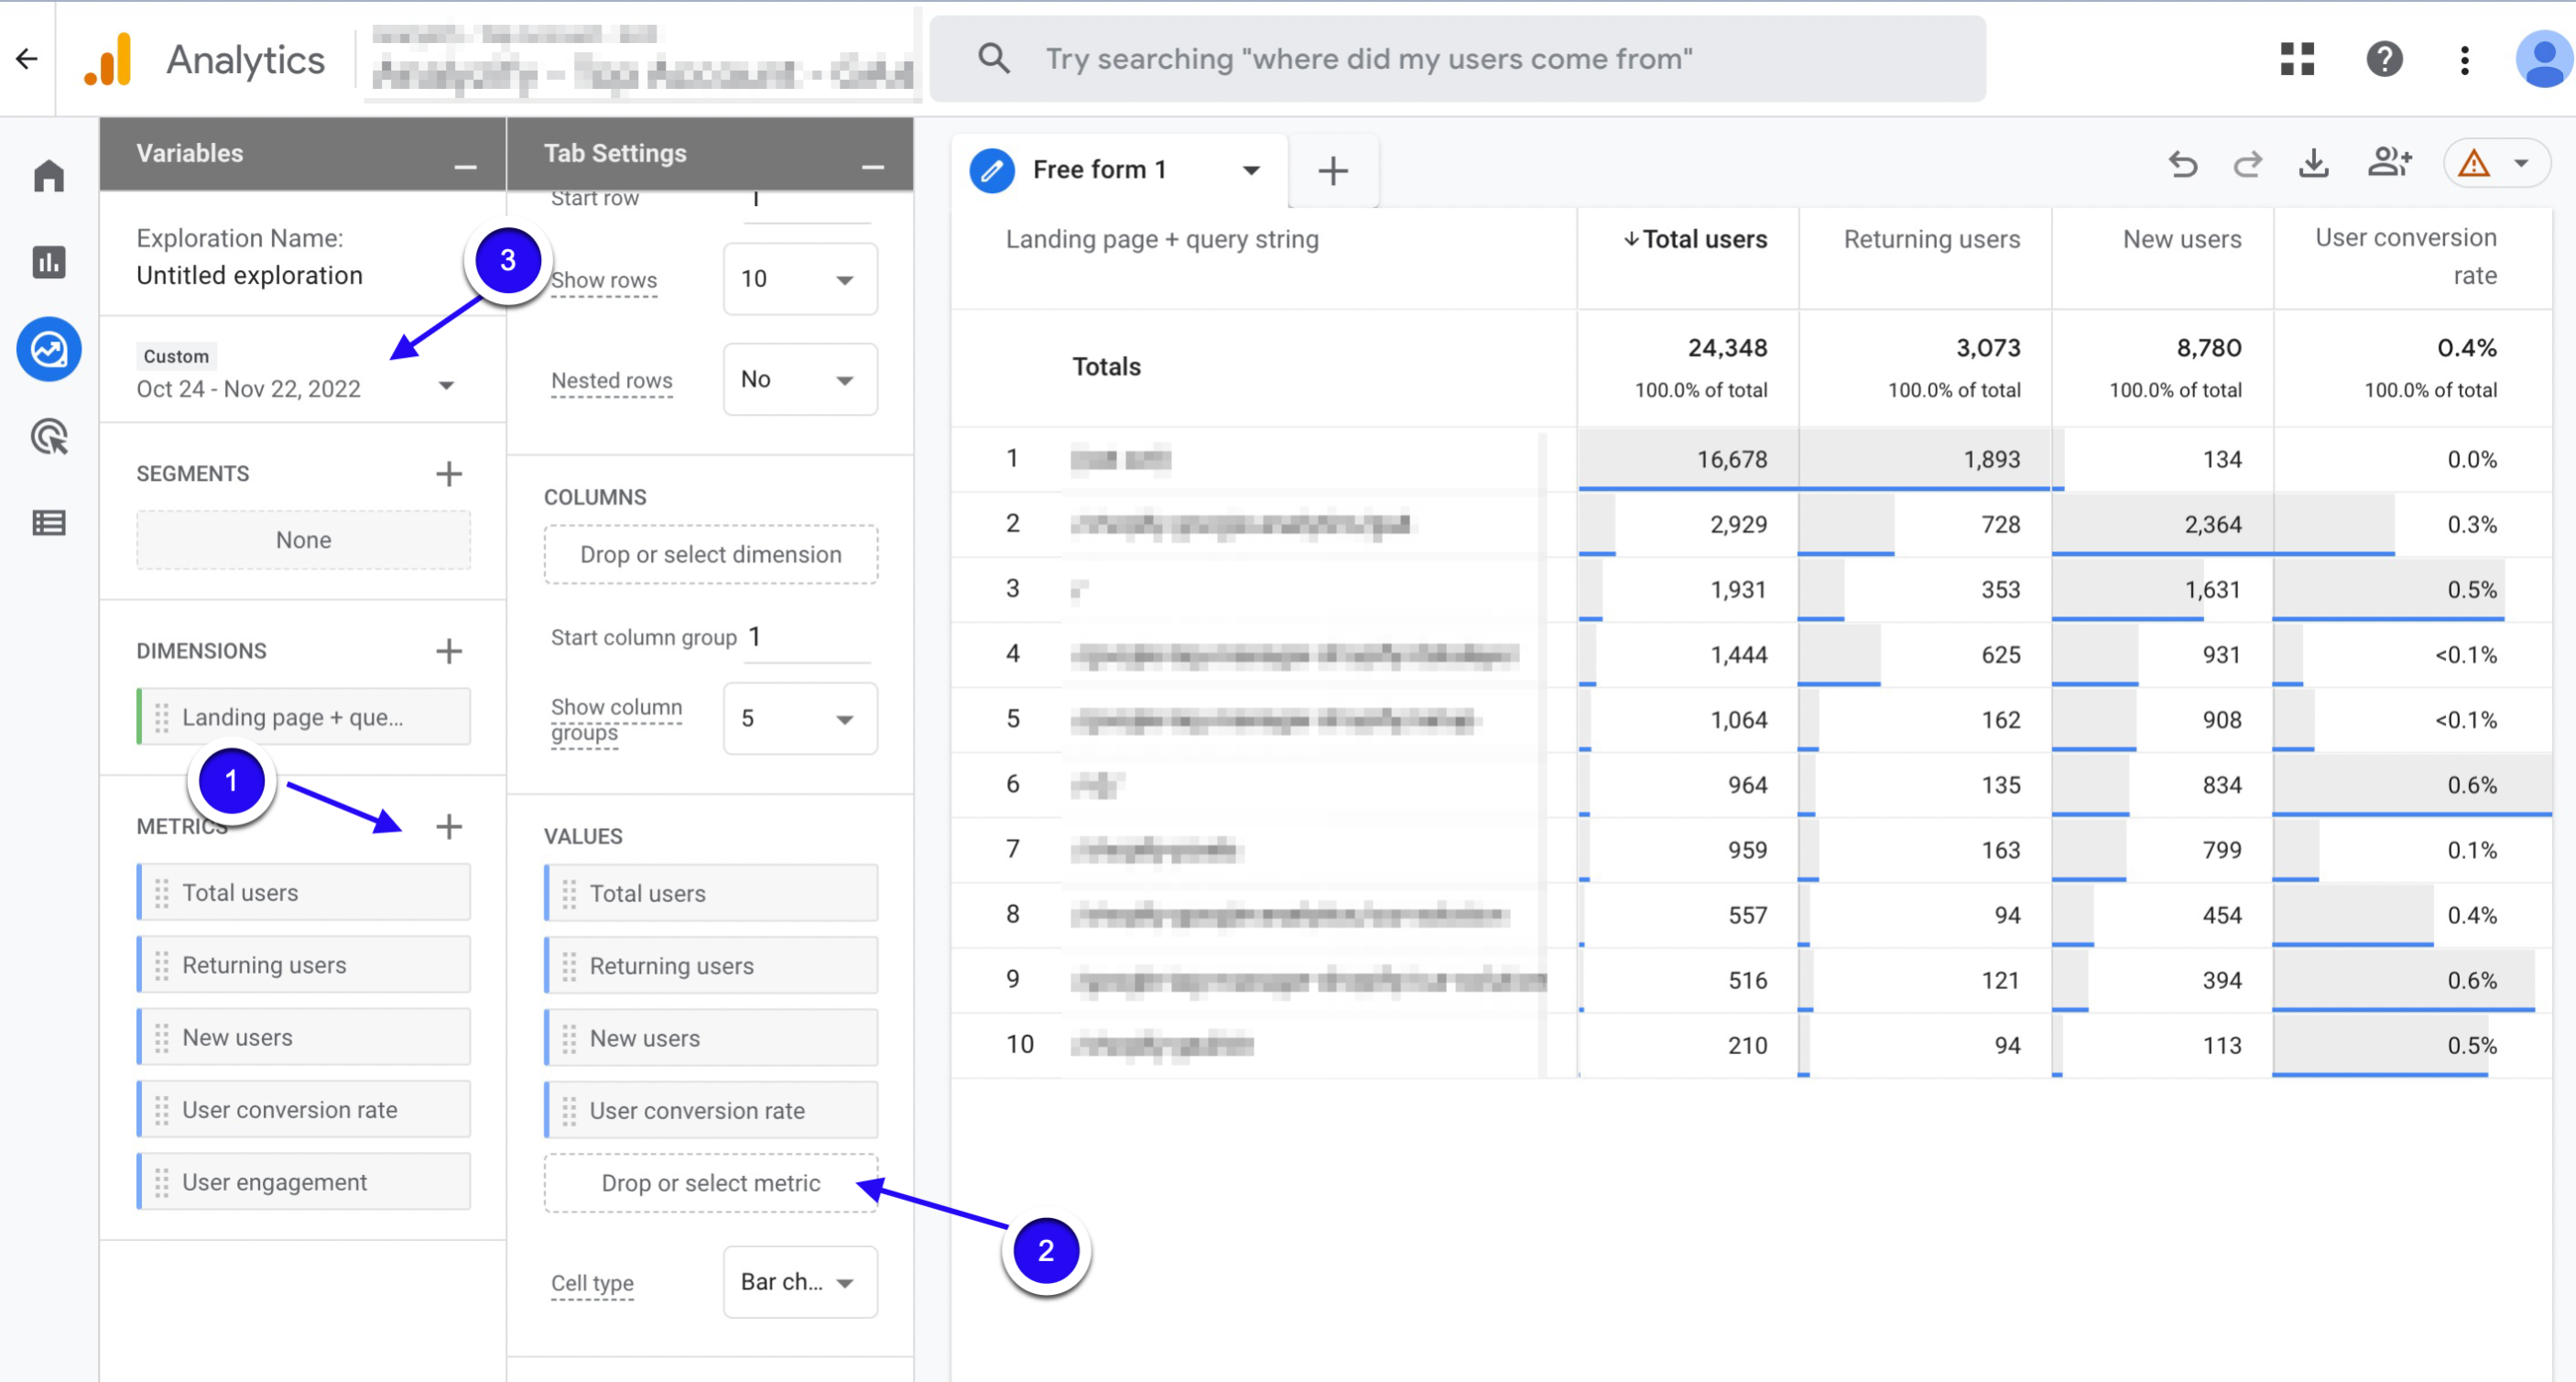
Select the metrics you want to compare and add them to your report. If you want to use existing metrics, simply drag and drop the metric under "values" in the tab settings. For example Total users, returning users, new users, and user conversion rate. After creating your report, you can start making your comparisons by selecting the date range you want.
Action Advice:
Wouldn't you like to keep a user for whom you paid advertising costs with an impressive welcome? Here's your opportunity: identify your top traffic pages and use them as landing pages for your PPC ads.
You can also measure your most trafficked product pages with this report. Thus, you can apply a special bidding strategy to these product groups in your PPC campaigns. Or, after you identify your popular products, you can prepare special advertising campaigns or promotions for them.
5. Referral Report in GA4
Referral traffic refers to the traffic that comes to your website from other websites. In other words, it's traffic that is referred to your site from other sites that are linking to your content.
The referrals report, on the other hand, is a collection of user data from other websites that send traffic to your website.
Therefore, any online channel that has a link to your website is considered referral traffic. For example, your social media accounts are among the best referral traffic providers.
Why should you create a Referral Report for PPC in Google Analytics 4 (GA4)?
With the referral report, you can better find the resources that increase your site traffic and make sense of the users' roadmap.
You can make use of these roadmaps when determining and optimizing your marketing strategies with referral traffic analysis.
By focusing your budgets on high-impact channels, you can make moves to increase your return on investment.
It also gives you a qualitative overview of how well your social media accounts and online partnerships are contributing to your business goal.
How to create a Referral Report in Google Analytics 4 (GA4)?
With GA4, you can monitor the data concerning the websites that are sending traffic to your site, which allows you to identify which websites are driving the most traffic to your site.
In order to see the related data, follow these easy steps:
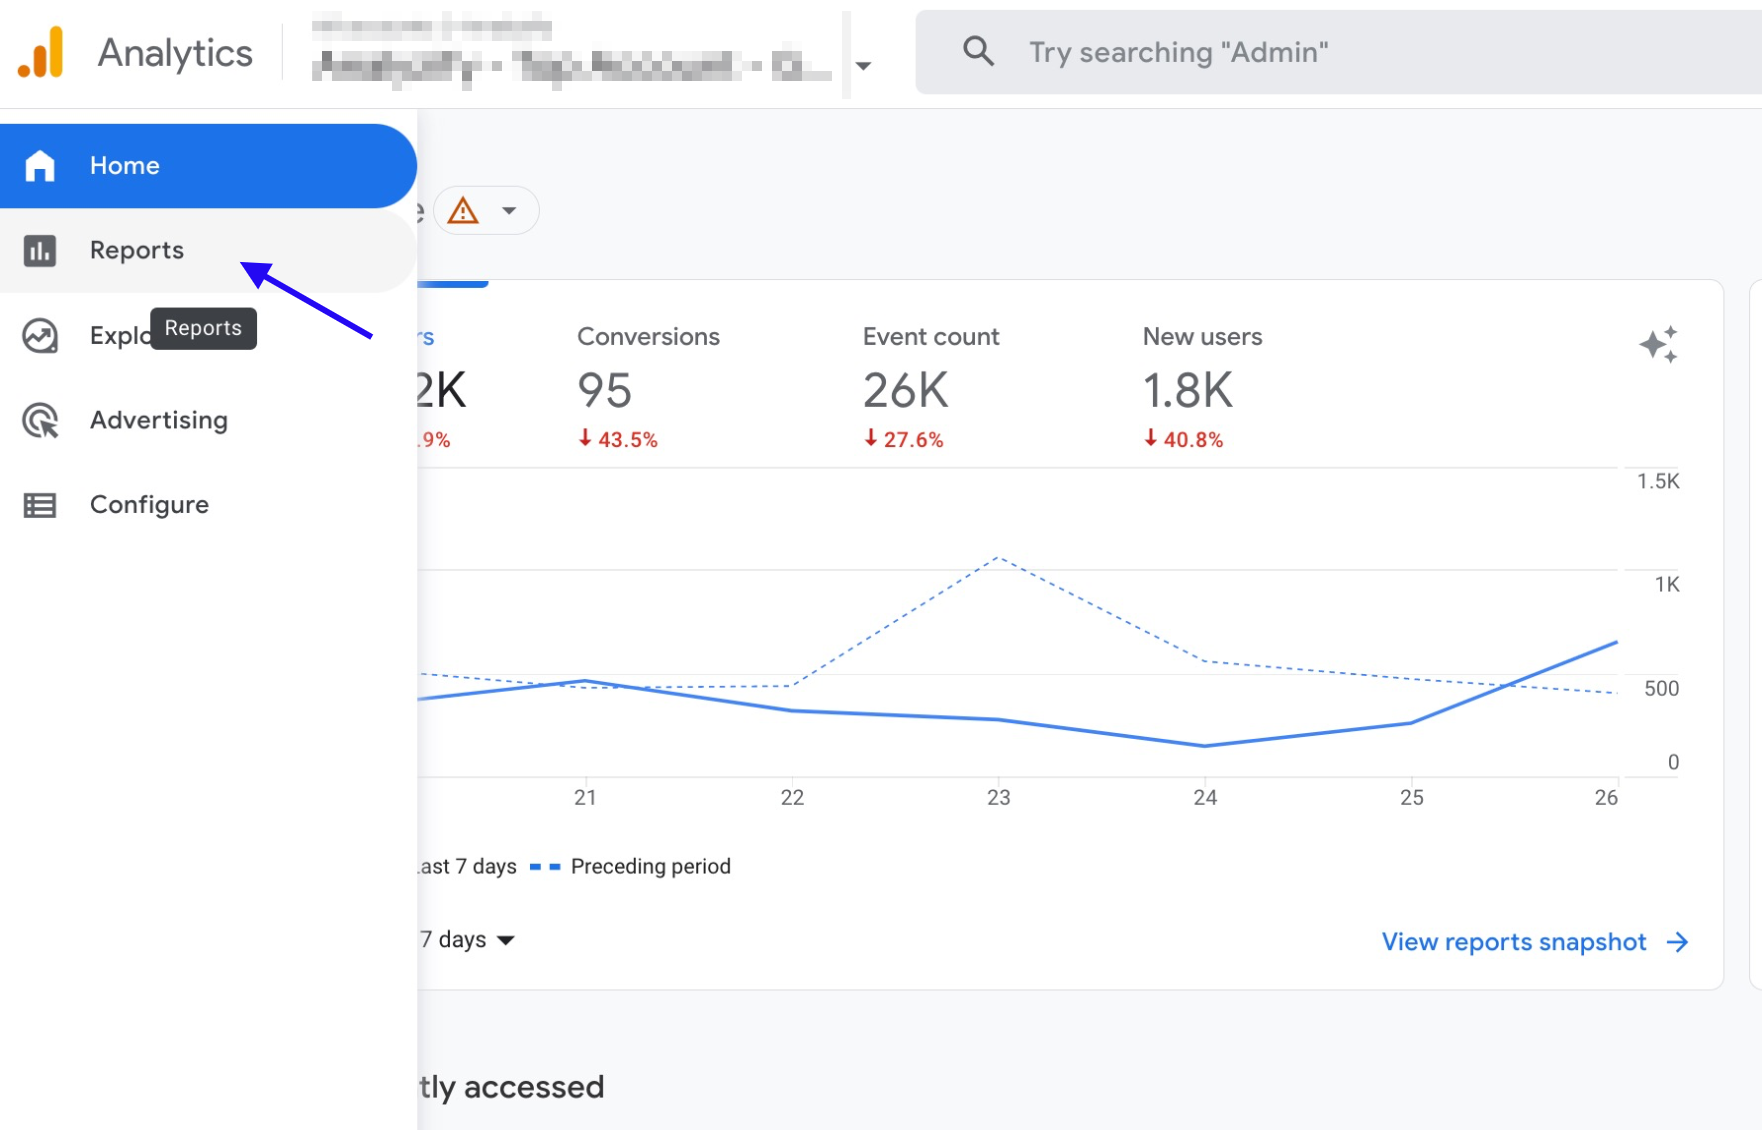
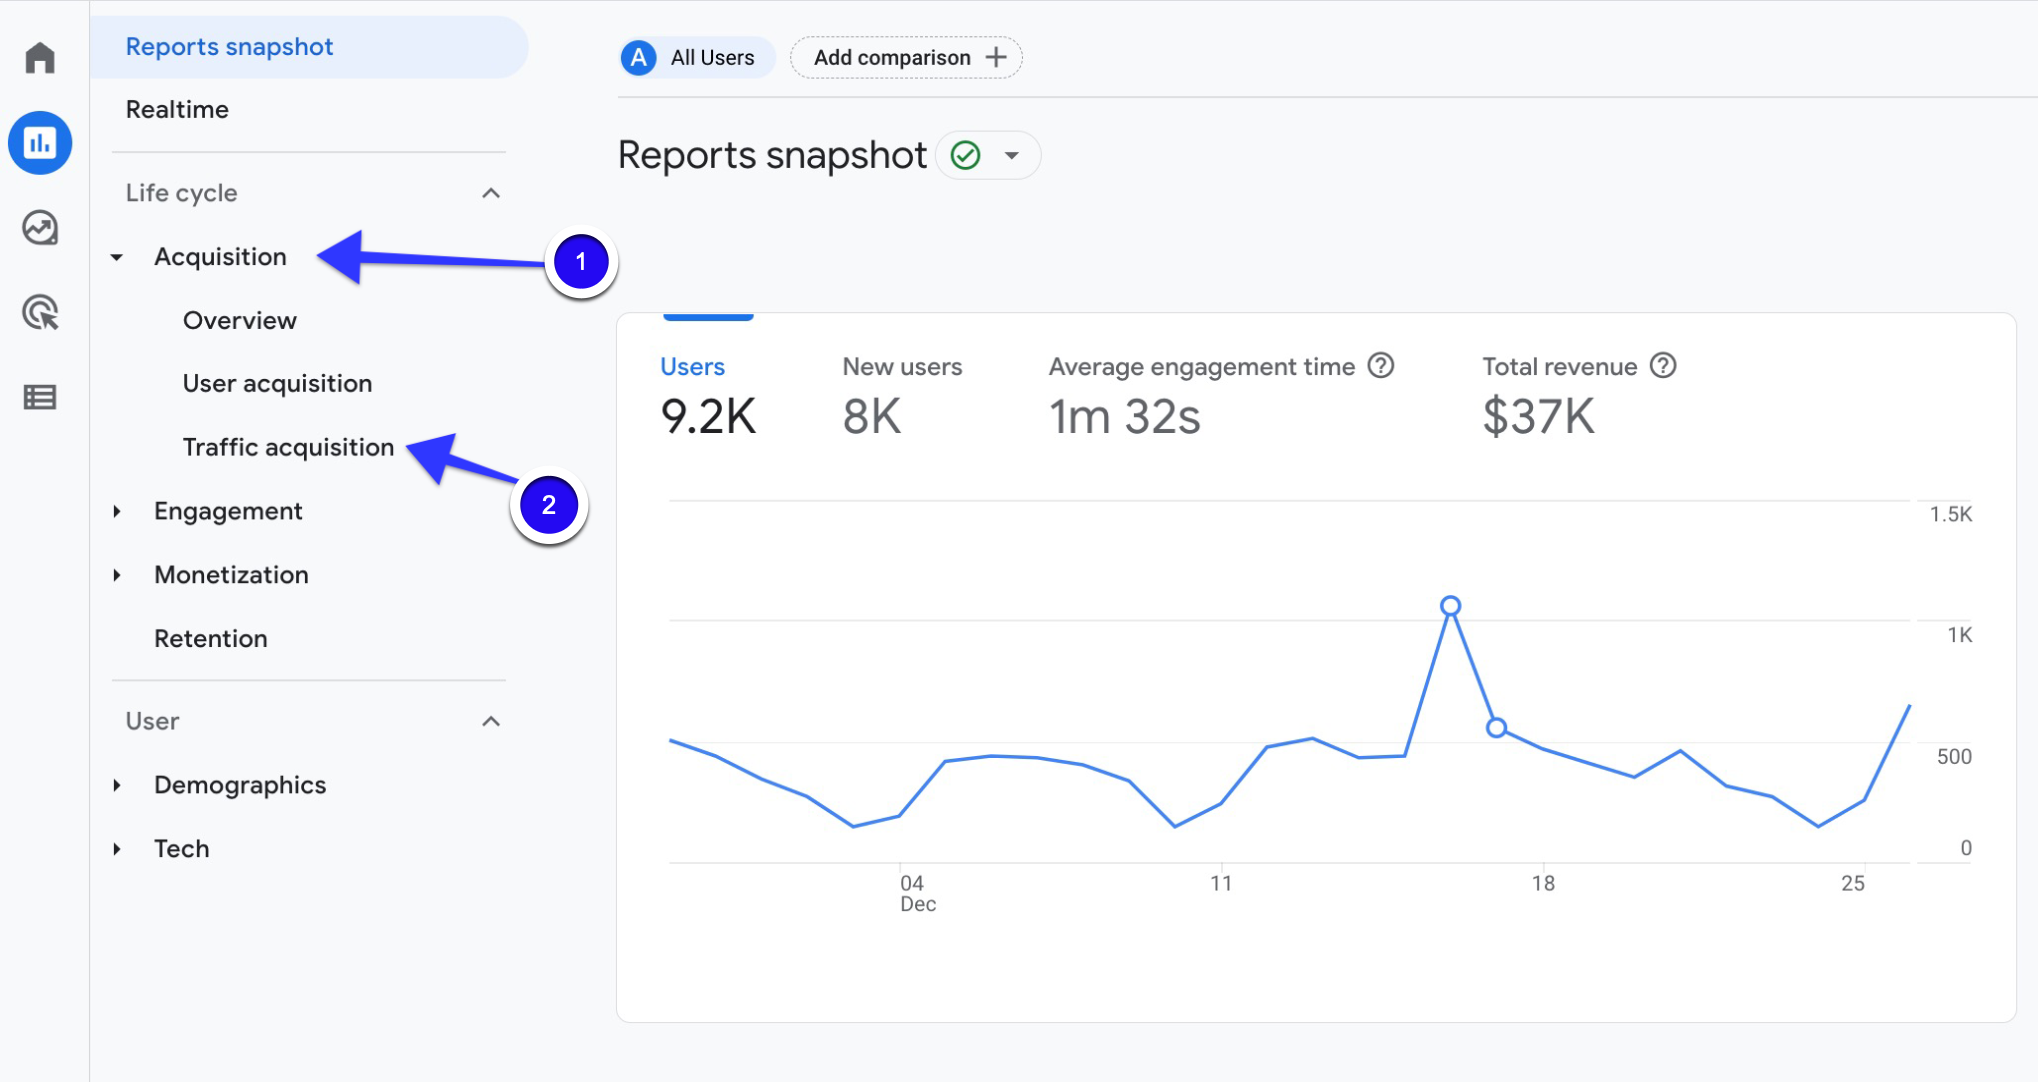
Go to your GA4 account and click on “Reports” in the left column.
Click on “Acquisition” and then select “Traffic Acquisition ”.
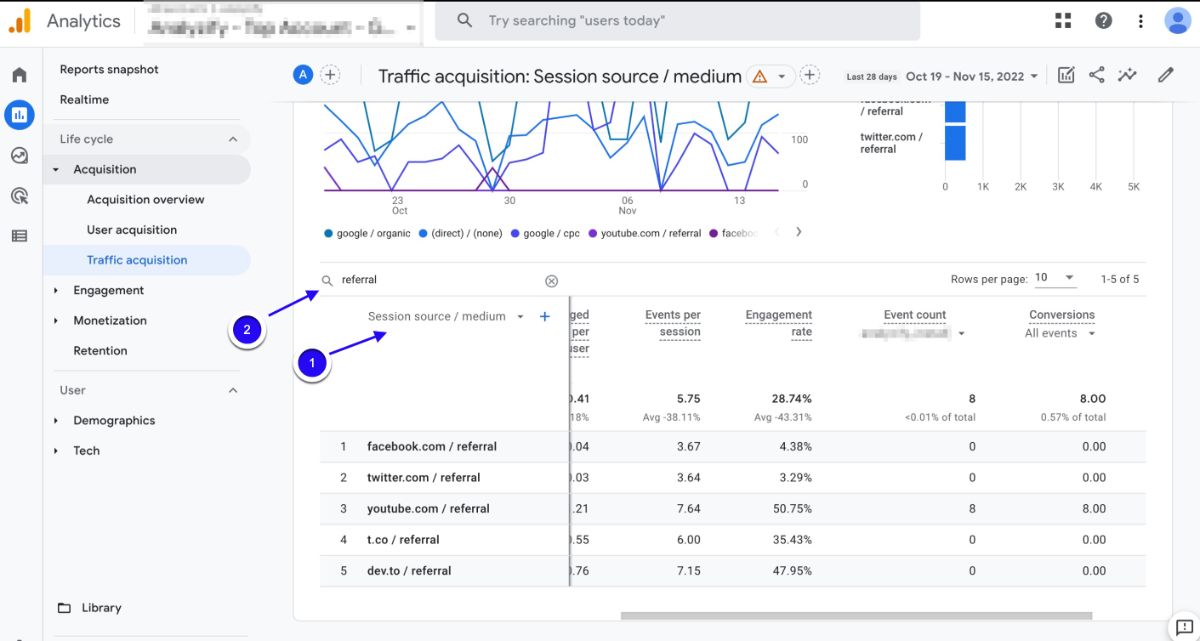
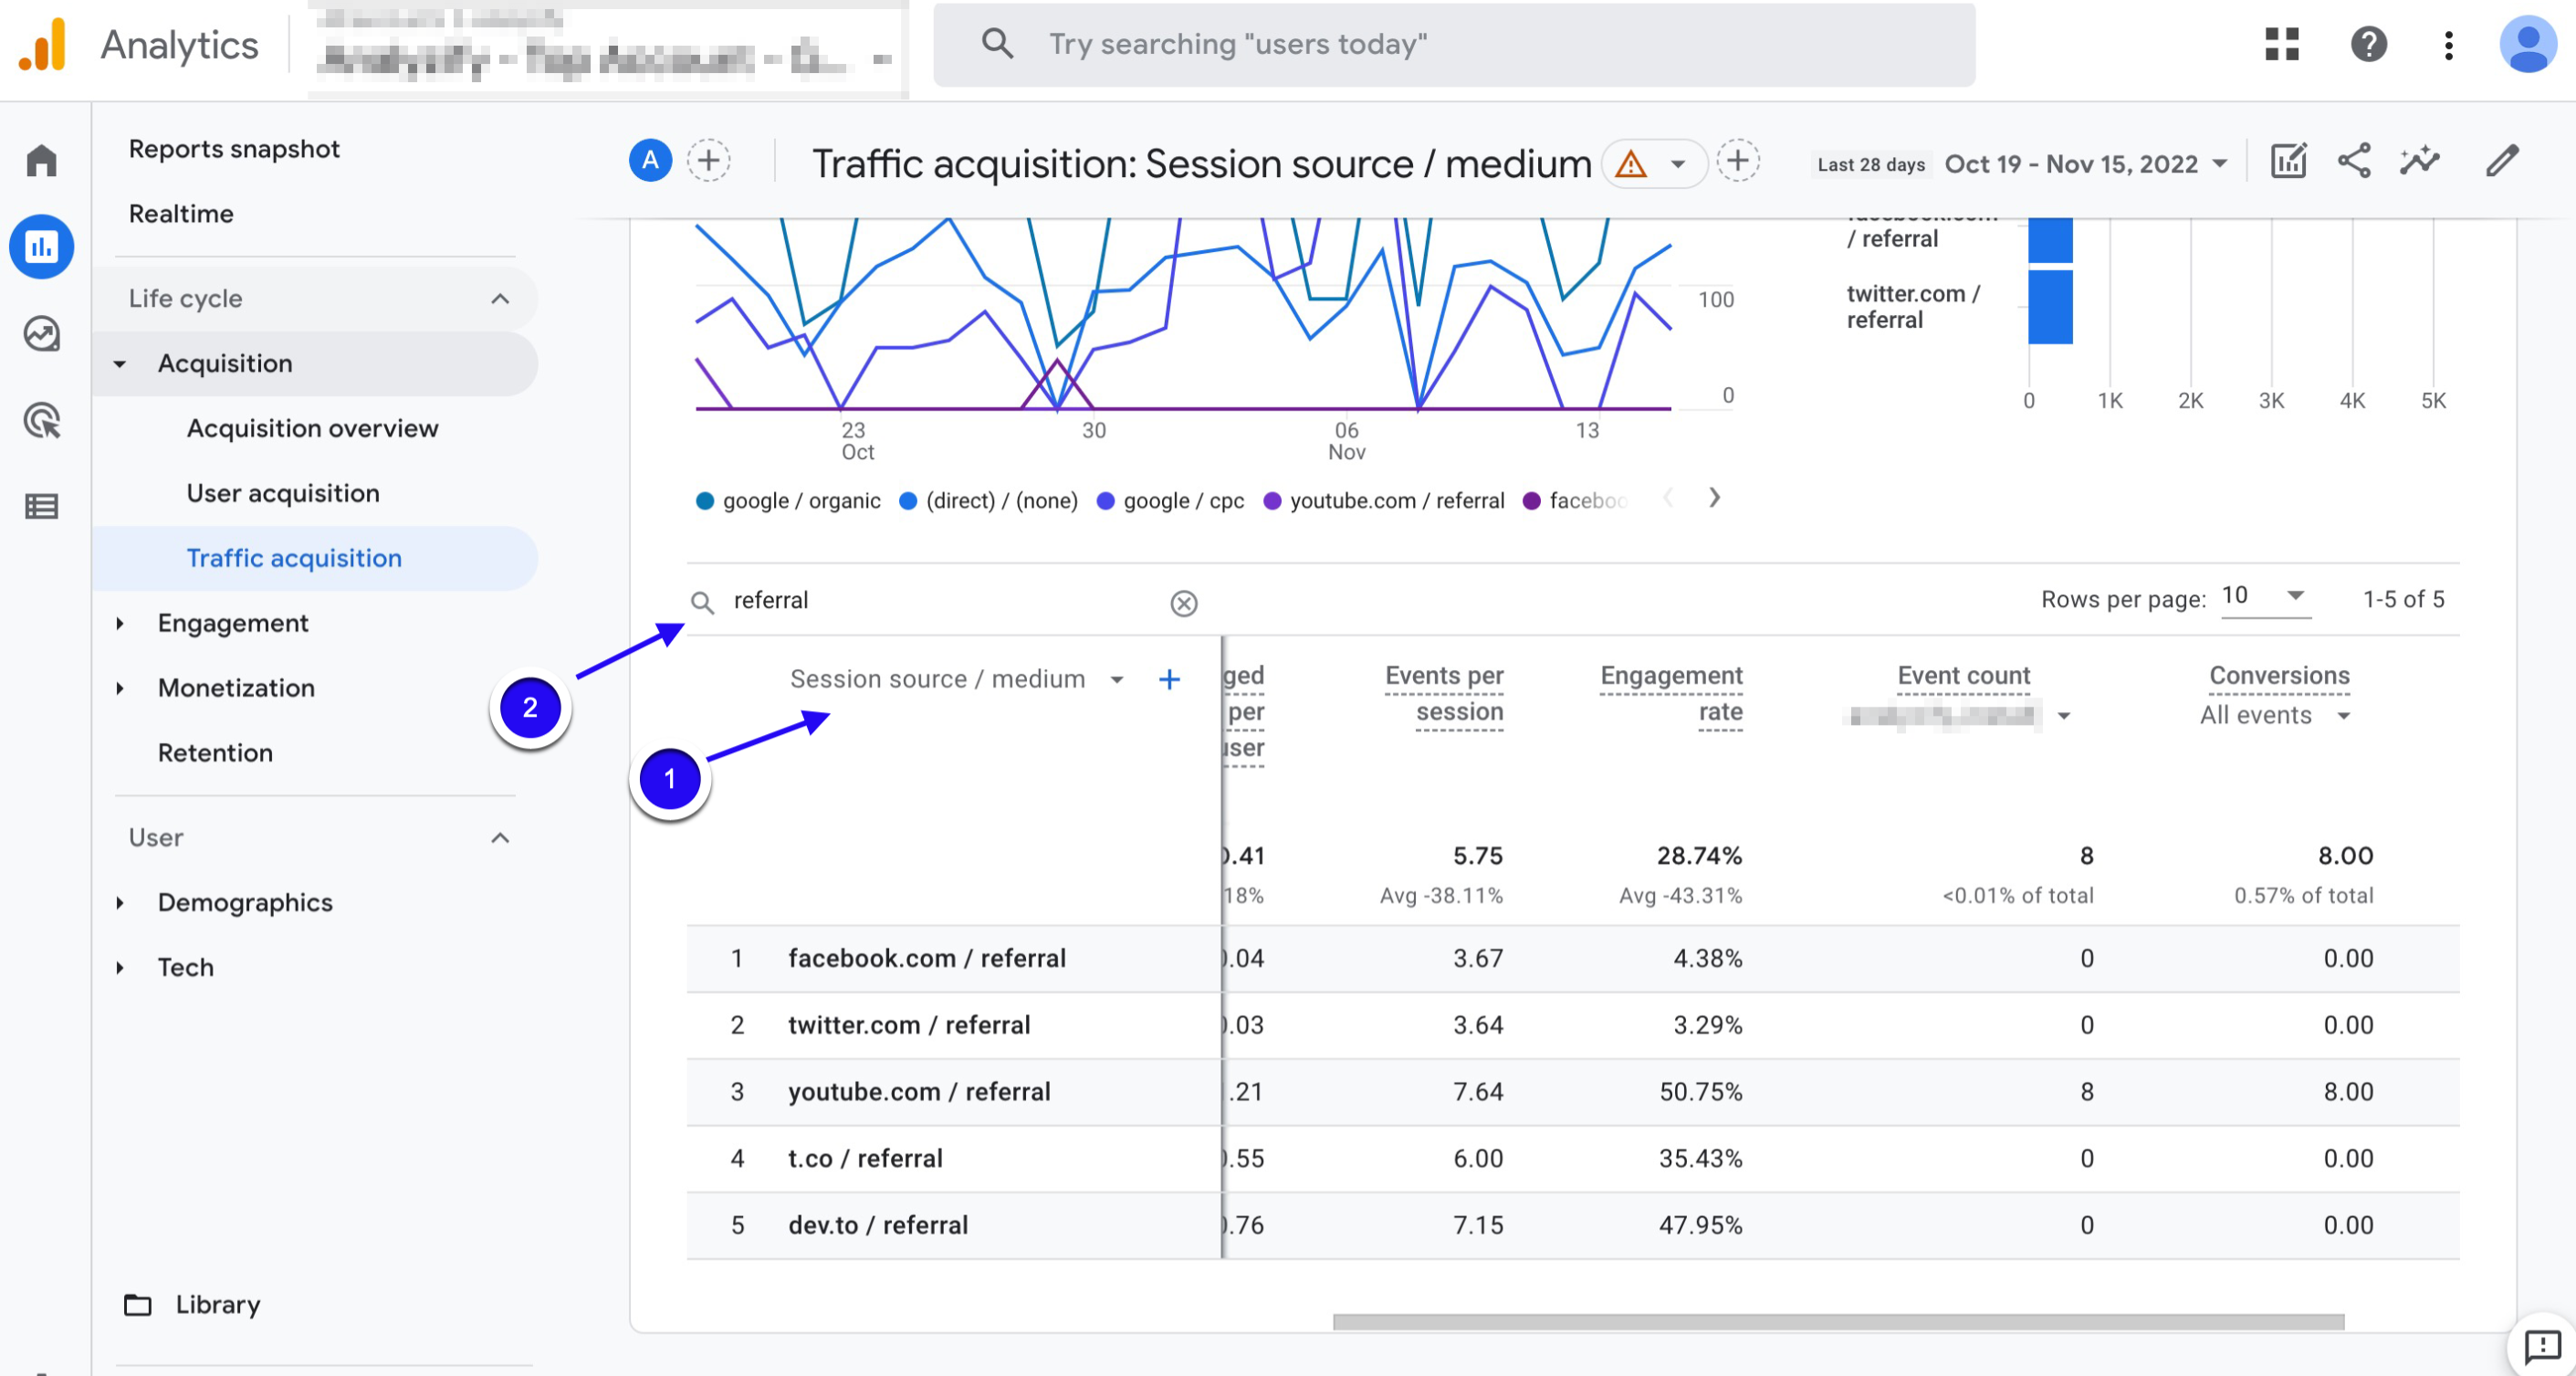
From the dropdown menu, choose “Session Source/Medium” and type “referral” into the search bar to analyze only the referrals. Then, you can see the data of the referral traffic source in the table.
Action Advice:
We have two great tips for you to make effective use of referral reports:
Let's start with the first one. Identify the social media accounts where you get the most traffic and start rolling up your sleeves to create impressive advertising campaigns on these channels.
For example, let's assume that the user traffic from Instagram is high and the conversion rates of these users are good. Here is an excellent opportunity to reach more potential customers. You can immediately log in to your Meta Business panel and start advertising on Instagram. If you already have Instagram ads, you can optimize your budgets and ads in your existing campaigns. Now we come up with another suggestion, get ready to fly! You can use referral sources in Google Ads display campaigns.
So, now it comes to the question of ‘how?’. The answer is pretty simple, though. Firstly, create a list of these referral sites that contribute positively to your site traffic. Then, sign in to your Google Ads account and create a "Placements Audience" or Placements Targeting" for a Display campaign. By using your referral list in this campaign, you can increase your traffic in channels with high interaction rates and contribute to your sales.
6. Conversion Path Report in GA4
It's not always easy to impress potential customers in the first interaction. Many customers go through multiple channels before making a purchase.
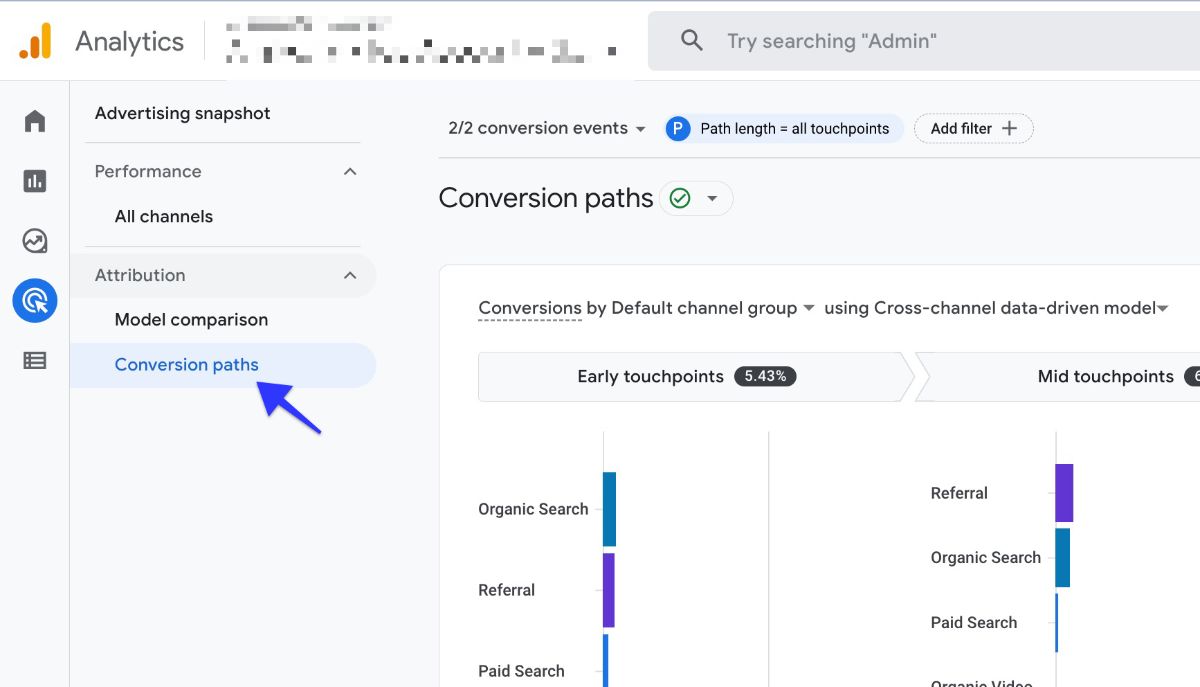
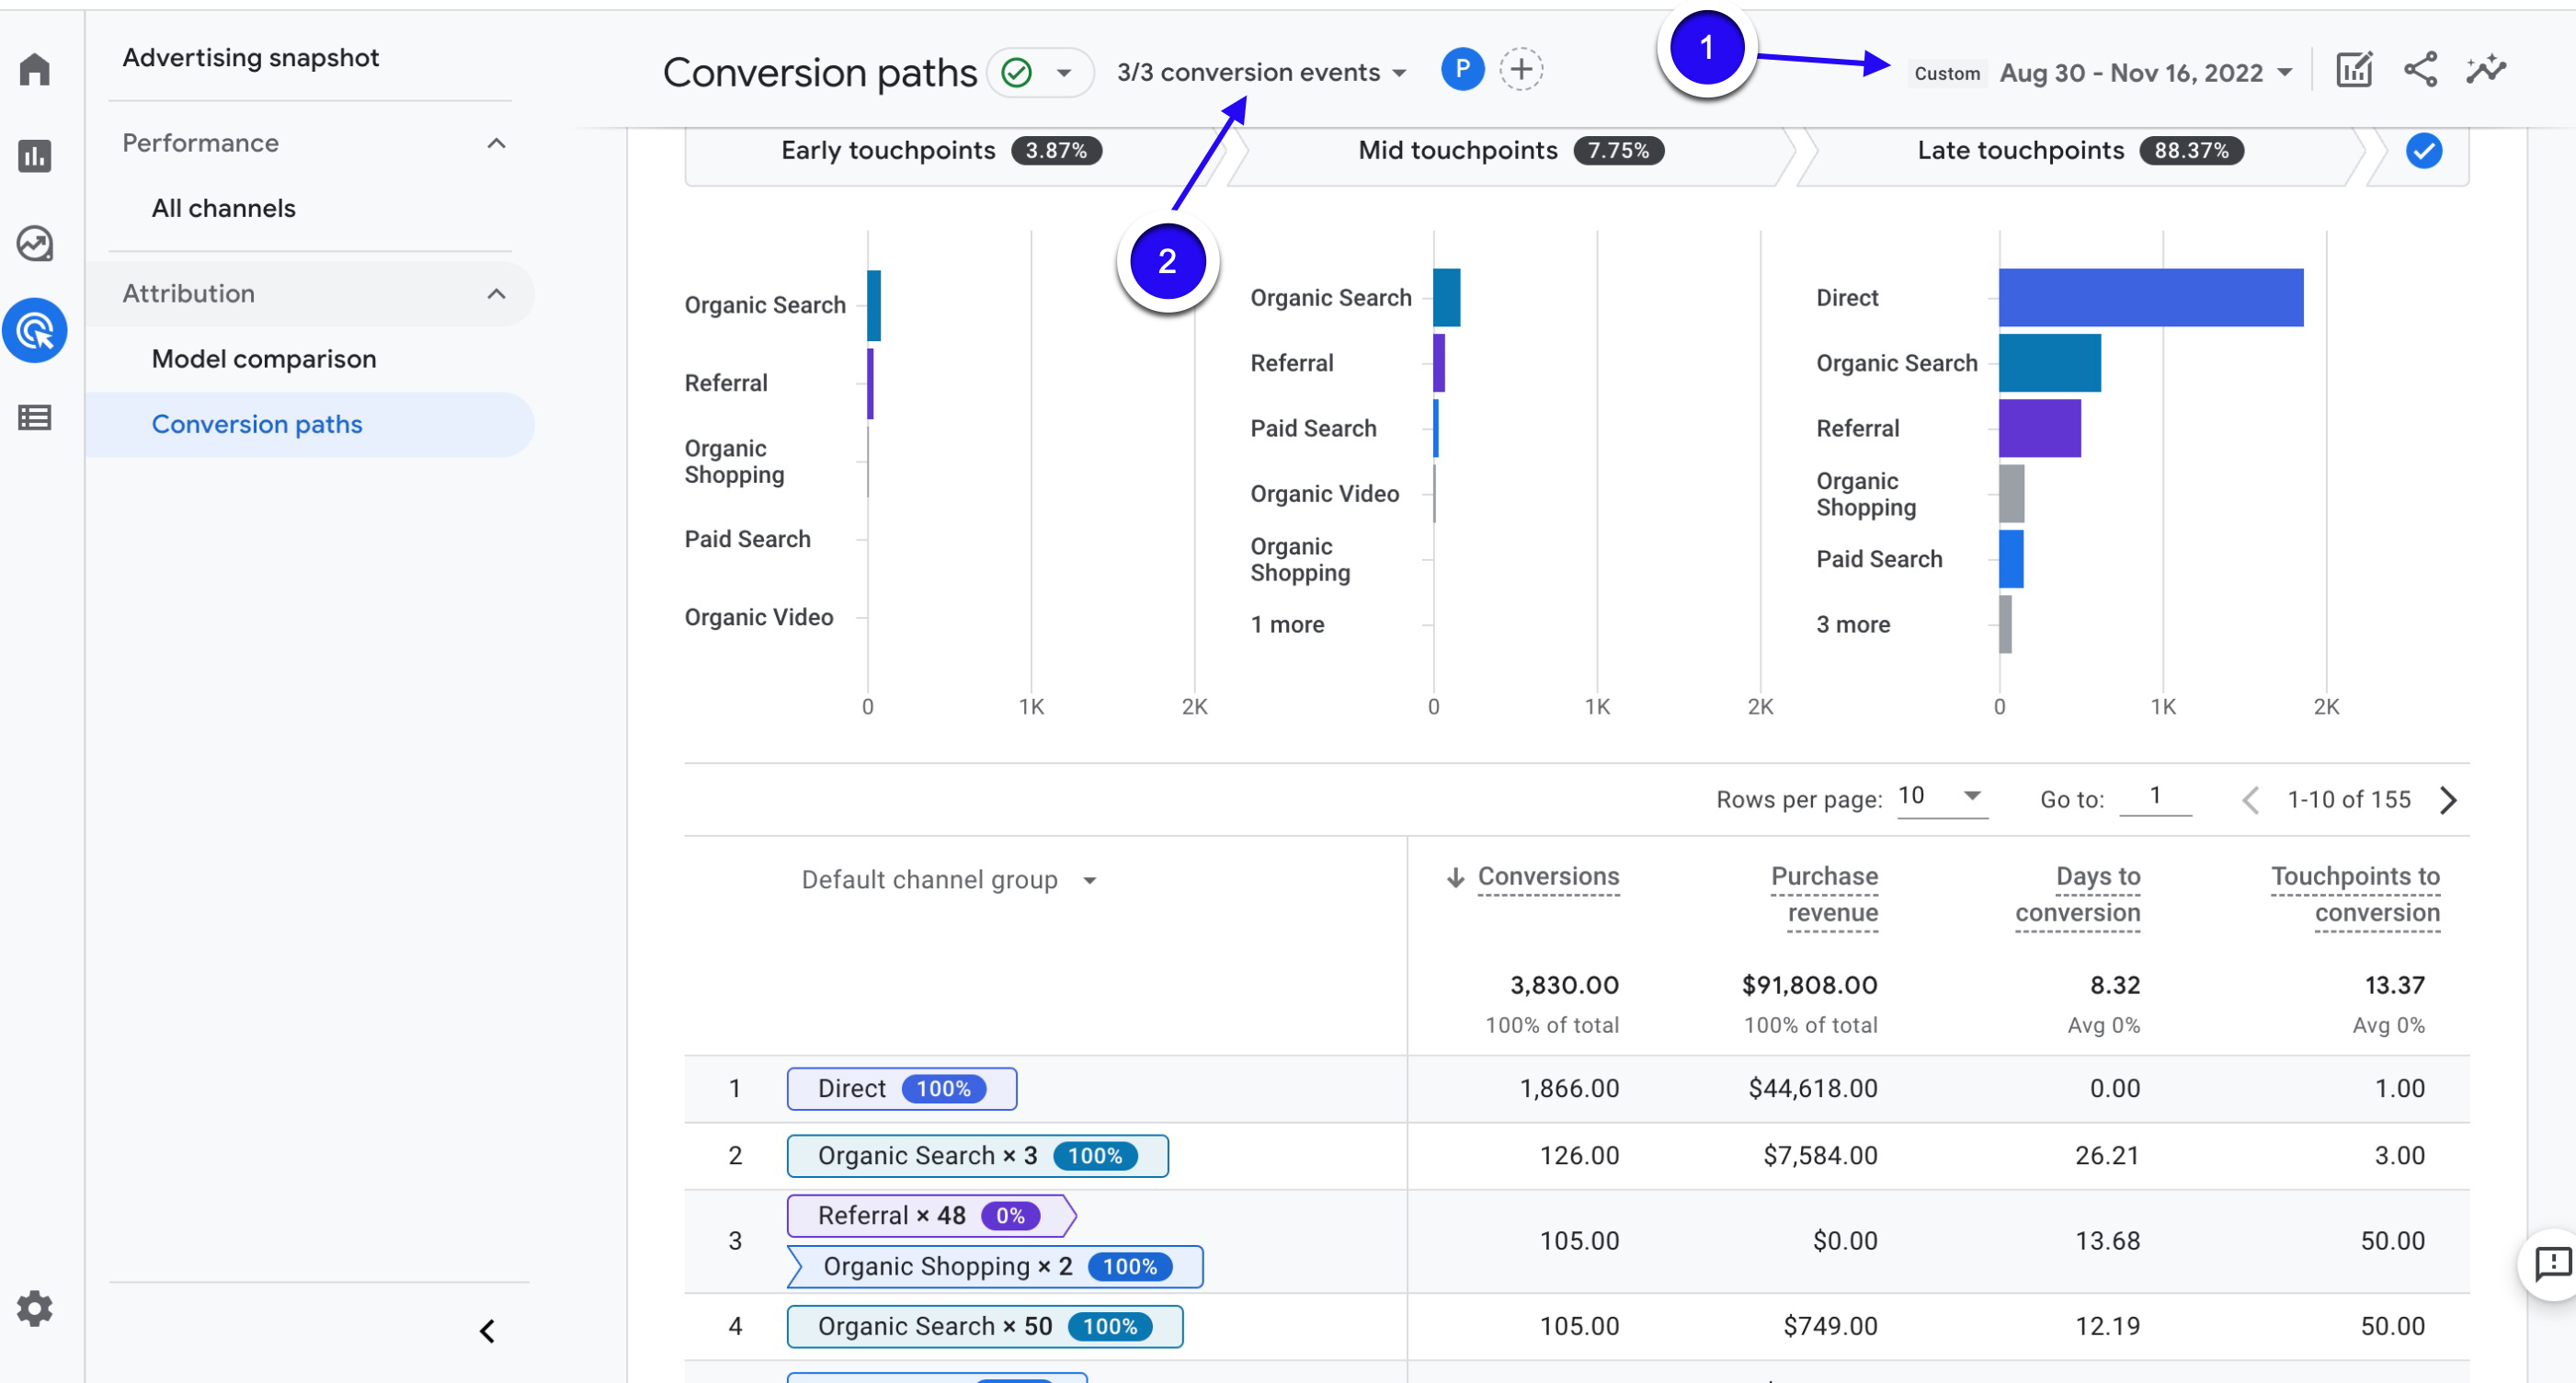
This is also called the funnel or the conversion path. This GA4 report helps you understand and analyze users' conversion pathways.
In this report, you can see some multipliers like "x 2", "x 3", "x 4" etc.
These multipliers represent how many times some users interact with a particular channel.
This means that the user interacted with the marketing channel more than once before making a conversion.
Why should you create a Path Report for Paid Search in Google Analytics 4 (GA4)?
Good PPC specialists must first know their audience well to manage a quality campaign.
You should know the meaning of each step for users and be able to produce solutions that will increase the possibility of conversion in the next step.
Perceiving the channels that users visit on their conversion path will be helpful in strengthening sales prospects.
You can increase your influence rate in these channels by understanding which channels the users interact with after the first click.
How create a Path Report in Google Analytics 4 (GA4)?
You can create a path report and compare the performance of different paths on your website.
To identify which paths are performing well or poorly and discover opportunities for improvement, you should just follow the steps below carefully:
Go to your GA4 account. Then, click on “Advertising” in the left column.
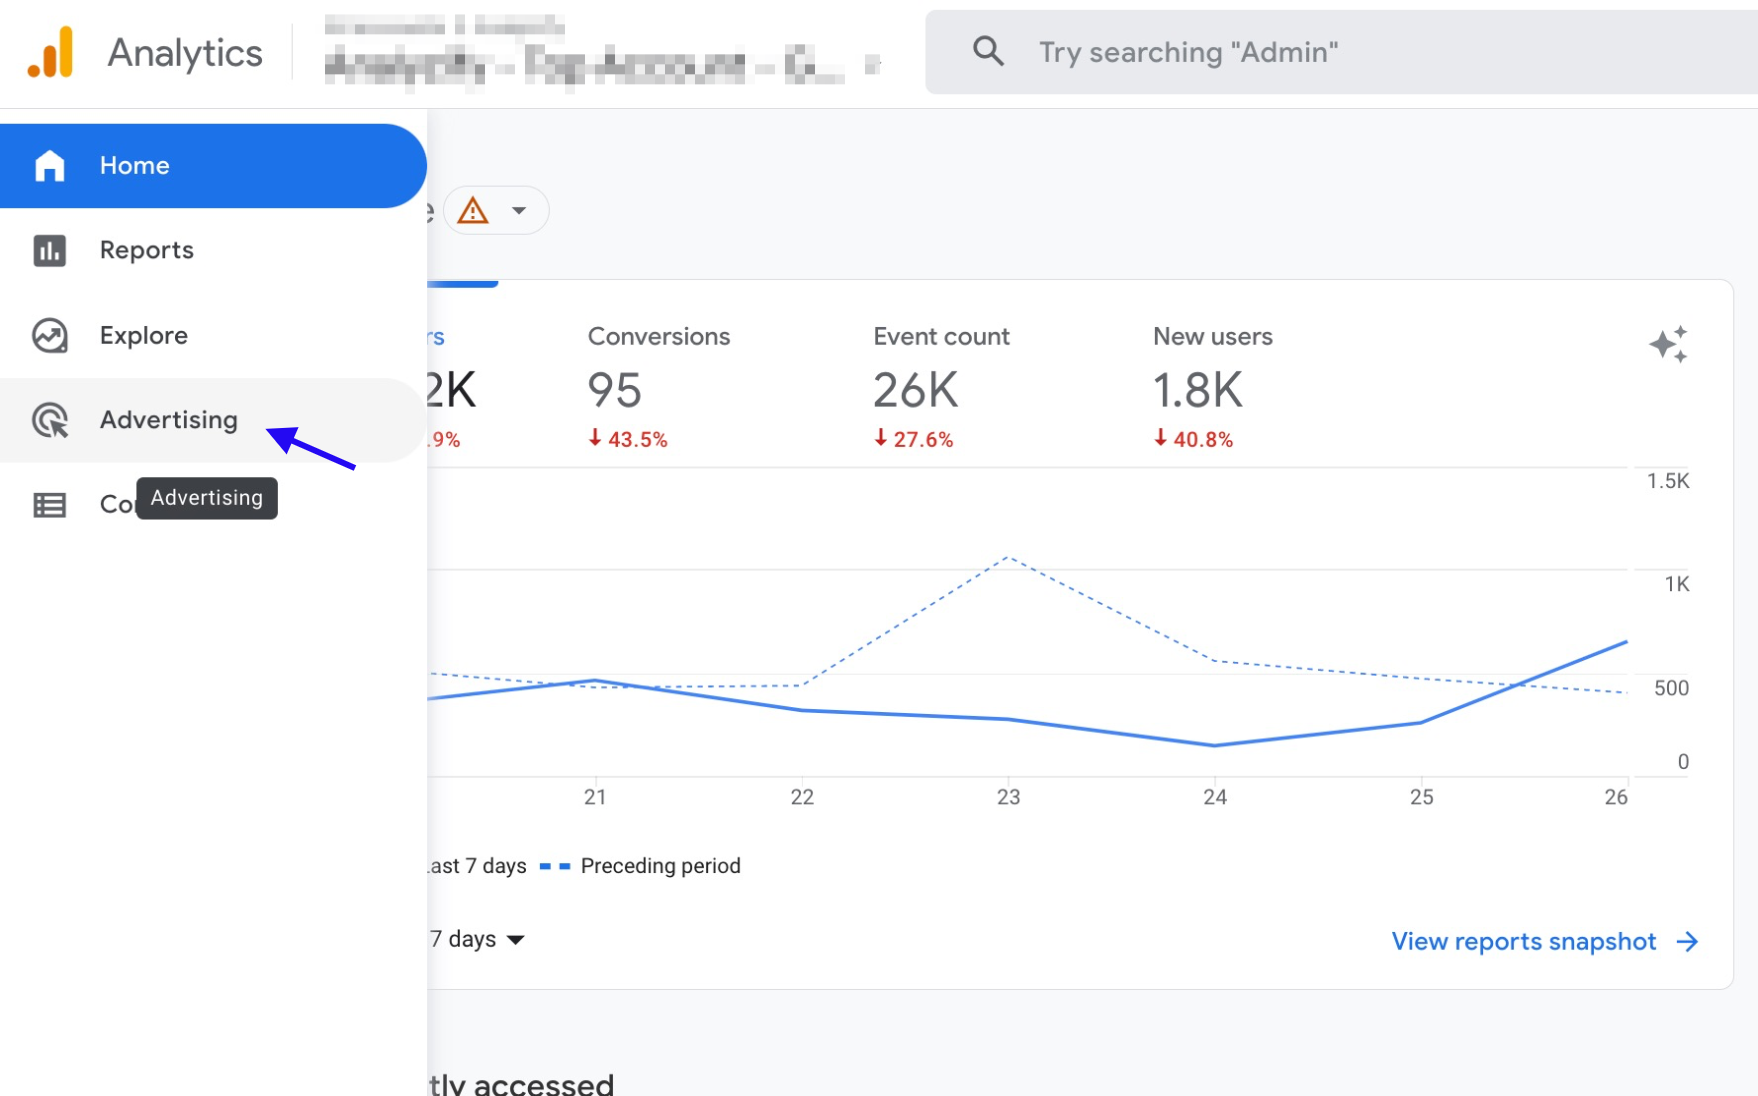
Click “Conversion paths”.
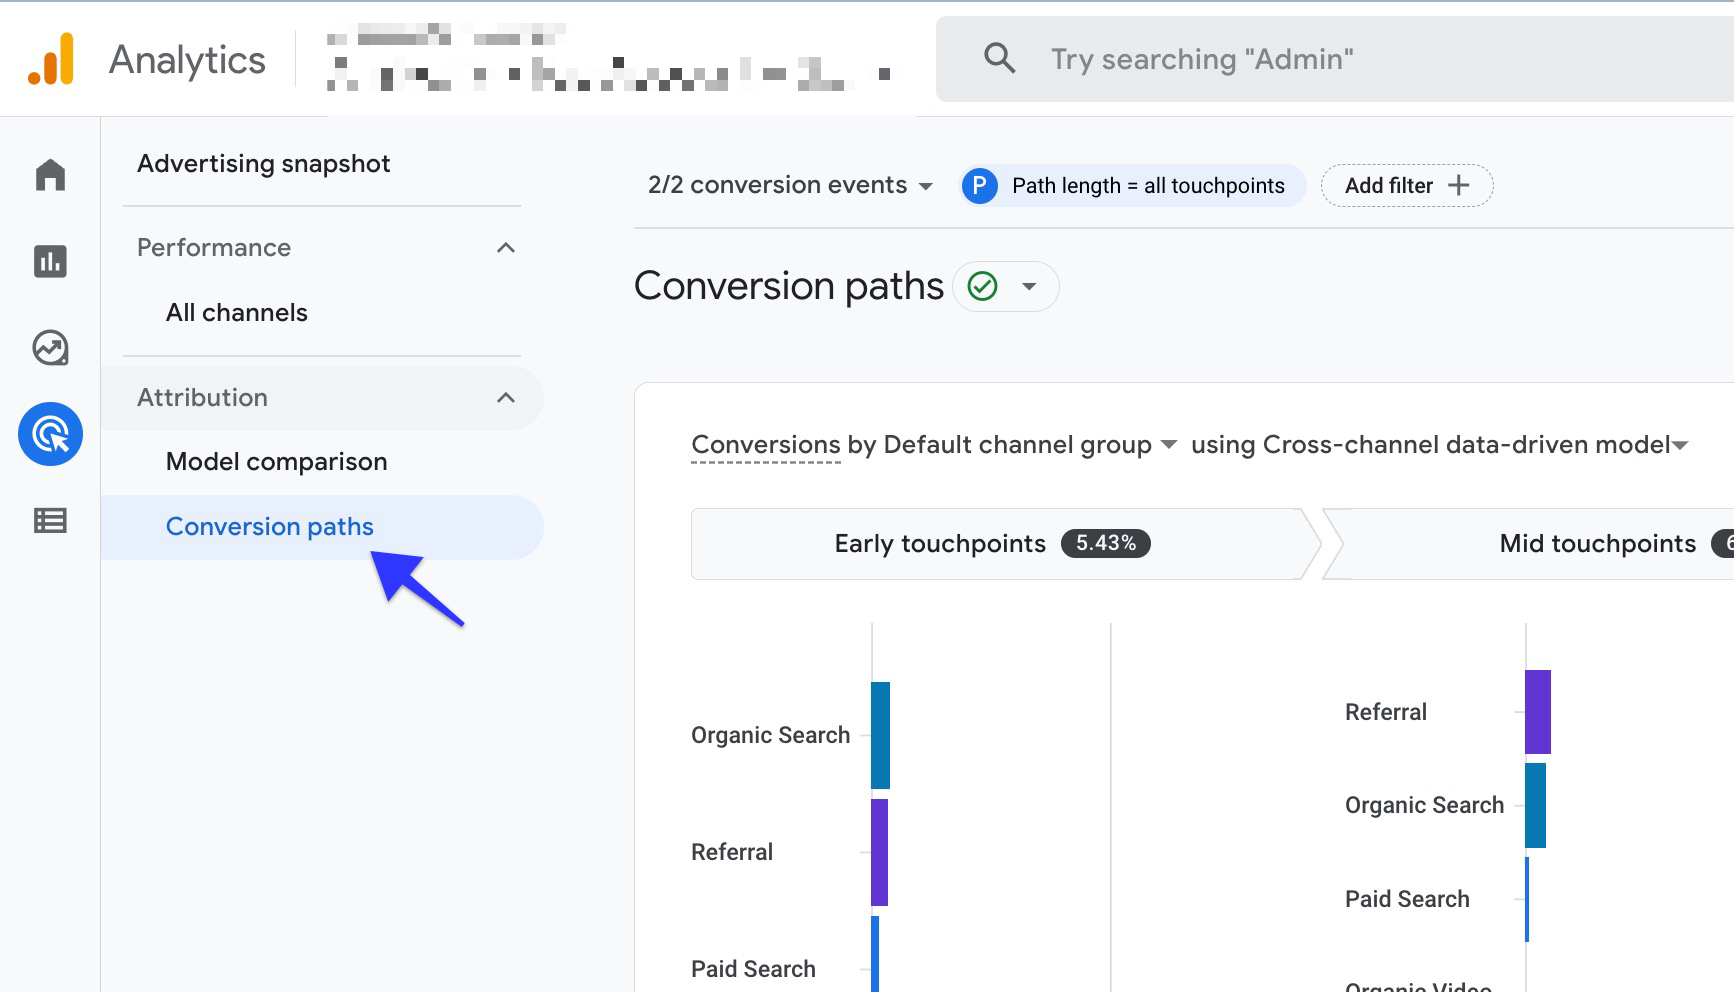
Determine the date range by using the date picker located in the top right corner of the page to compare the conversion paths. Choose one or more conversions from the drop-down menu. Note that by default all conversion events are included in the report.
Google Ads Version:
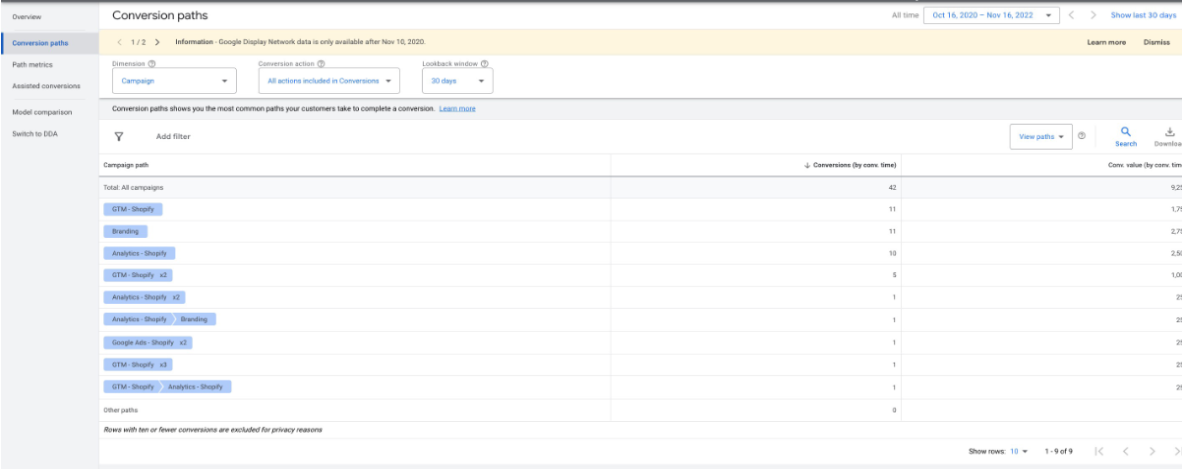
Action Advice:
Analyze the length of users' conversion paths. If this period is longer than you want, you can try to influence users faster by making improvements in the site or referral channels to shorten it.
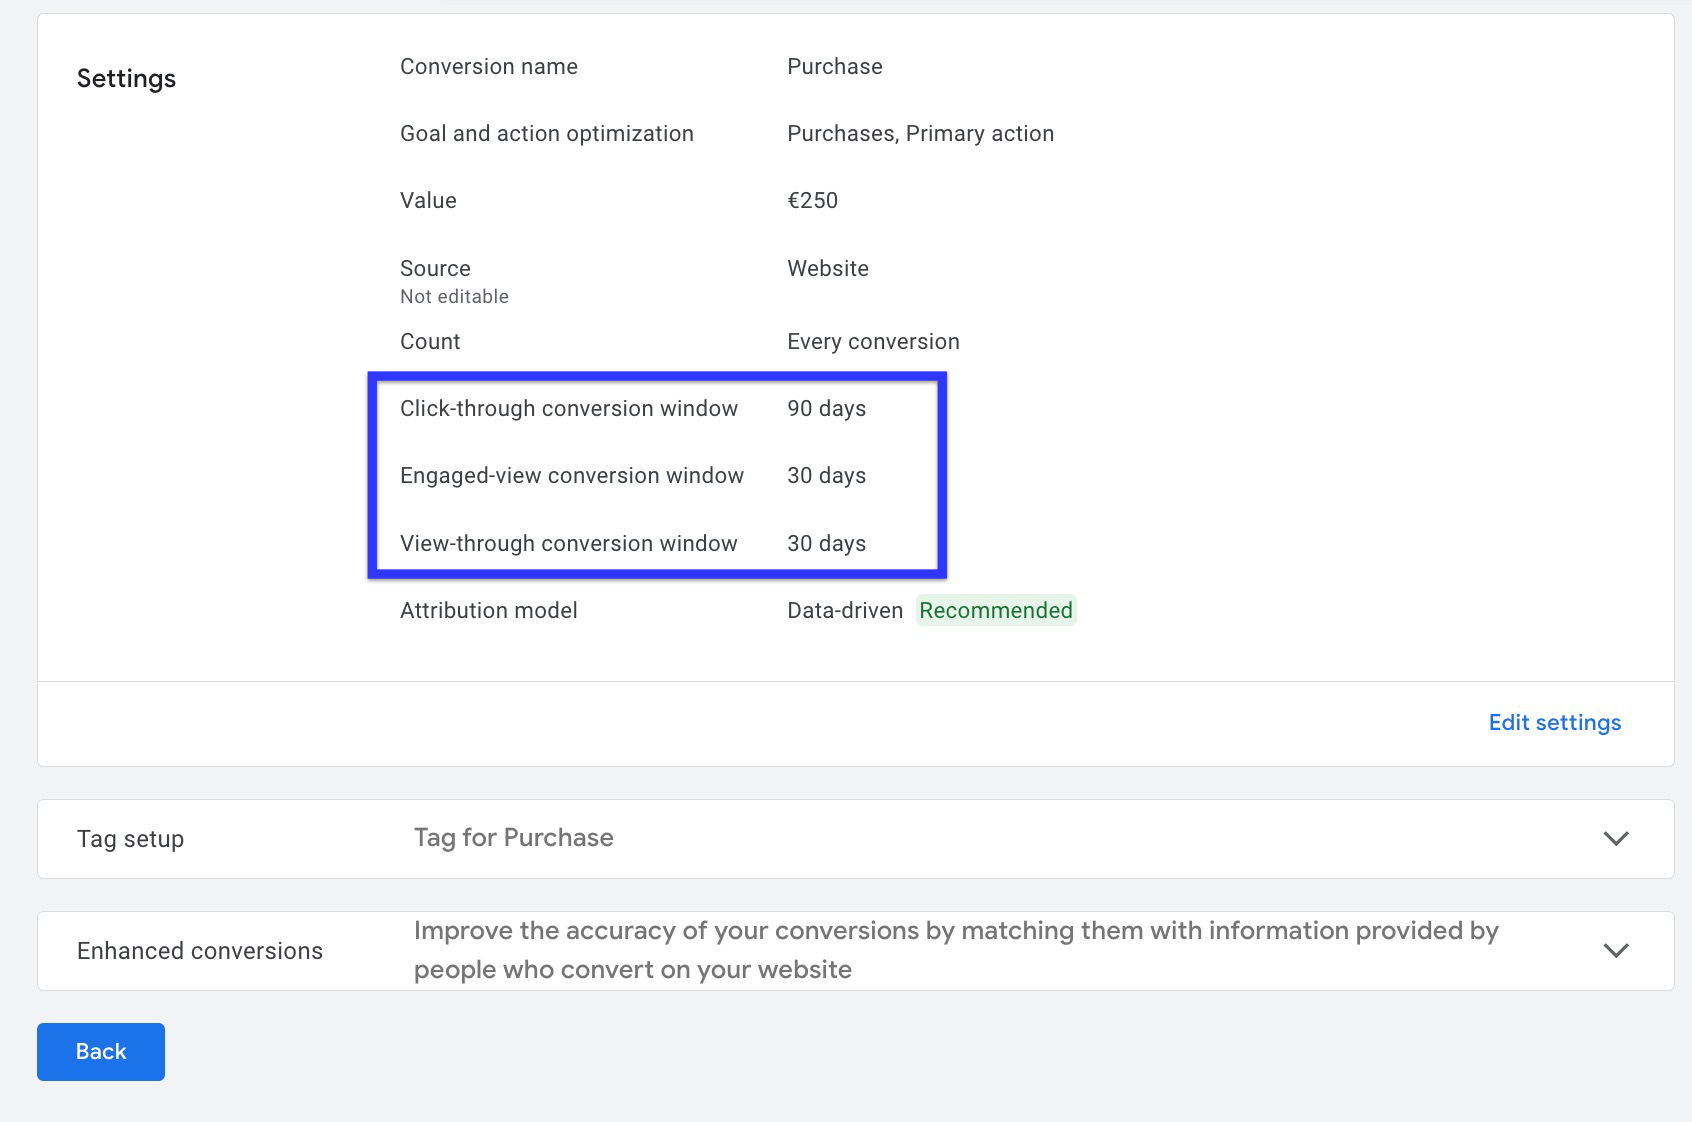
In addition, the times on the conversion path contain useful information for your conversion window settings in your Google Ads account. It allows you to understand how long your conversion cycle takes time. After analyzing the length of time, we recommend that you go to your Google Ads account and update your "Click-through conversion window", "Engaged-view conversion window" and "View-through conversion window" settings.
Getting conversions from users they pay to bring to the site is one of the primary goals for all advertisers. For this reason, it is very important to analyze the conversion paths of users from ad clicks. For example, let's say you notice that users who click on your ad and come to your site interact with referral sources many times during the conversion process. Also, assume that the referral sources they interact with are mostly your social media accounts. In this case, you can make improvements to your social media accounts and content to influence users more quickly. From another point of view, this data shows us that users use social media frequently. Then you've already found your second output: Social media ads. You can create social media ads or optimize your existing advertising campaigns with the light of this data.
7. Attribution Model Comparison Report in GA4
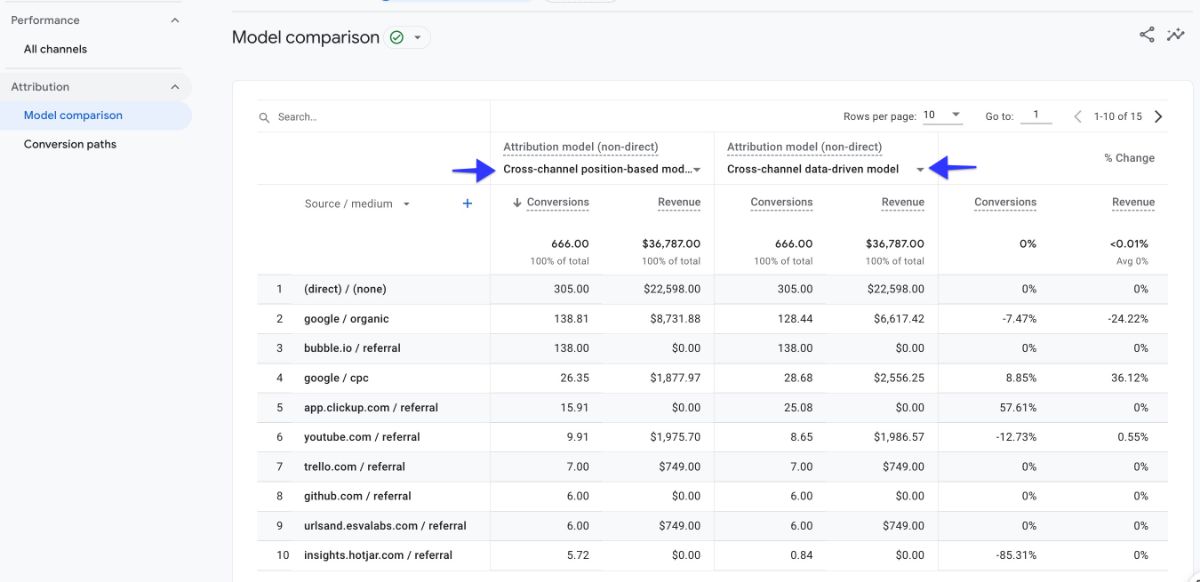
The model comparison report in GA4 allows different attribution models to be compared.
It provides you with the opportunity to compare the differences between the attribution models in terms of the number and value of conversions with the data.
Why should you create an Attribution Model Comparison Report for PPC (Paid Search) in Google Analytics 4 (GA4)?
Conversion tracking is highly important for measuring return on investment and forms the basis of frequently used Google Ads automated bid strategies.
In other words, it is vital to transmit accurate and consistent data to the machine learning system in order to improve campaign performance and get efficient results from ads.
As data discrepancy/difference is always possible, which might stem from attribution model differences, you should be careful about attribution models.
The selected attribution model gives different credits to the channels on the conversion path, and there may be differences in the conversion numbers and conversion value.
By choosing the most suitable attribution model for your business's sales profile, you can ensure that your data is more accurately reflected in your campaigns.
How to create an Attribution Model Comparison Report in Google Analytics 4 (GA4)?
Follow the steps below and create an attribution model comparison report so that you can compare the results of different attribution models, which helps you to secure more accurate data in your campaigns to have a better idea about how they are performing.
Go to your GA4 account and click on “Advertising” in the left column.

Choose "Attribution" and then select “Model comparison”.
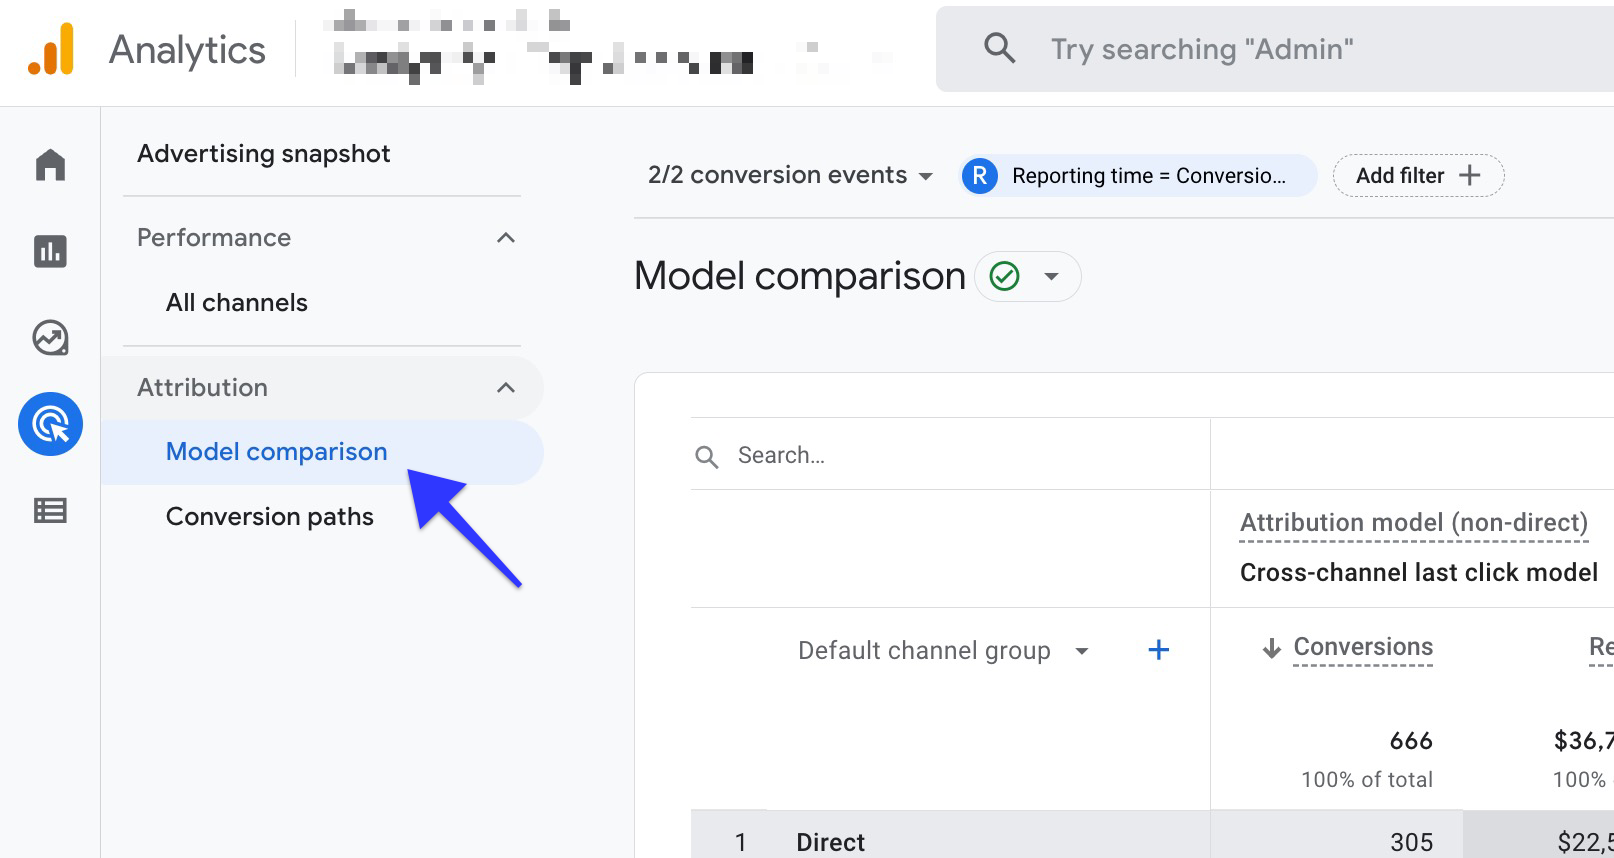
From the dropdown, choose “Session Source/Medium”.
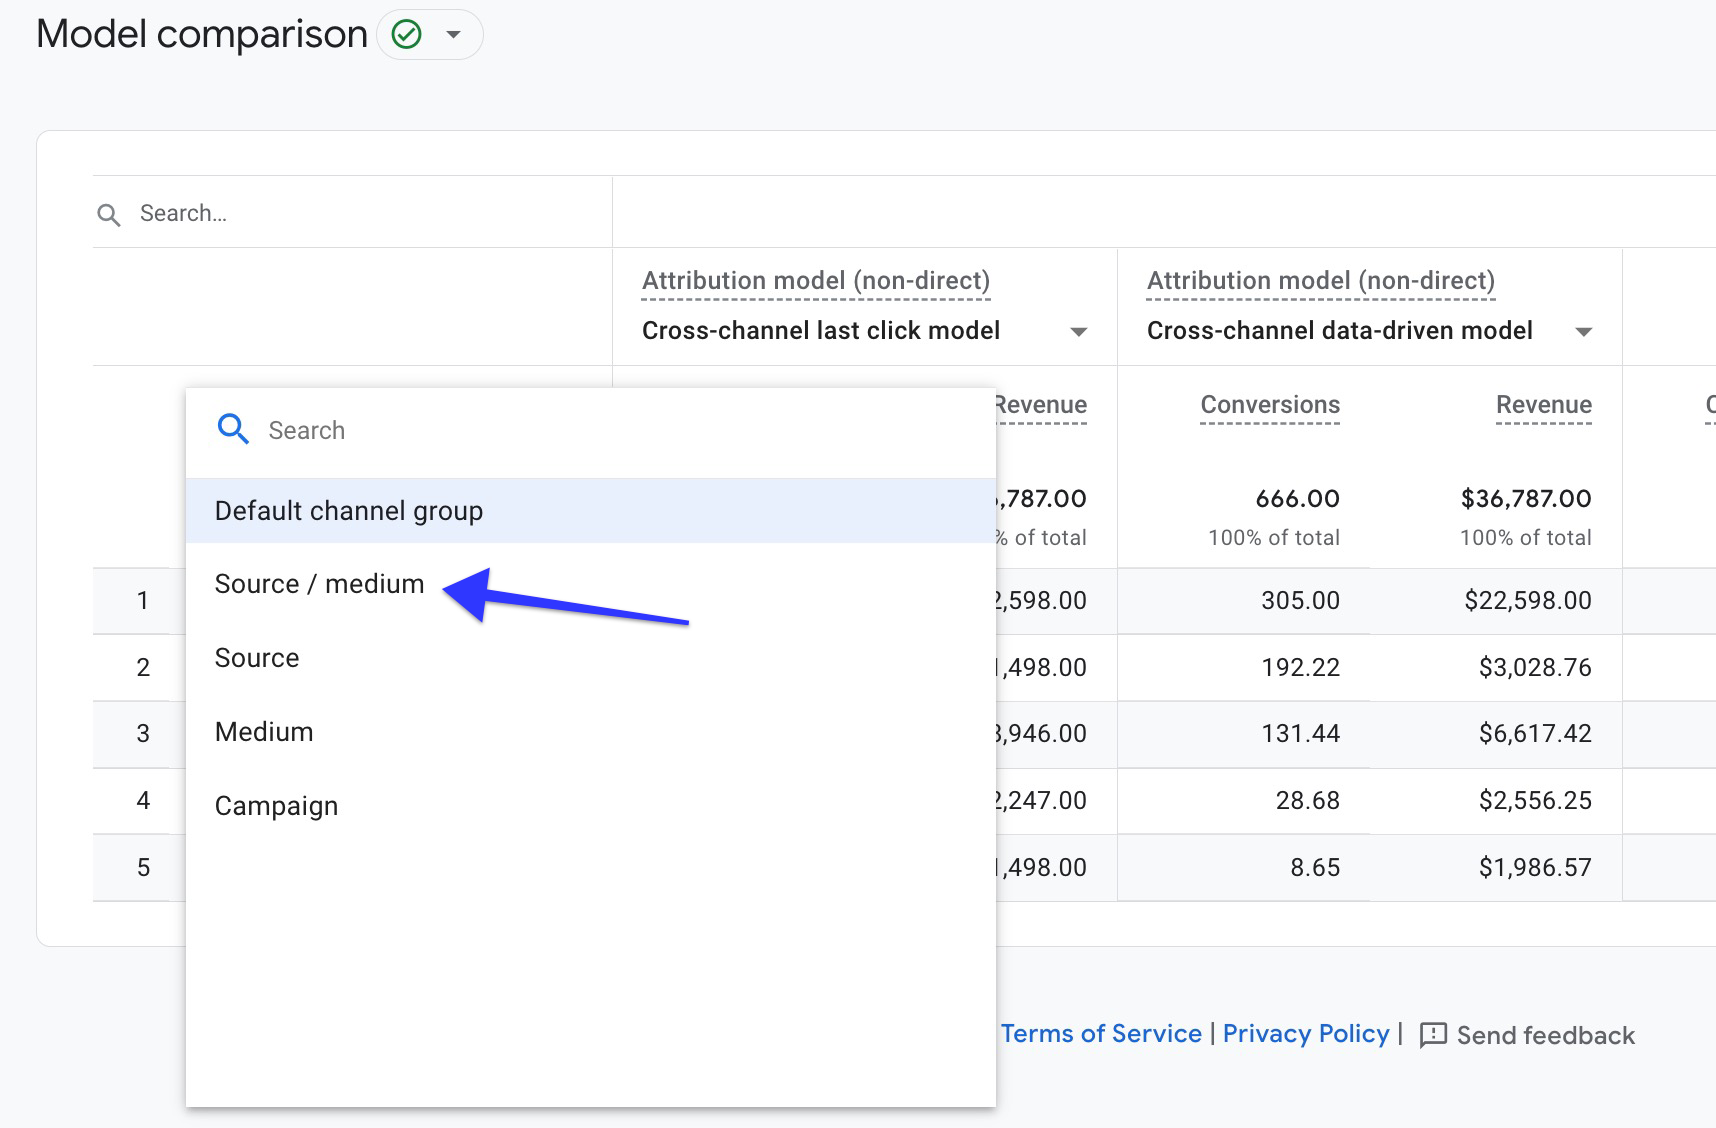
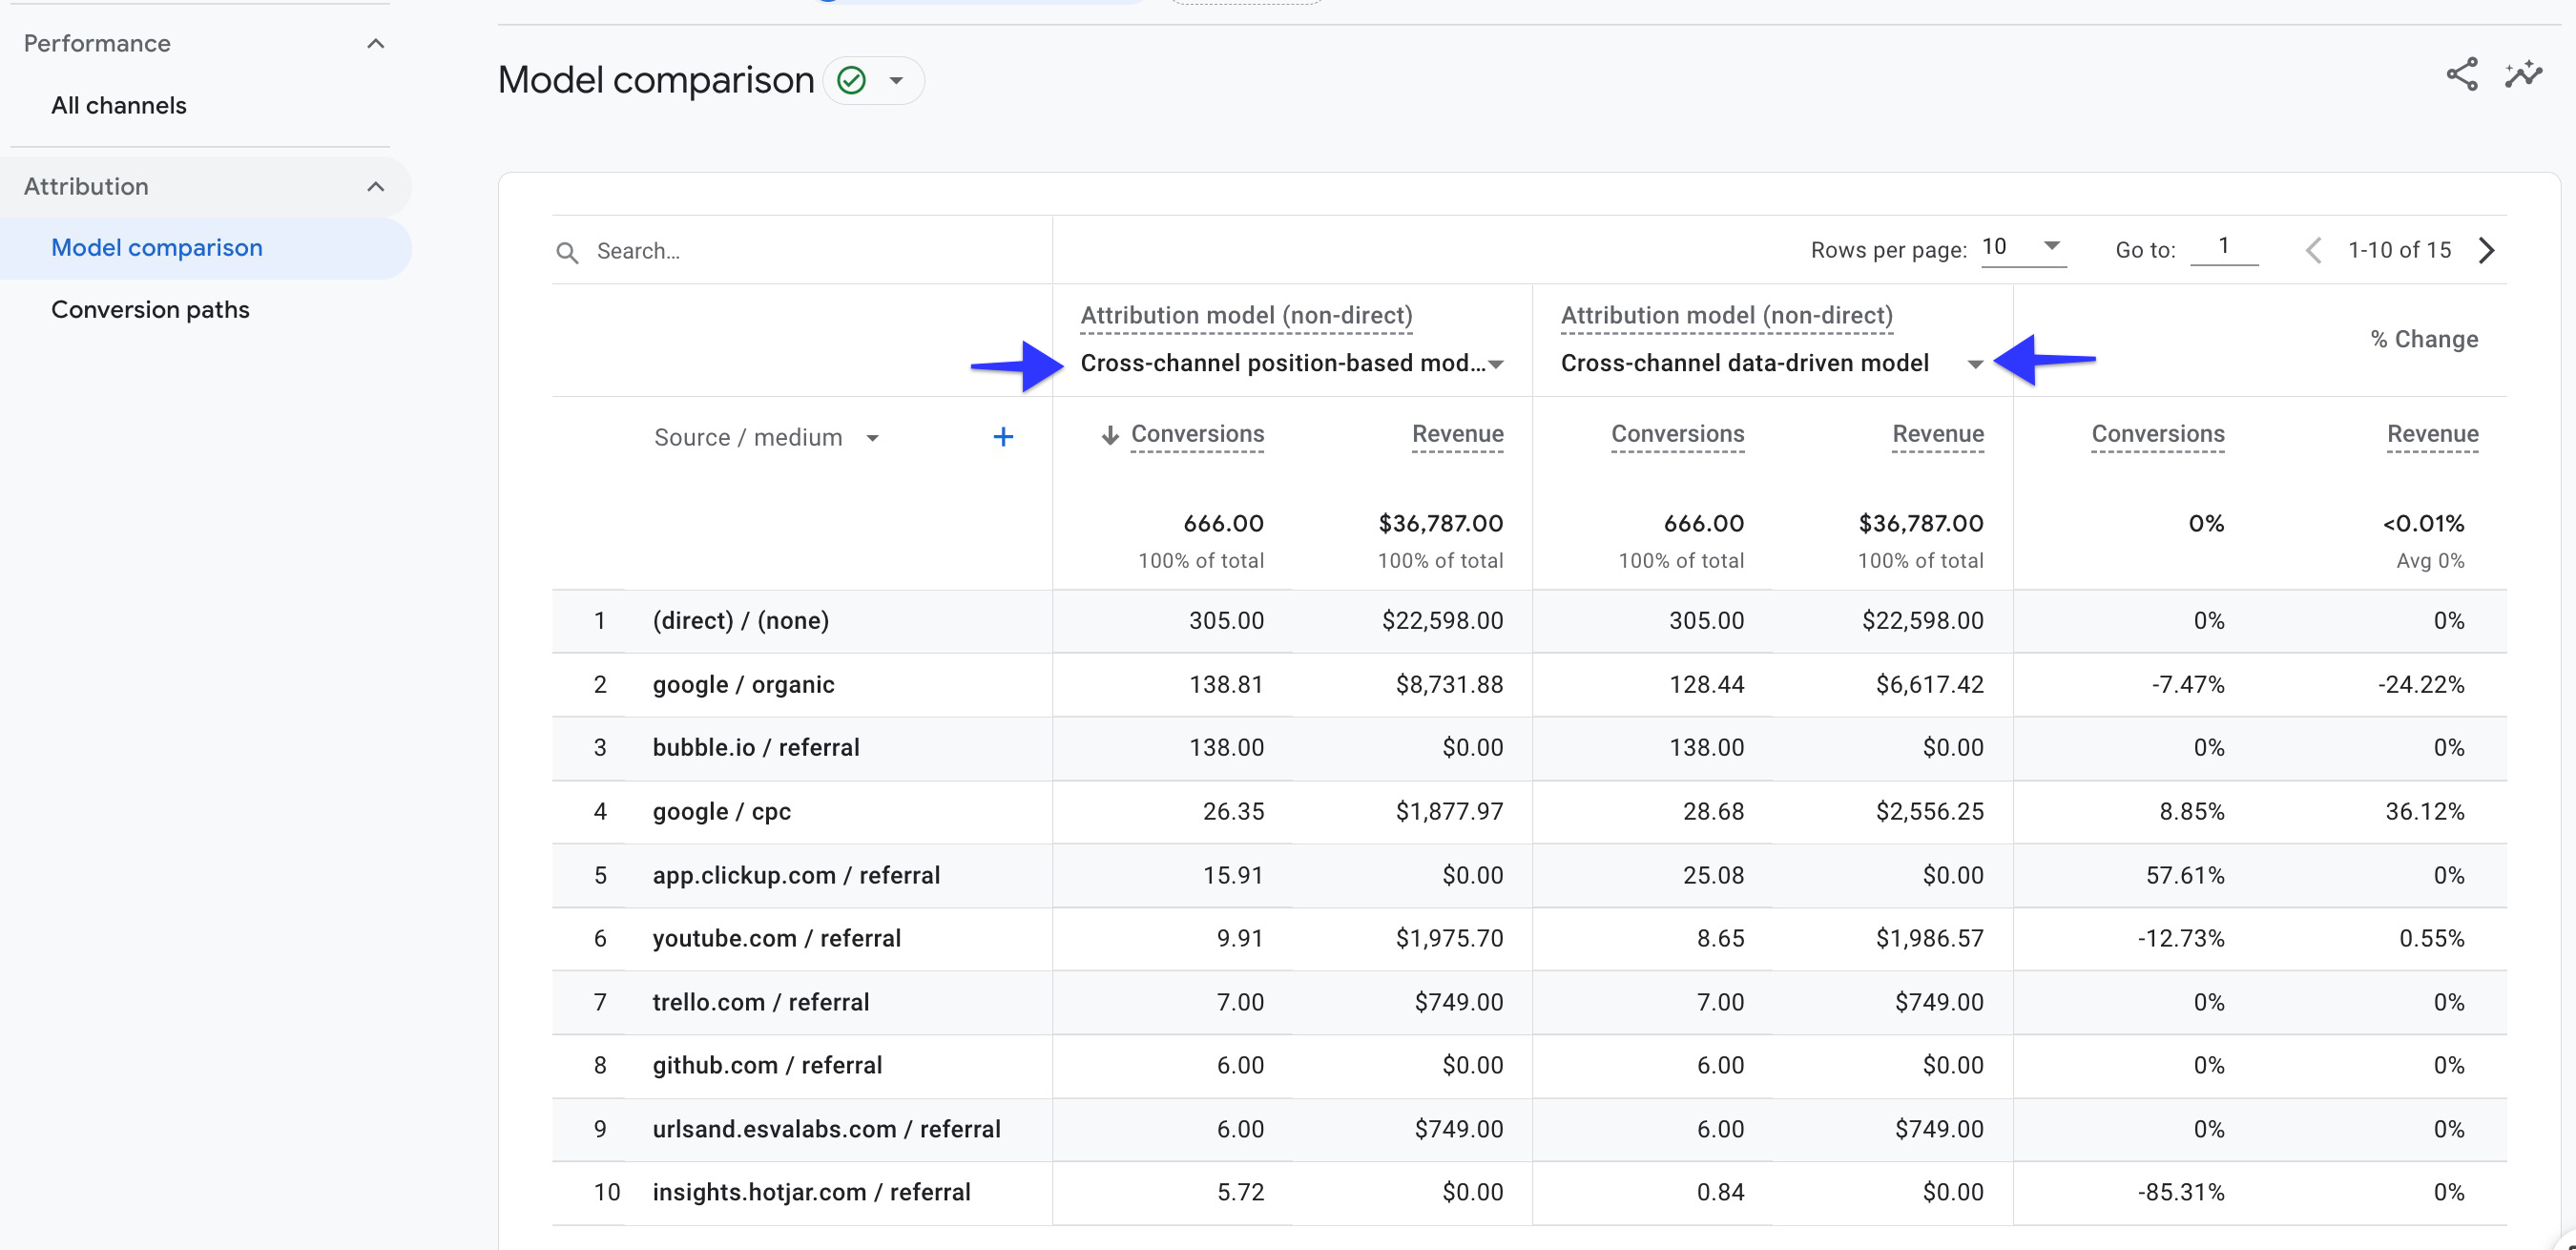
Select the attribution models you want to compare. Customize your report by adding a filter or changing the reporting time.
Google Ads Version:
Action Advice:
If you have multiple marketing channels, it would be more beneficial to choose advanced attribution models. We recommend using the "position-based" model in newly opened conversions for a while, then you can change this model when you have a large amount of data.
You can read this article to get more detailed information about attribution models and to learn our best practice suggestions.
Conclusion: Understanding PPC (Paid Search) Reports in GA4
Google Analytics 4 offers PPC reporting capabilities that can improve your campaign performance.
By using these seven key reports – Location, Hourly, Search Term, Landing Page Analysis, Referral, Conversion Path, and Attribution Model Comparison – you can make decisions that increase your return on investment.
