Explore allows you to analyze customer behavior and obtain numerical & visual insights in GA4. Here, you can:
- see the data in detail
- find more relevant data with filters and segments
- create audiences
- monitor email campaigns and traffic
- share data with other GA4 users
Explorations is subject to the following limits:
- You can create up to 200 individual explorations per user per property
- You can create up to 500 shared explorations per property
- You can apply up to 10 segments per exploration
- You can apply up to 10 filters per tab
To create your reports, click 'Explore' on the left menu:
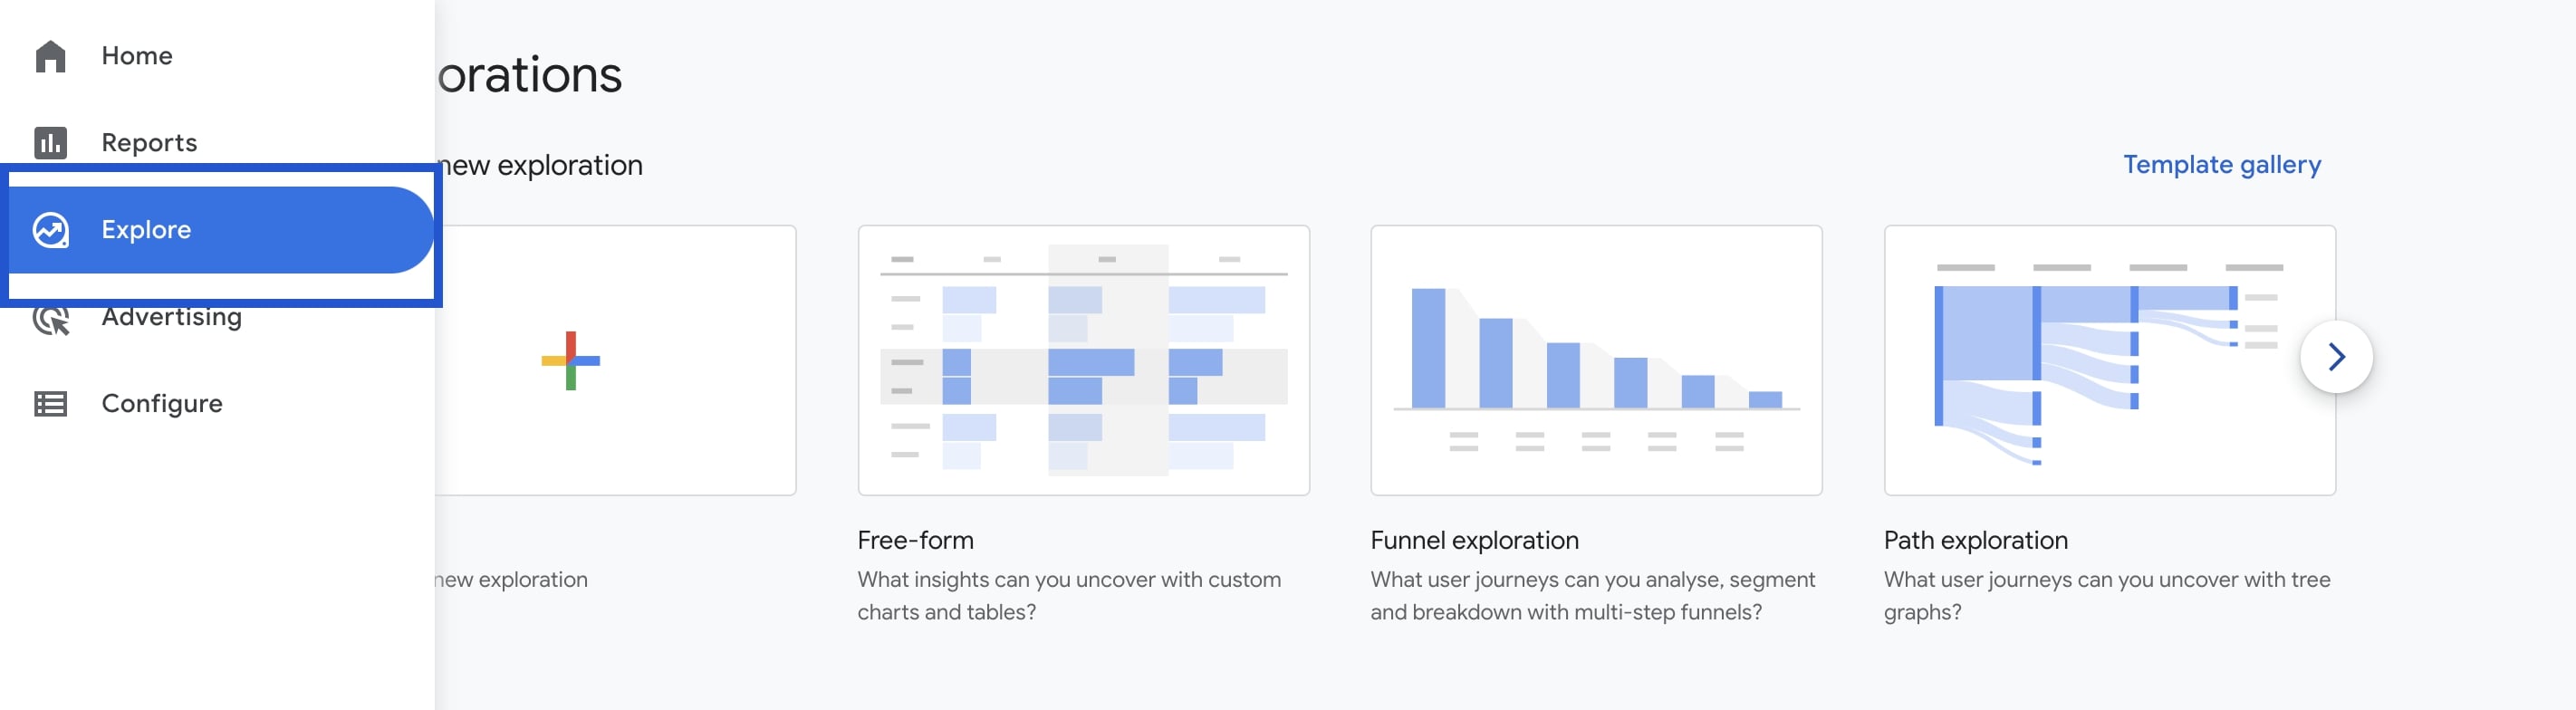
Here, you are presented a blank report and some template reports.
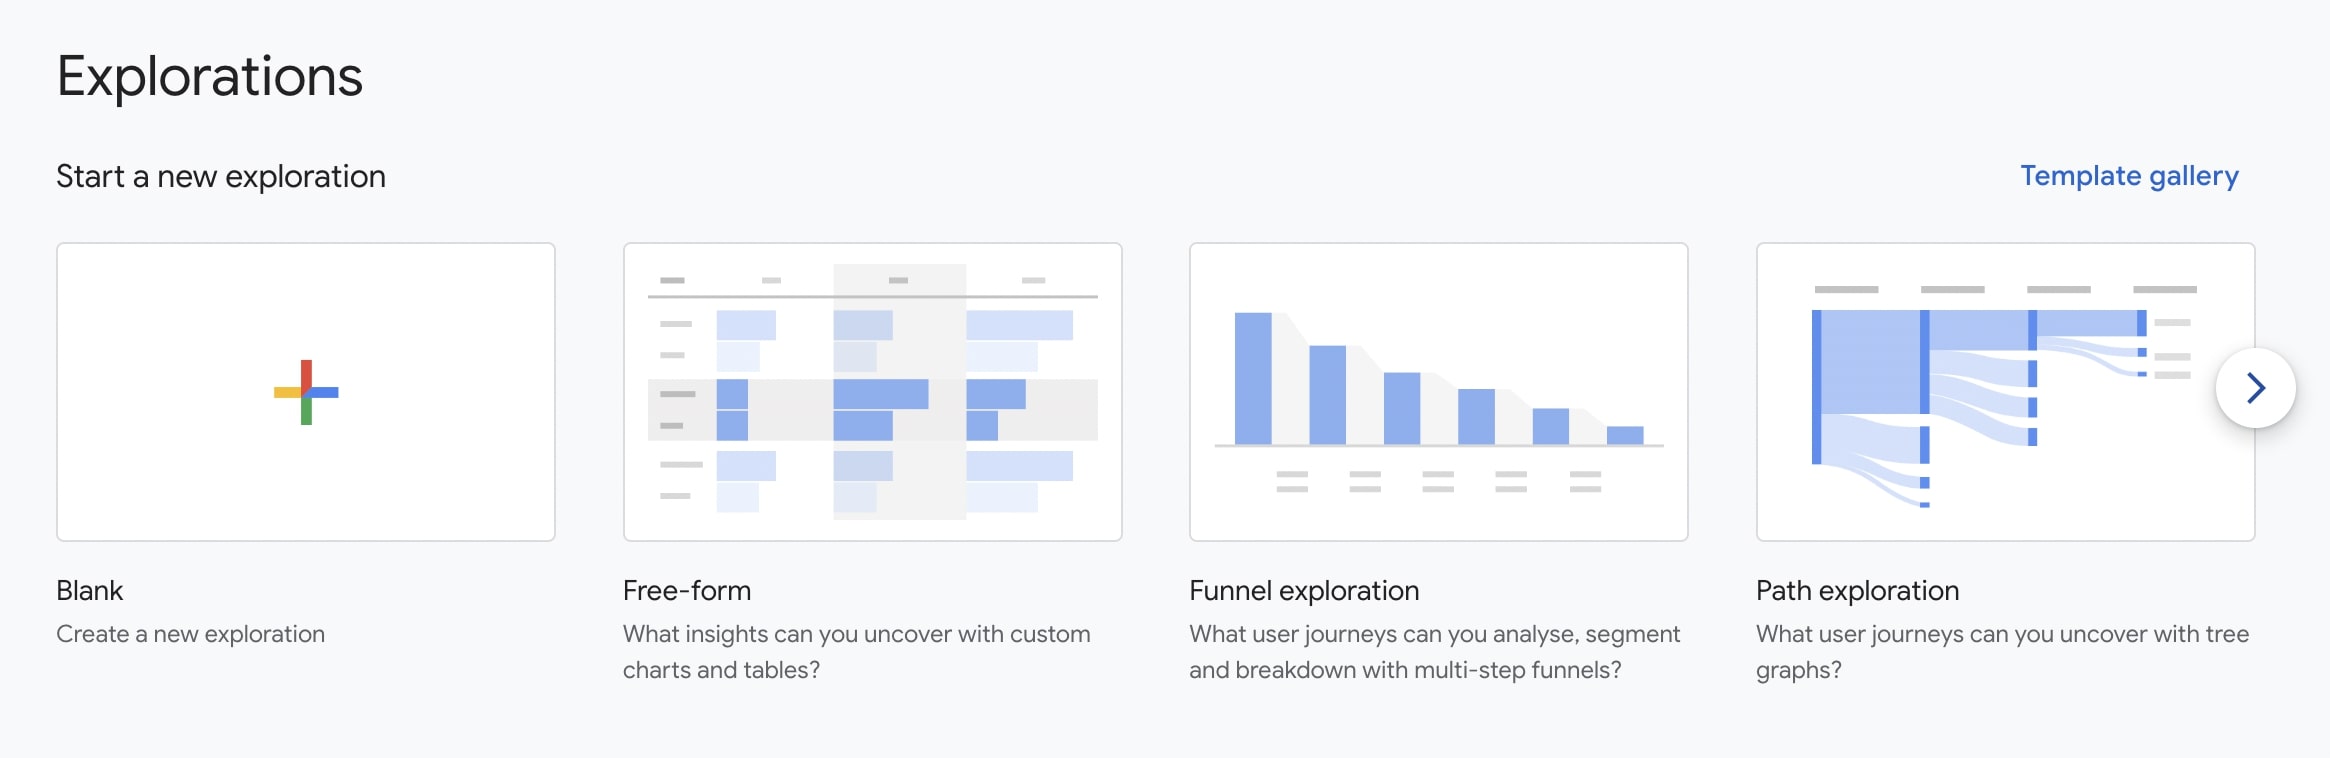
Blank Report
Blank Report is a report that does not contain any sample or data.
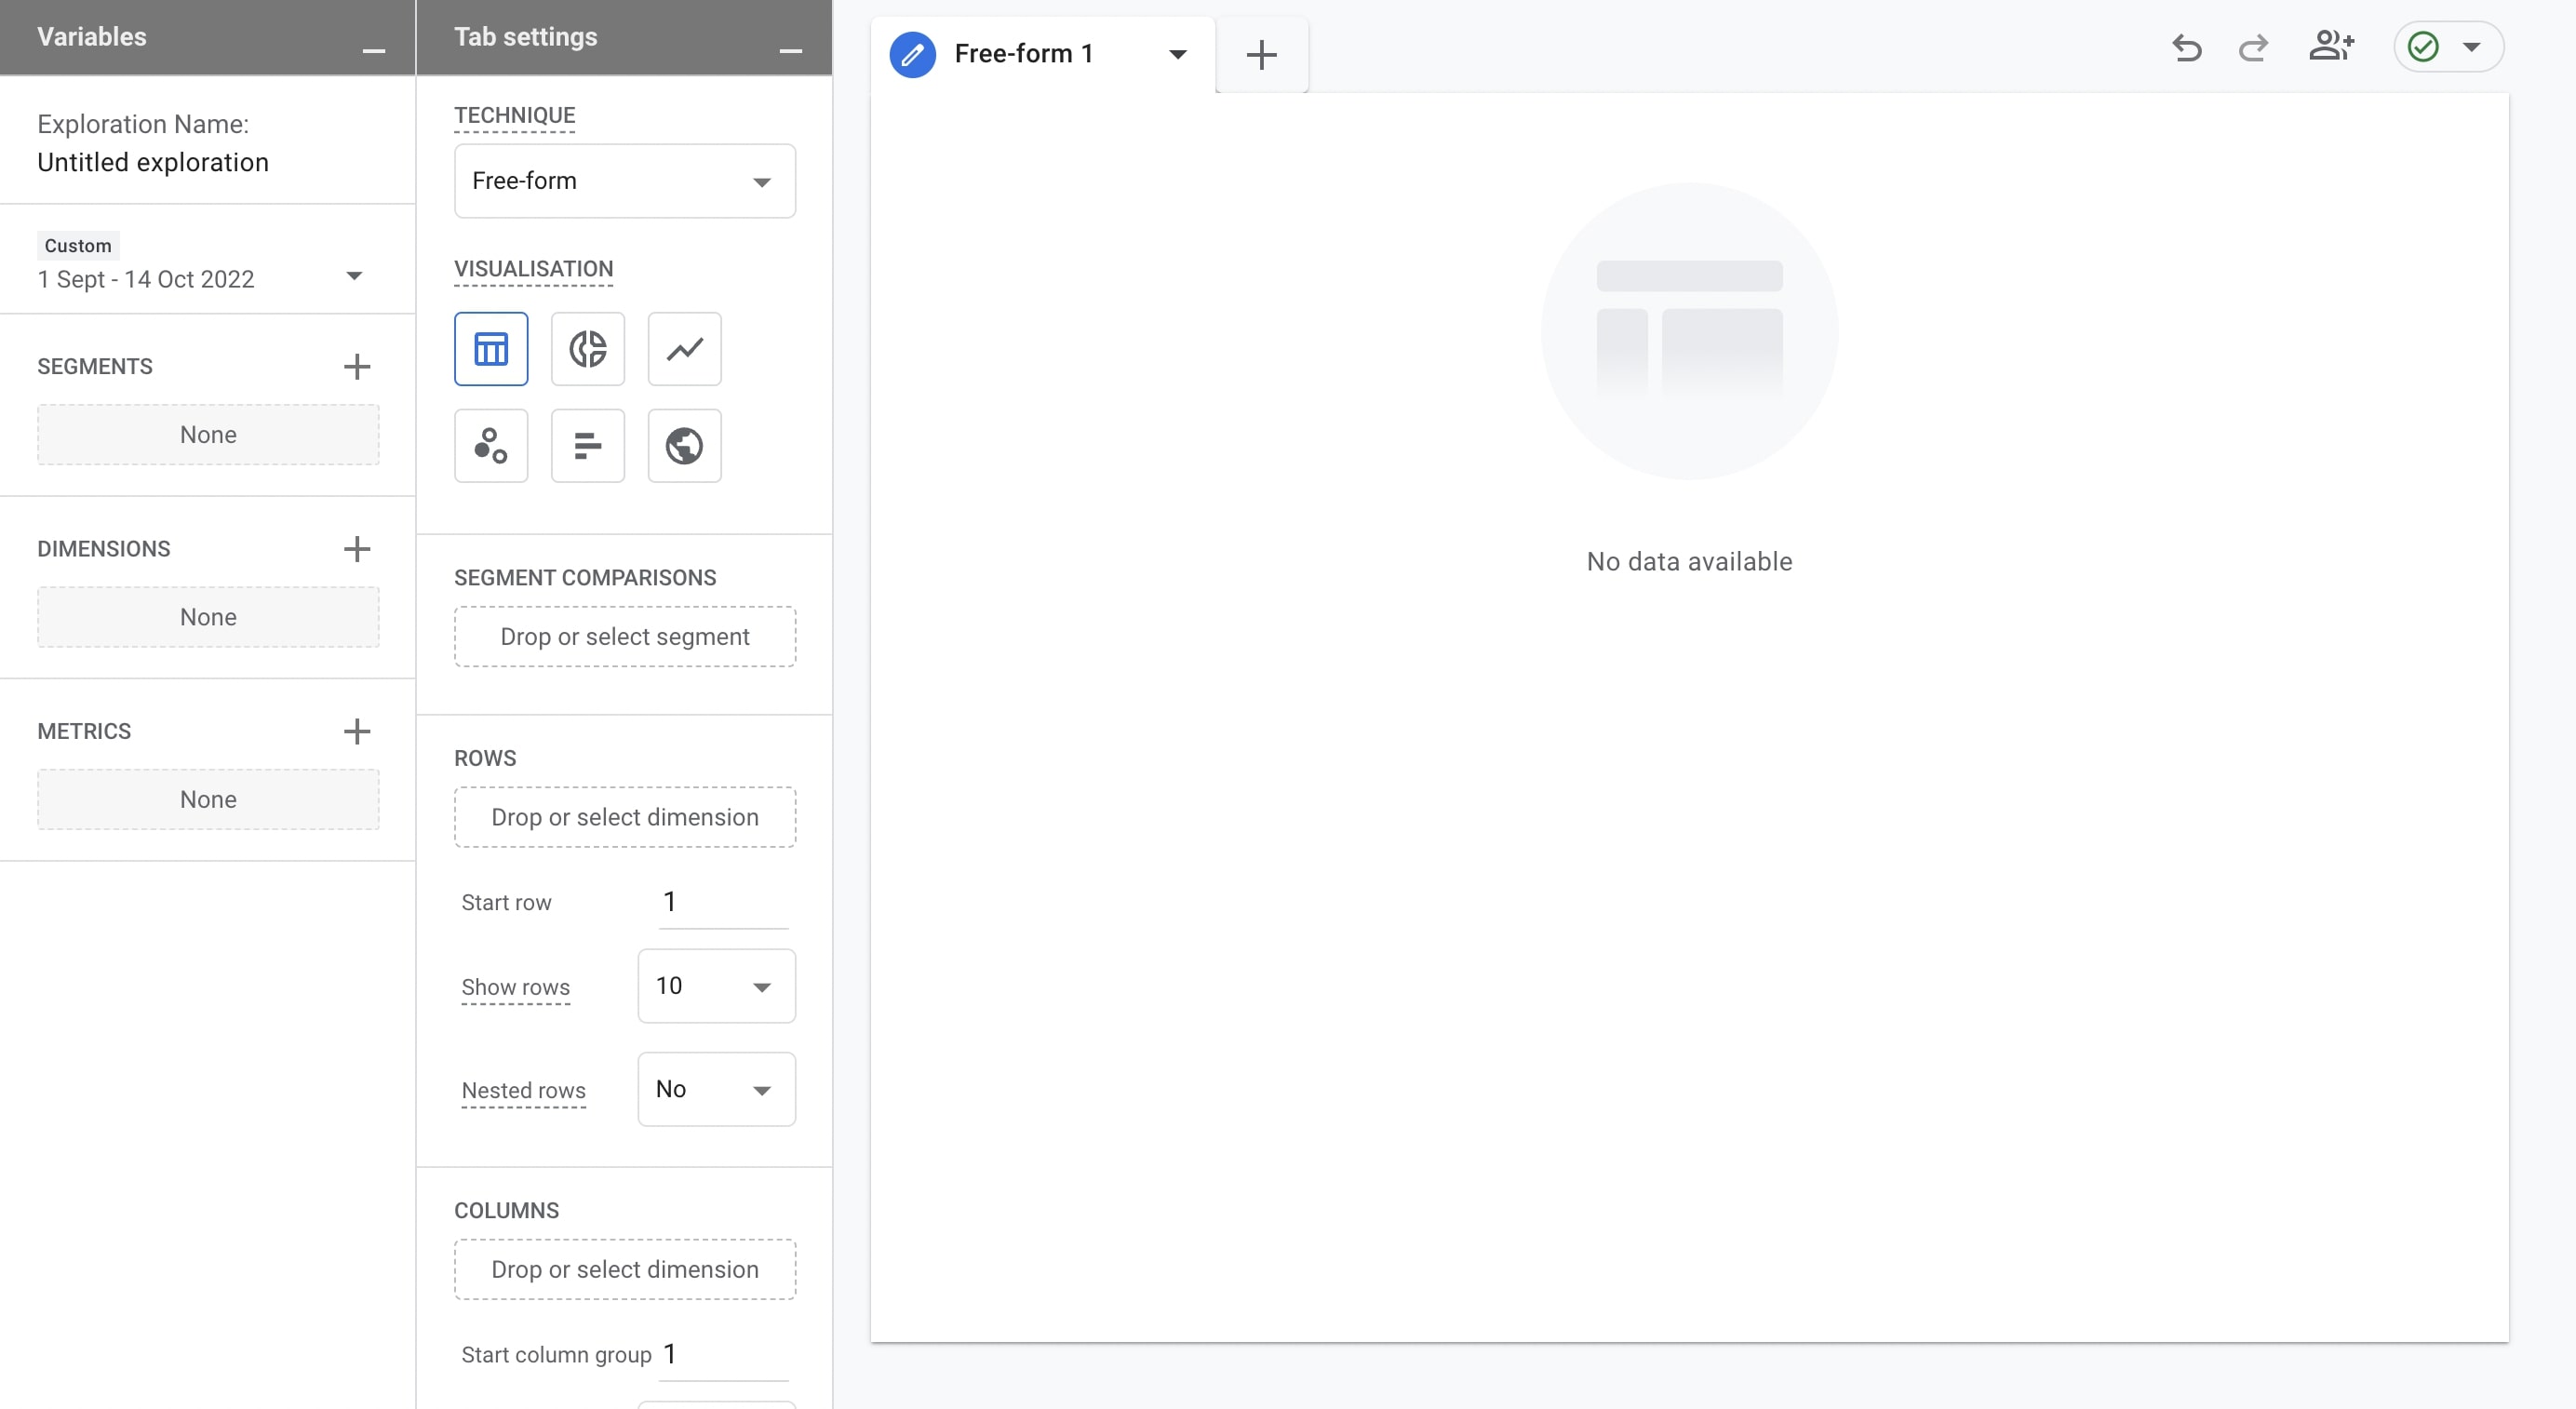
If you examine the fields in this report, you will discover the following:
- Variables is a field where you add data types. You can get this field below by clicking the '_' sign.
- The Exploration name field is where you add the name of the report.
- Through Custom, you can select the date whose data you want to see.
- Segments are subsets of users. To apply a segment, double-click it, or drag and drop it from variables into Tab Settings. To create a new segment, click Add new item icon.
- On Dimensions, you can add the things you want to analyze as a dimension. Add dimensions to the Breakdown area in Tab Settings.
- Metrics provide the numbers in your report. Add metrics to the Values area in Tab Settings.
On Tab Settings: - You choose the technique and visualization of the report. In addition, you should add the data you selected in the Variables field to the relevant places by dragging them here.
- You also set which reporting technique to display your data along with which sort of visualization to display such as Table, Doughnut chart, Line chart, Scatter plot, Bar chart, and Geo map.
- Segment Comparison allows you to move the segment you create in the Variables. - Drag dimensions from the variables panel, or click the drop target to select them from the list to add rows. You can set the starting row, determine how many rows to display and display dimensions in a nested hierarchy.
- To add a column, drag dimensions from the variables panel, or click the drop target to select them from the list. You can set the starting column and choose how many column groups to be displayed.
- Values is where the metrics that provide the numeric data for the current visualization are migrated. You can change the display of metric values in table visualization.
- You can use filters to focus on the dimensions and metrics that are most important to you.
- Tabs display your visualizations. An exploration can contain up to 10 visualizations. To add a new tab, click + icon. You can undo and redo changes, export data, and get additional information about exploration.
Template Gallery
Template gallery includes different types of readymade reports. There are 3 main types of reports. These are Techniques, Use cases, and Industries reports.
Techniques
Free Form
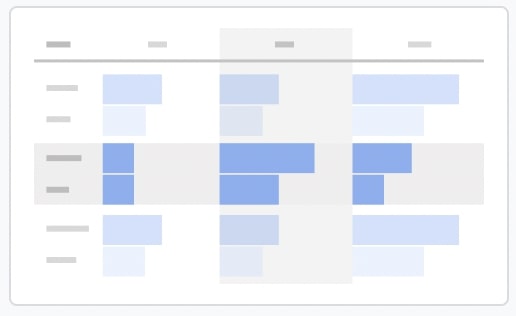
It offers customizable and flexible reporting so you can perform detailed data analysis using the free-form exploration technique. Here:
- A table or graph can be used to visualize data
- The rows and columns of the table can be arranged as desired.
- Multiple metrics can be compared side-by-side
- Nested rows can be created to group data.
- Freeform exploration can be refined using segments and filters.
- Segments and audiences can be created from selected data.
Funnel Exploration
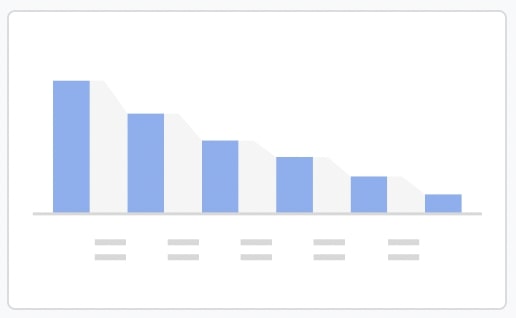
Funnel exploration allows you to visualize the steps your users take to complete the events you have set as tasks on your site and see how successful or unsuccessful they are at each step. For example, you can access information such as the steps completed by users who enter the site and come to the purchase step, and how one-time buyers become repeat buyers.
Path Exploration
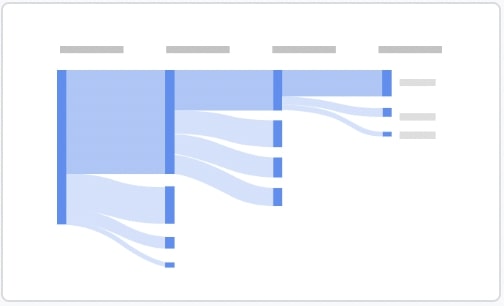
Path exploration is an exploration technique in which you can view users (new or returning), which pages they visit the most after the home page is open, which pages they are stuck on, and the effects of an event on subsequent user actions are observed.
Segment Overlap
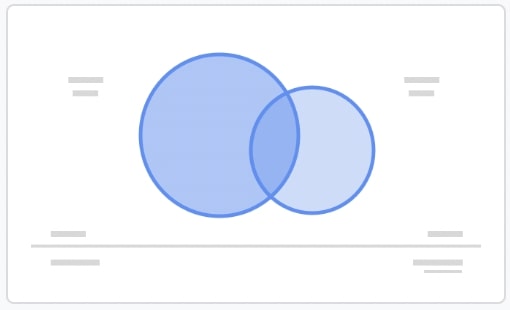
The segment overlap technique allows you to compare up to 3 user segments to see how the segments you create overlap and how they relate to each other.
With this, you can separate some audiences according to complex conditions and create new segments.
Cohort Exploration
A cohort is a group of users who share a common feature for a specified dimension. This section allows you to explore the behavior of these groups on your site or app over a period of time.
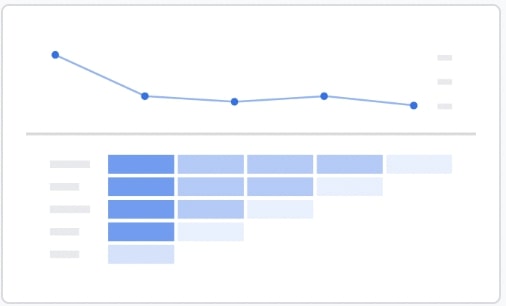
User Lifetime
Here, you can see how your customers have behaved on your site or app throughout their lifetime. The report uses machine learning to predict the probability of future purchases, events and revenues.
Use Cases
Acquisition

Acquisition technique is a report using dimensions and metrics in free-form format, where you can see how successful your marketing efforts are.
Conversion
This is a report using dimensions and metrics in a free-form format, where you can analyze what your users' journey to conversion looks like.
User Behavior
The User behavior technique is a report that uses dimensions and metrics in a free-form format to analyze how your users act when they first land on your site or app.
Industries
Ecommerce
Here, you can use dimensions and metrics in free-form format so you can analyze the state of your e-commerce platform.
Gaming

This section lets you use dimensions and metrics in freeform format, where you can analyze the state of your gaming platform.
