Have you ever wondered how your visitors behave when they interact with your website or app? Do they follow the path you've designed for them, or do they drop off at certain stages?
In data analysis, understanding user behavior and optimizing the conversion funnel are crucial for success. With Google Analytics 4's Funnel Exploration report, you can easily analyze and optimize your conversion funnels to improve your website's performance.
This report allows you to gain deep insights into user behavior, track drop-off points, and optimize the user journey for better conversions.
In this article, we will provide a step-by-step guide on how to use the Funnel Exploration report in GA4.
What is a Funnel Exploration Report?
The funnel exploration report in GA4 helps you to track and view the path your visitors take to complete a specific goal on your website or app.
By analyzing the report, you can find answers to these questions:
- Where are visitors dropping off in the funnel?
- Is there a problem in any stage?
- How well are visitors performing at each stage of the funnel?
- What can you do to improve the user experience and increase conversion rates?
- How can you develop remarketing campaigns to target visitors who drop off at specific stages?
- What should you do to reach more customers?
- How can you improve your conversion rate?
By optimizing your funnels, you'll increase conversion rates and reach more customers than ever before!
How to Create a Funnel Visualization Report?
Follow the steps below to create a sample funnel report.
Login to your GA4 account.
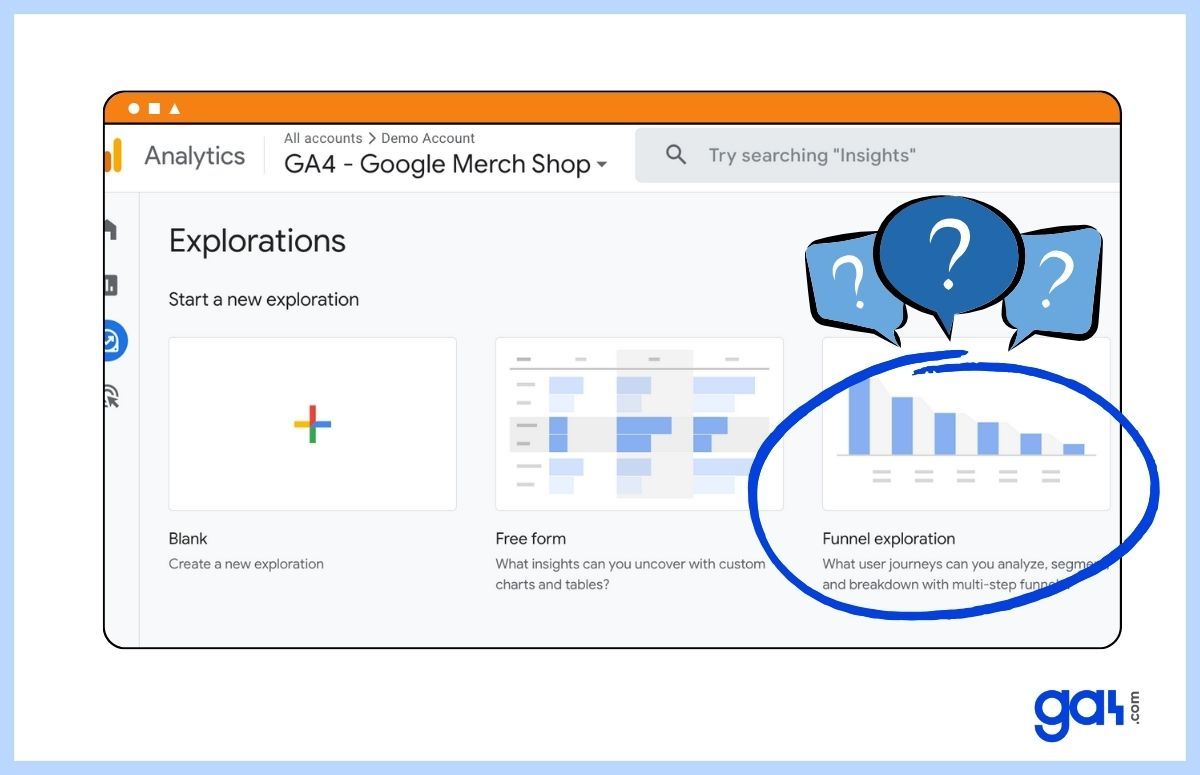
Click the "Explore" button on the left-hand side of the screen and select "Funnel Exploration."
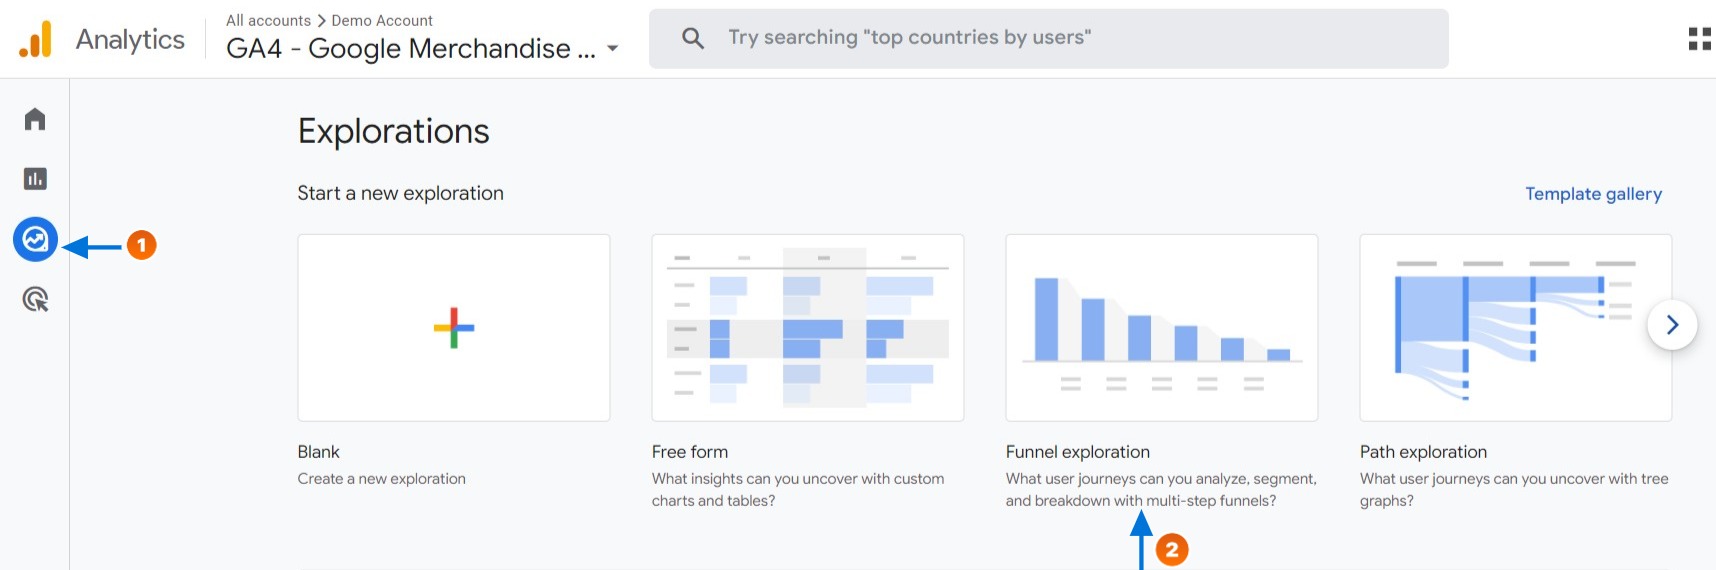
Here, you can choose Funnel Exploration. Then, you will see a sample report with some configuration. 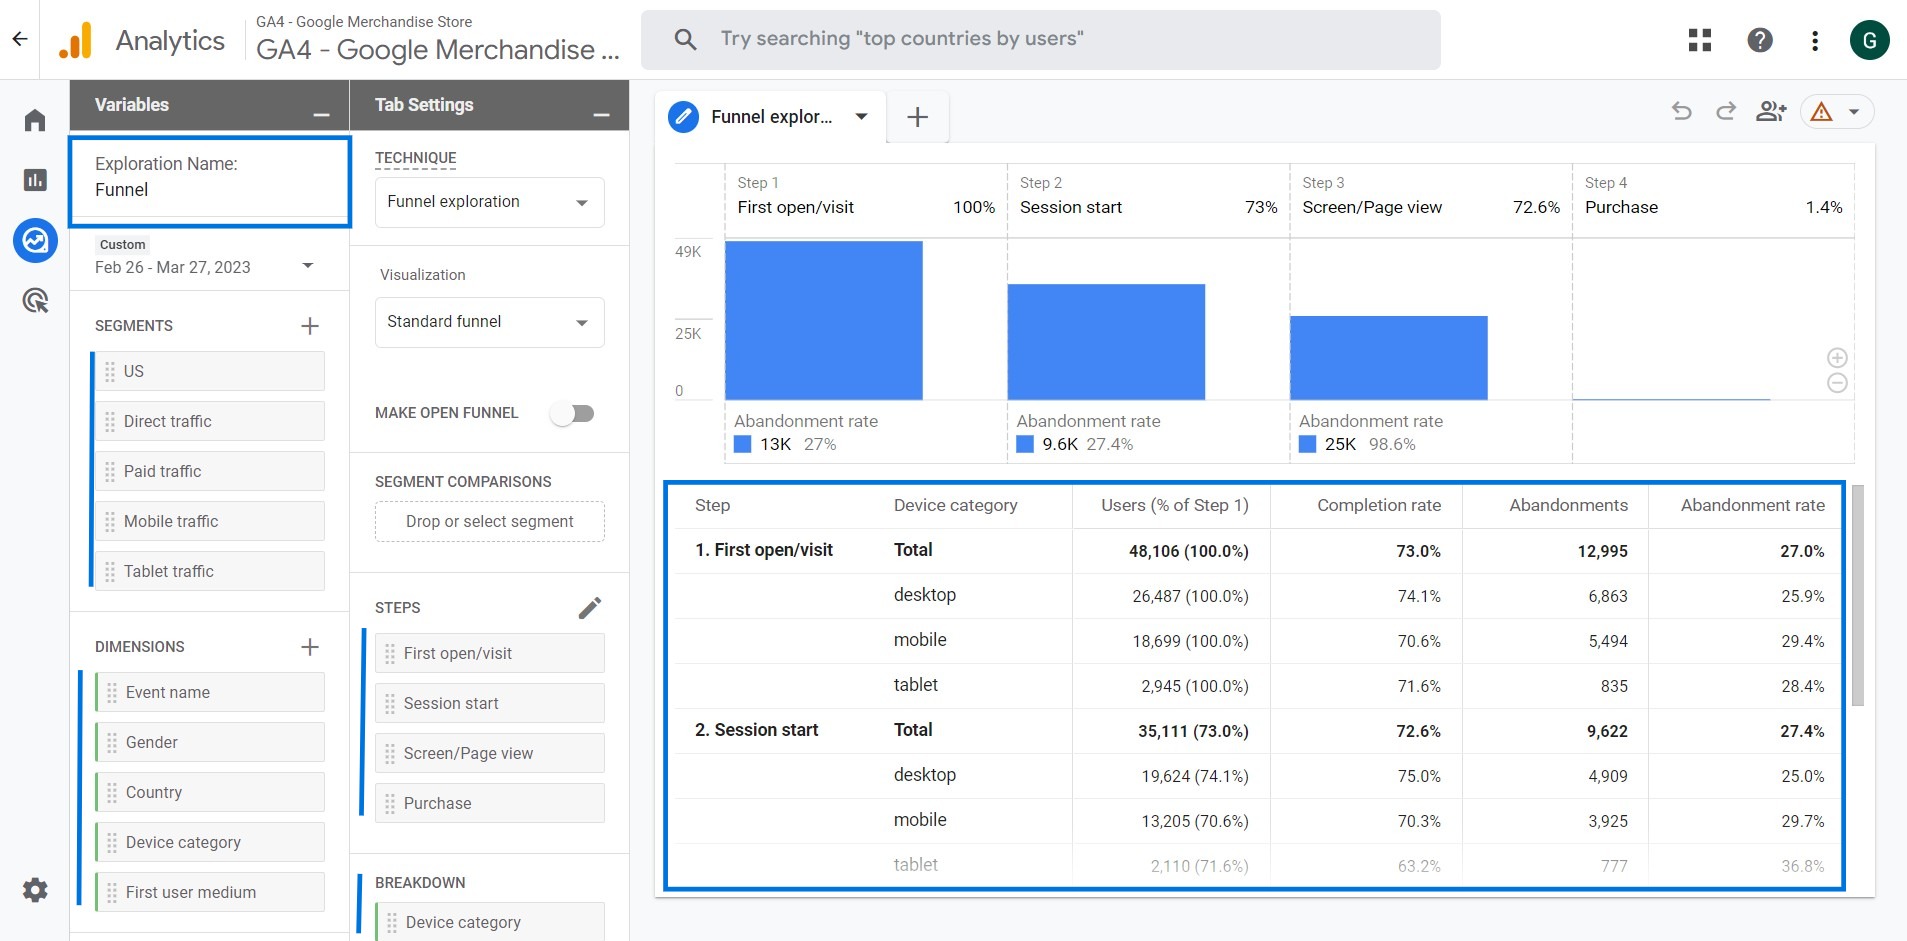
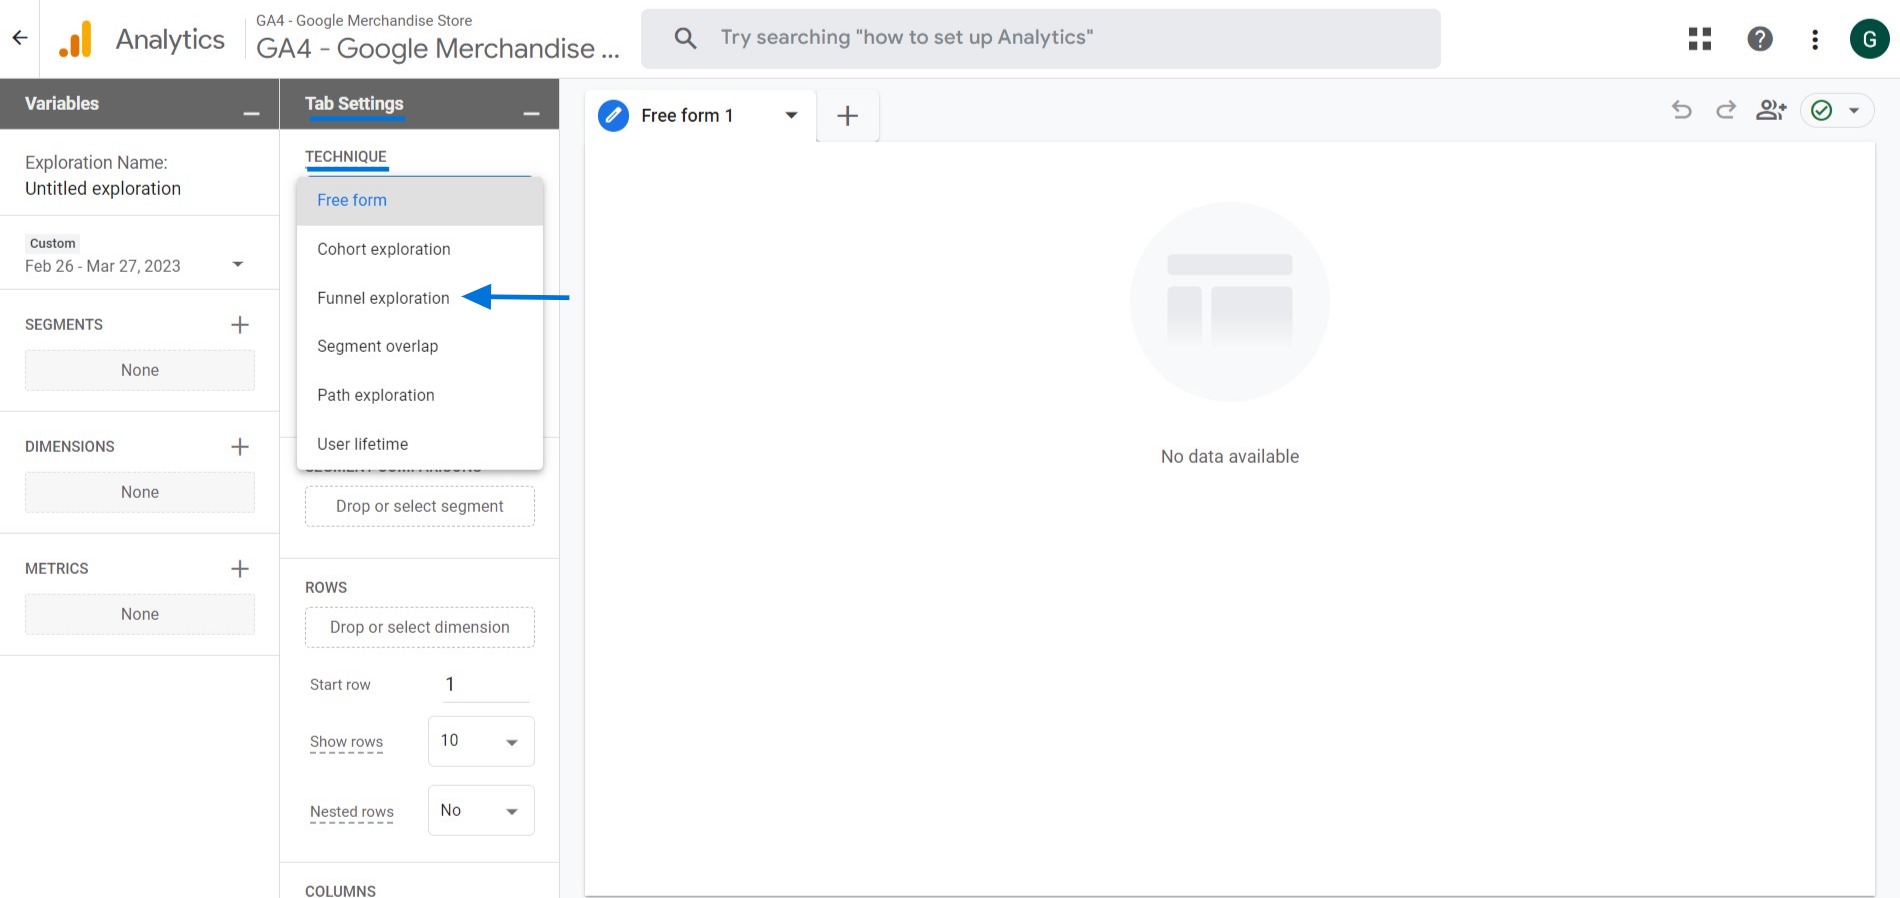
On the other hand, if you choose Blank, you will be see completely empty workspace to start from scratch. To create Funnel Exploration, navigate to the technique area under the tab settings and select "Funnel Exploration."
Main Components of Exploration Report Interface
You'll notice that the interface of the report is divided into three main sections.
Let's deep dive into details!
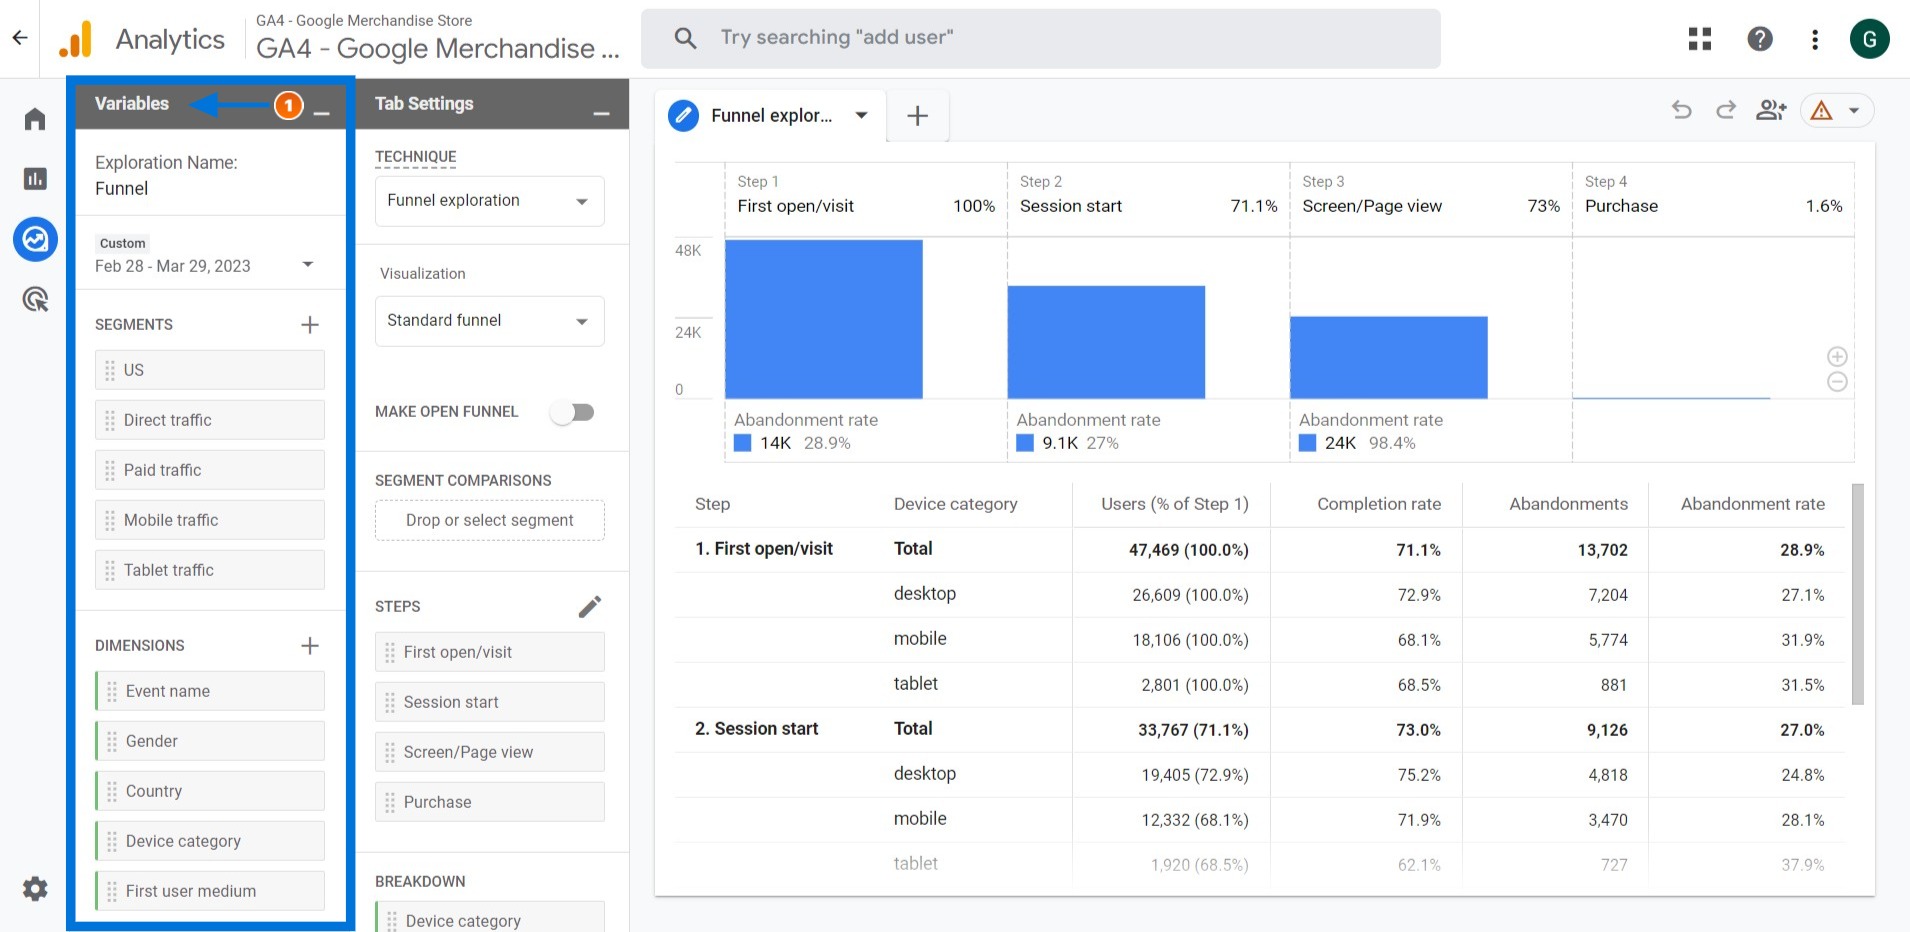
Variables
When setting up a GA4 Exploration report, you can customize your analysis by naming it and selecting the date range, segments, and dimensions that you want to use.
Name of the Analysis:
You can give your analysis any name you like, allowing you to keep track of multiple analyses more easily.
Date Range:
The date range option allows you to select the time period for which you want to view data, such as a specific day, week, or month.
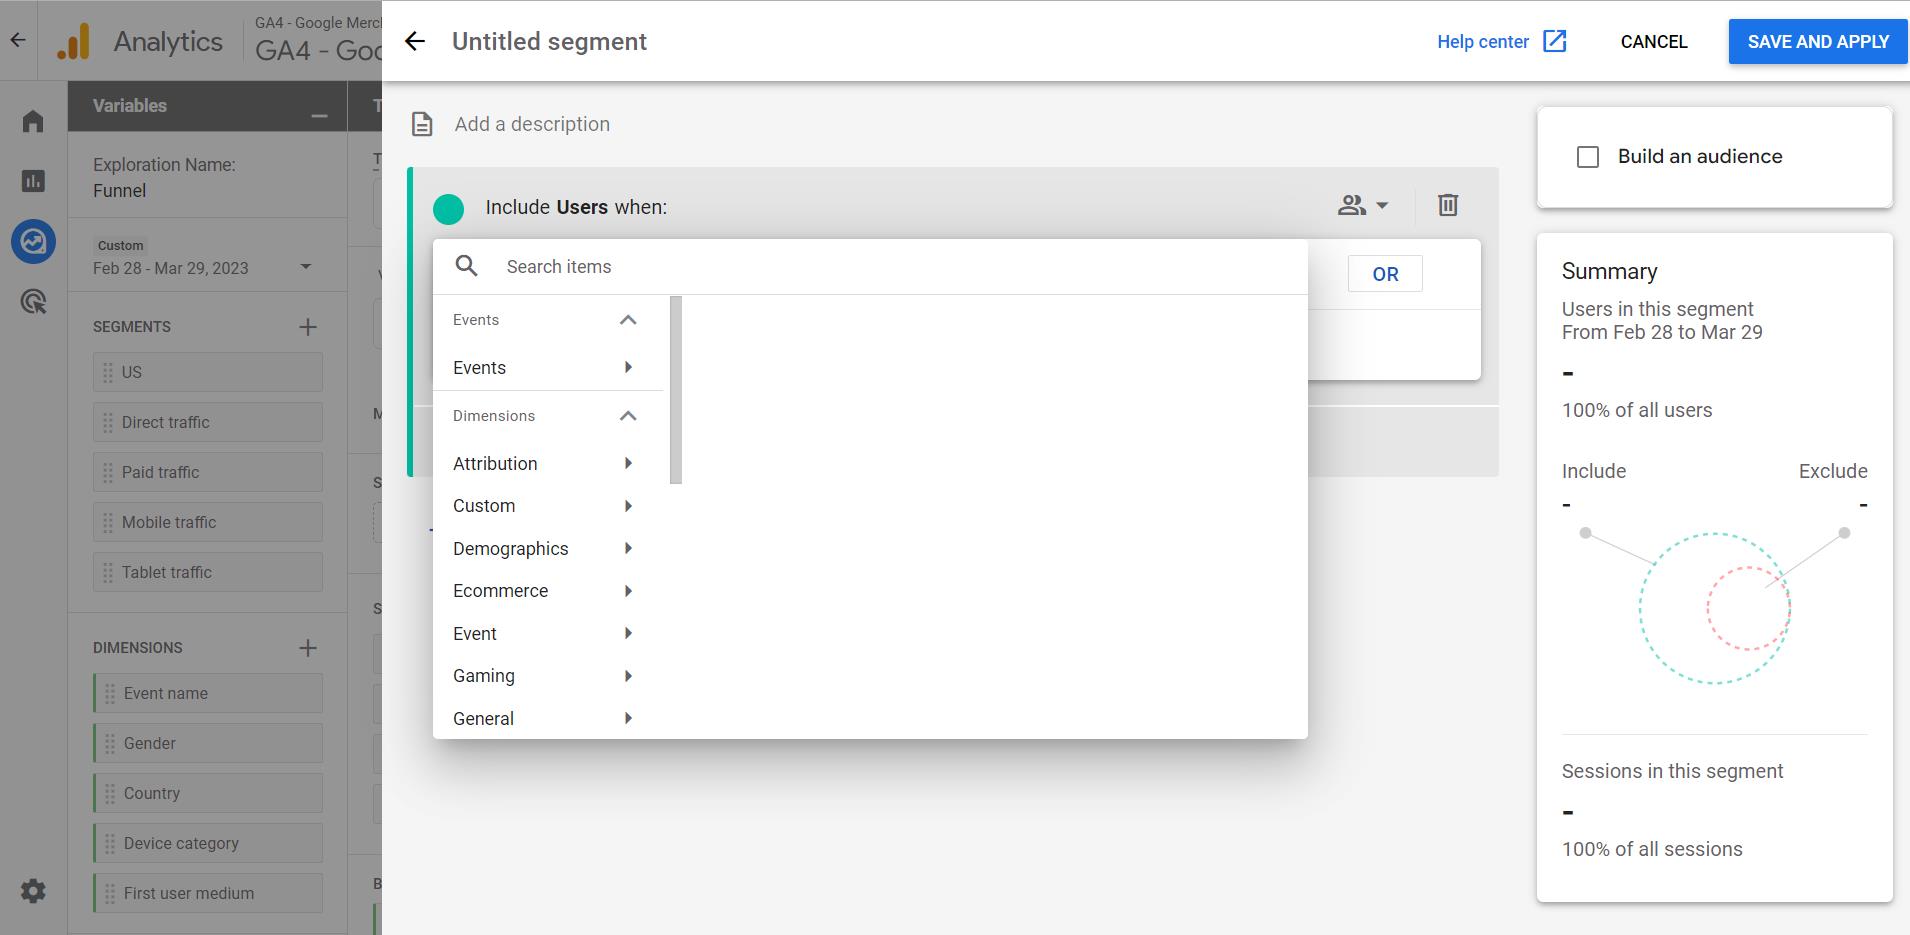
Segments:
Creating segments is useful when you want to compare different user groups and their behavior. When building a new segment, you have two options: you can either create a custom segment or choose one of the suggested segments.
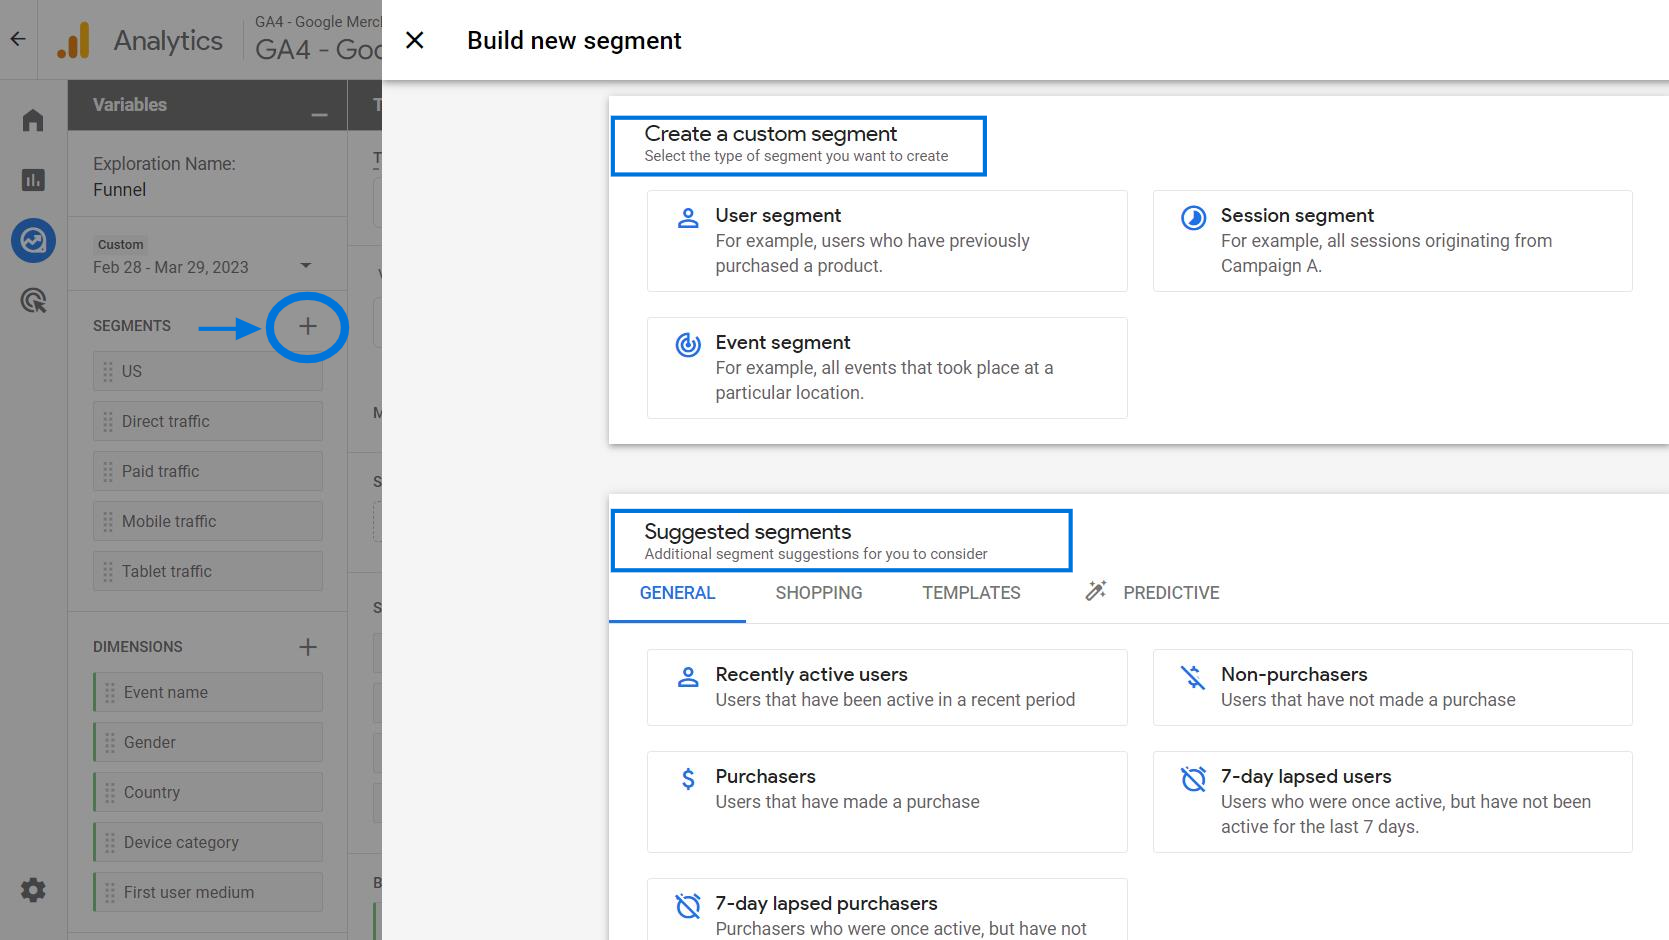
Here are the types of custom segments in GA4:
GA4 segments allow you to analyze data based on specific user criteria.
For instance, you could create a user segment of visitors who frequently visit your website from a specific country. Similarly, you could create a user segment of visitors who have made a purchase before.
To create a user segment, click the “+” button and select “User segment”. From there, you can define the criteria for your segment.
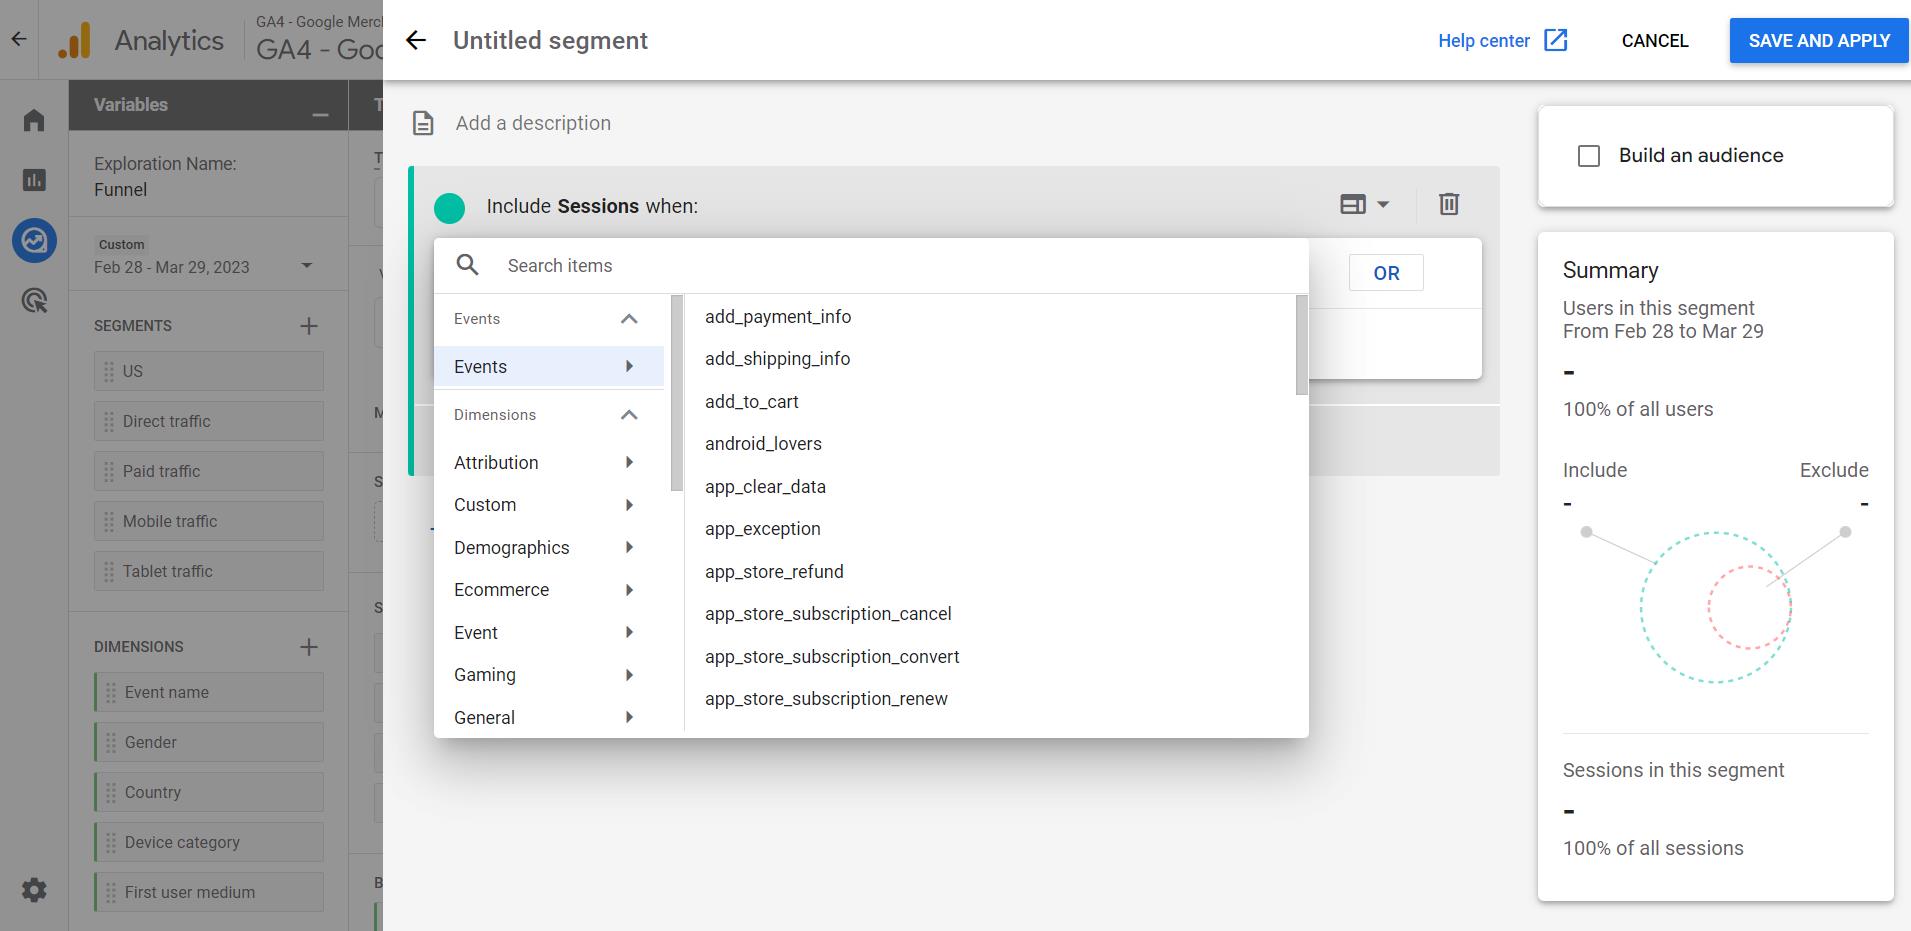
Session segments in GA4 allow you to analyze data based on specific session criteria.
For example, you can create a segment that includes all sessions where users originated from a particular campaign, or visited a certain page.
To create a session segment, click the “+” button and select “Session segment”. From there, you can define the criteria for your segment.
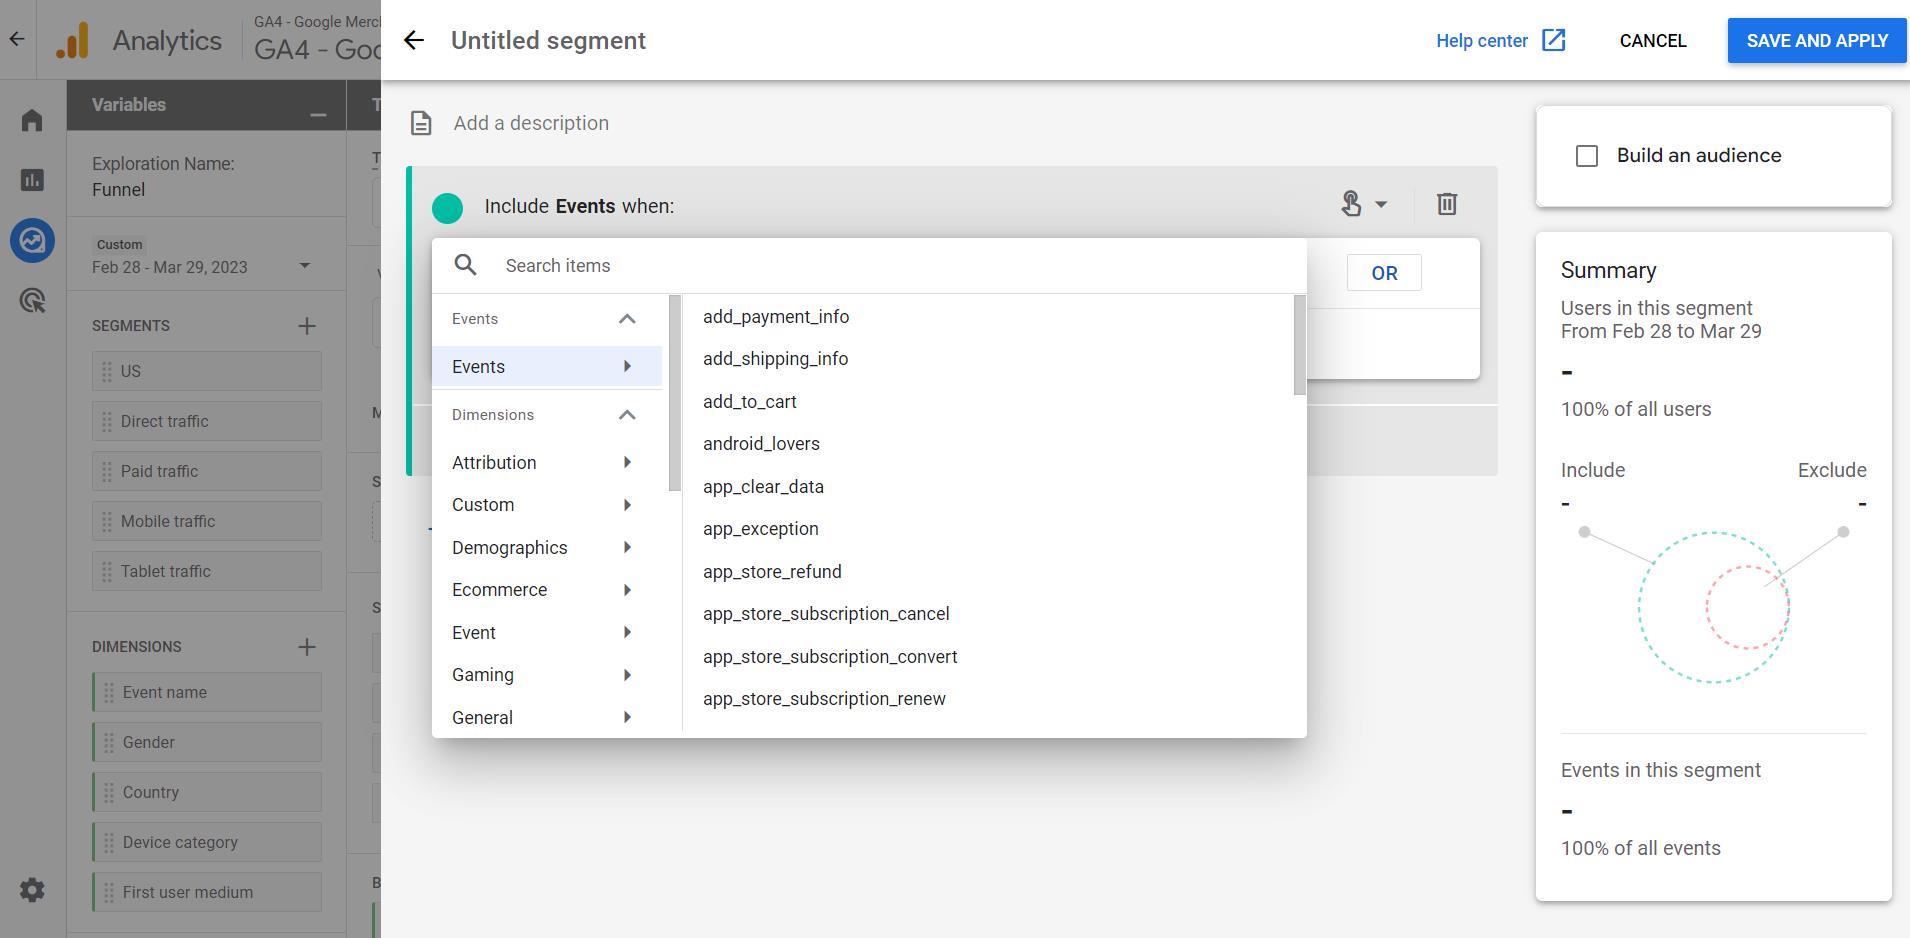
Event segments in GA4 allow you to analyze data based on specific actions users take on your website. (This was not available in Universal Analytics. )
For example, you can track users who have clicked on a particular button or link, file submissions, downloads, purchases, and more on your website.
This analysis enables you to gain insights into users' preferences, interests, and motivations. It can be used to optimize marketing campaigns.
To create an event segment, click the “+” button and select “Event segment”. From there, you can define the criteria for your segment.
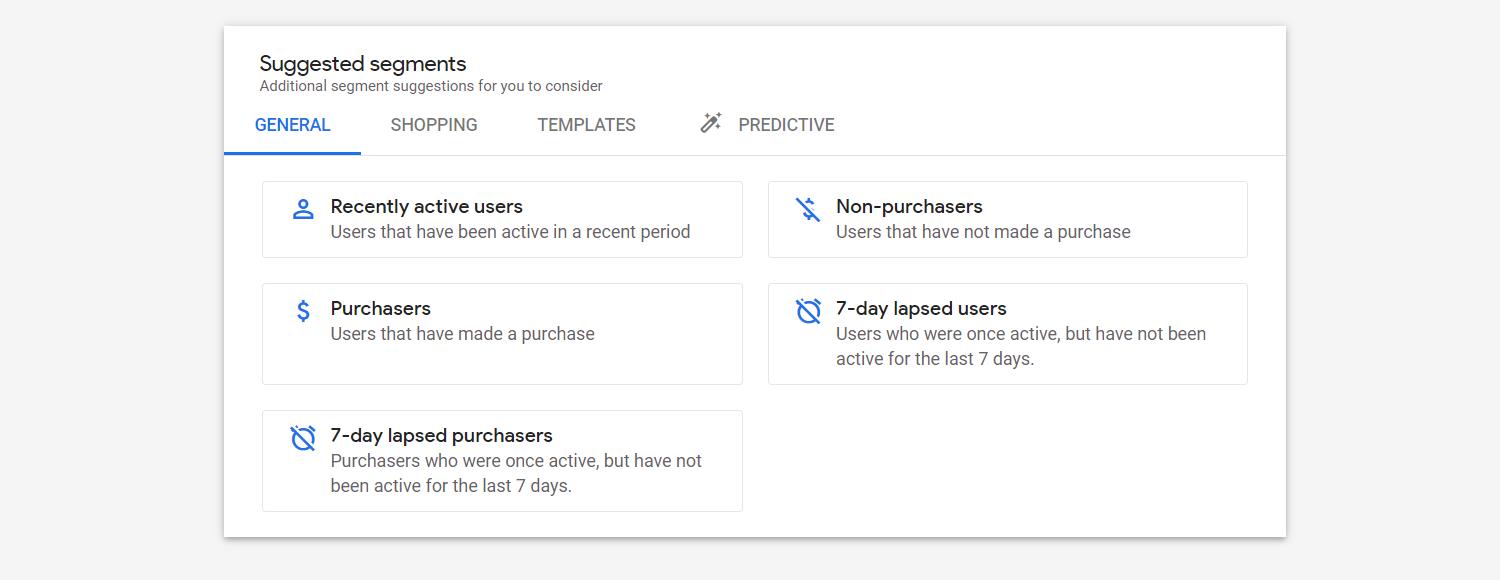
In addition to creating custom event segments, GA4 also offers suggested segments for your convenience.
These segments are organized into categories such as general, shopping, templates, and predictive. You can simply select the segment that best fits your analysis needs.
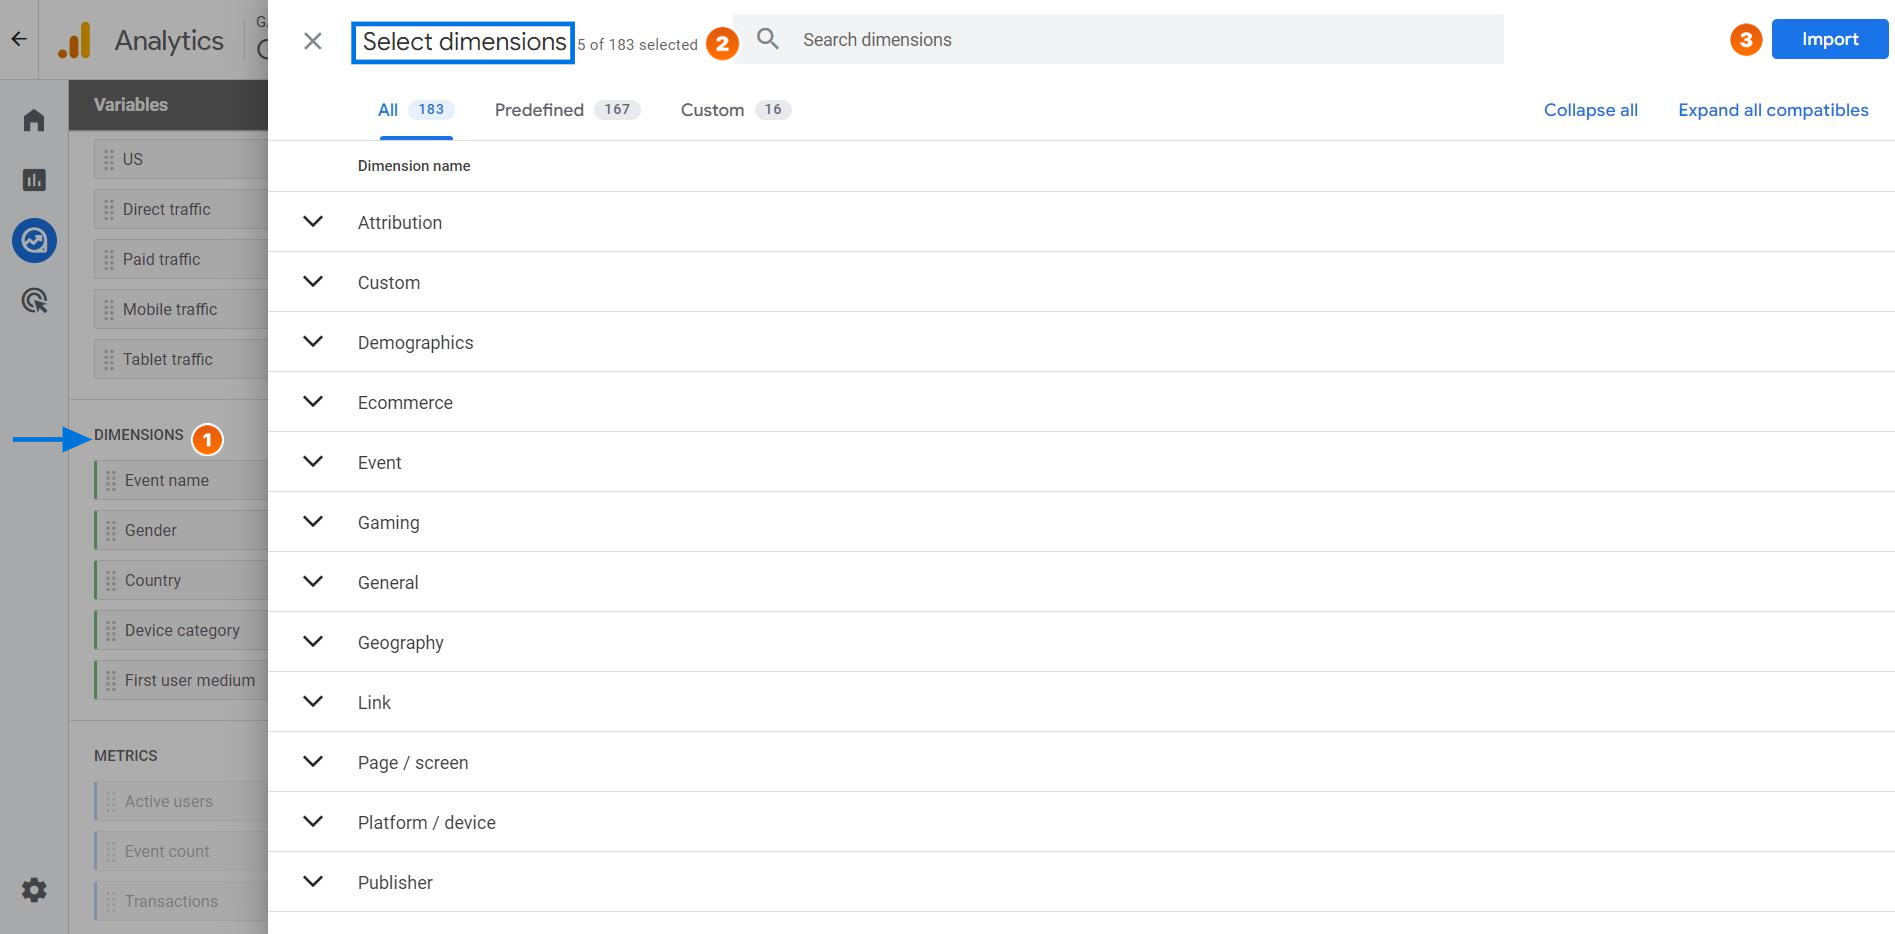
Dimensions:
Dimensions are the attributes of your data, such as any event, user, e-commerce, product, transaction, and more. To create a dimension , click the “ + ” sign. After selecting the dimension, click " Save ."
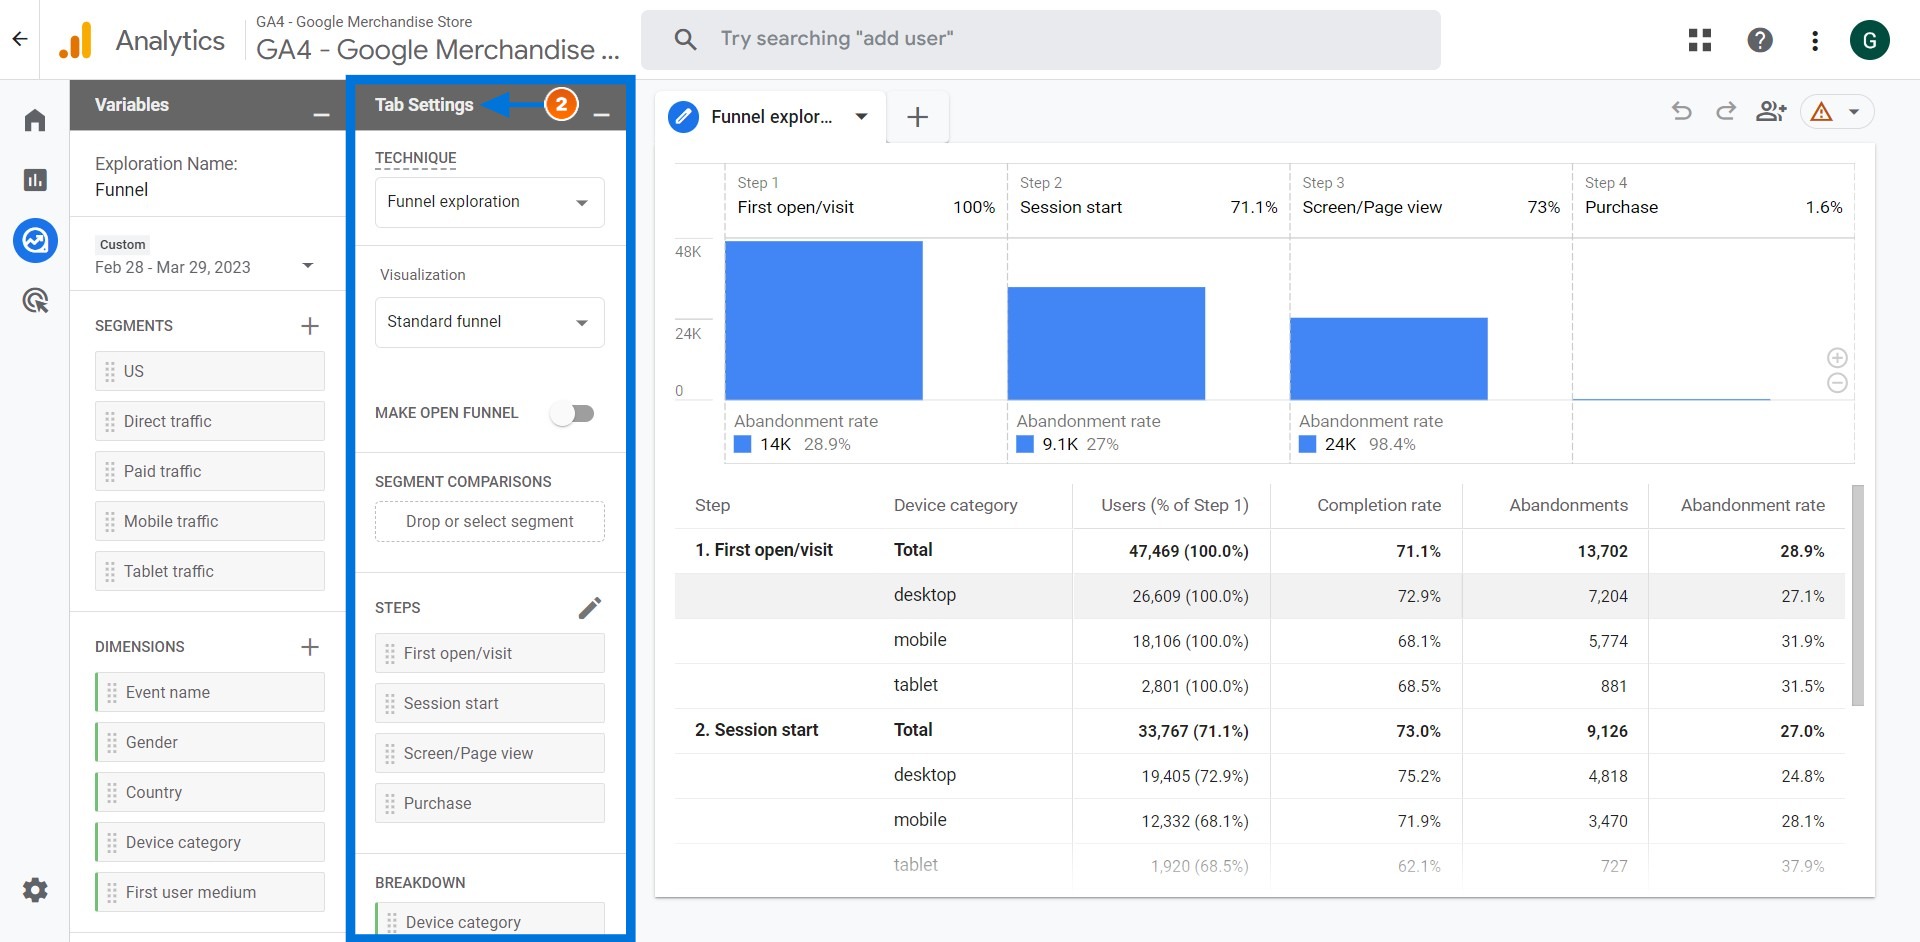
Tab Settings
Technique:
First, you will see a technique drop-down menu where you can select the exploration method used to present your data (such as Free Form or Funnel Exploration). As this is a Funnel Exploration article, we will stick with that option.
Visualization:
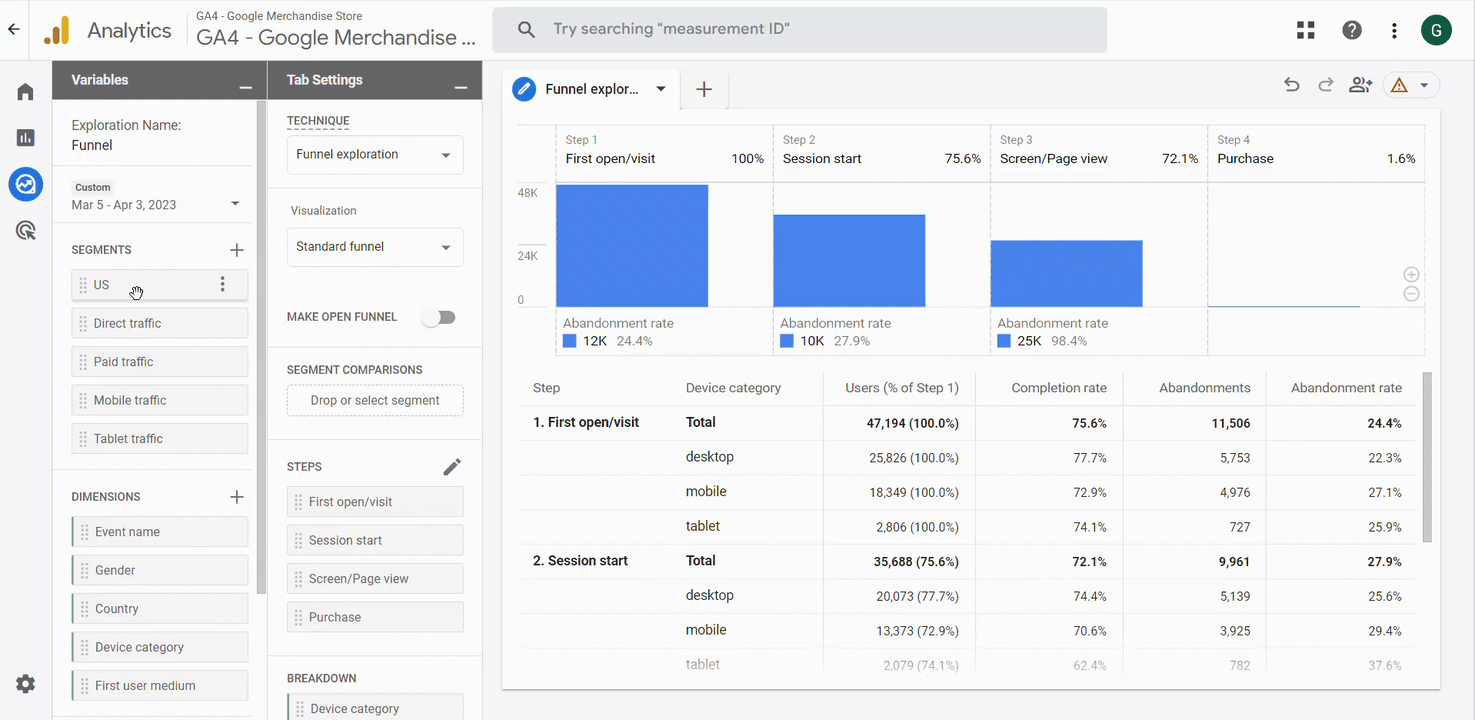
The Visualization sub-area offers two options: Standard Funnel and Trended Funnel . The Standard Funnel is the most common and comes with a bar chart. On the other hand, the Trended Funnel provides a line chart.
Make Open Funnel:
In GA4, funnels are typically set to " closed " by default. This means that visitors will only be counted in a funnel if they successfully complete all the steps, and anyone who enters at the 2nd or later step will not be included.
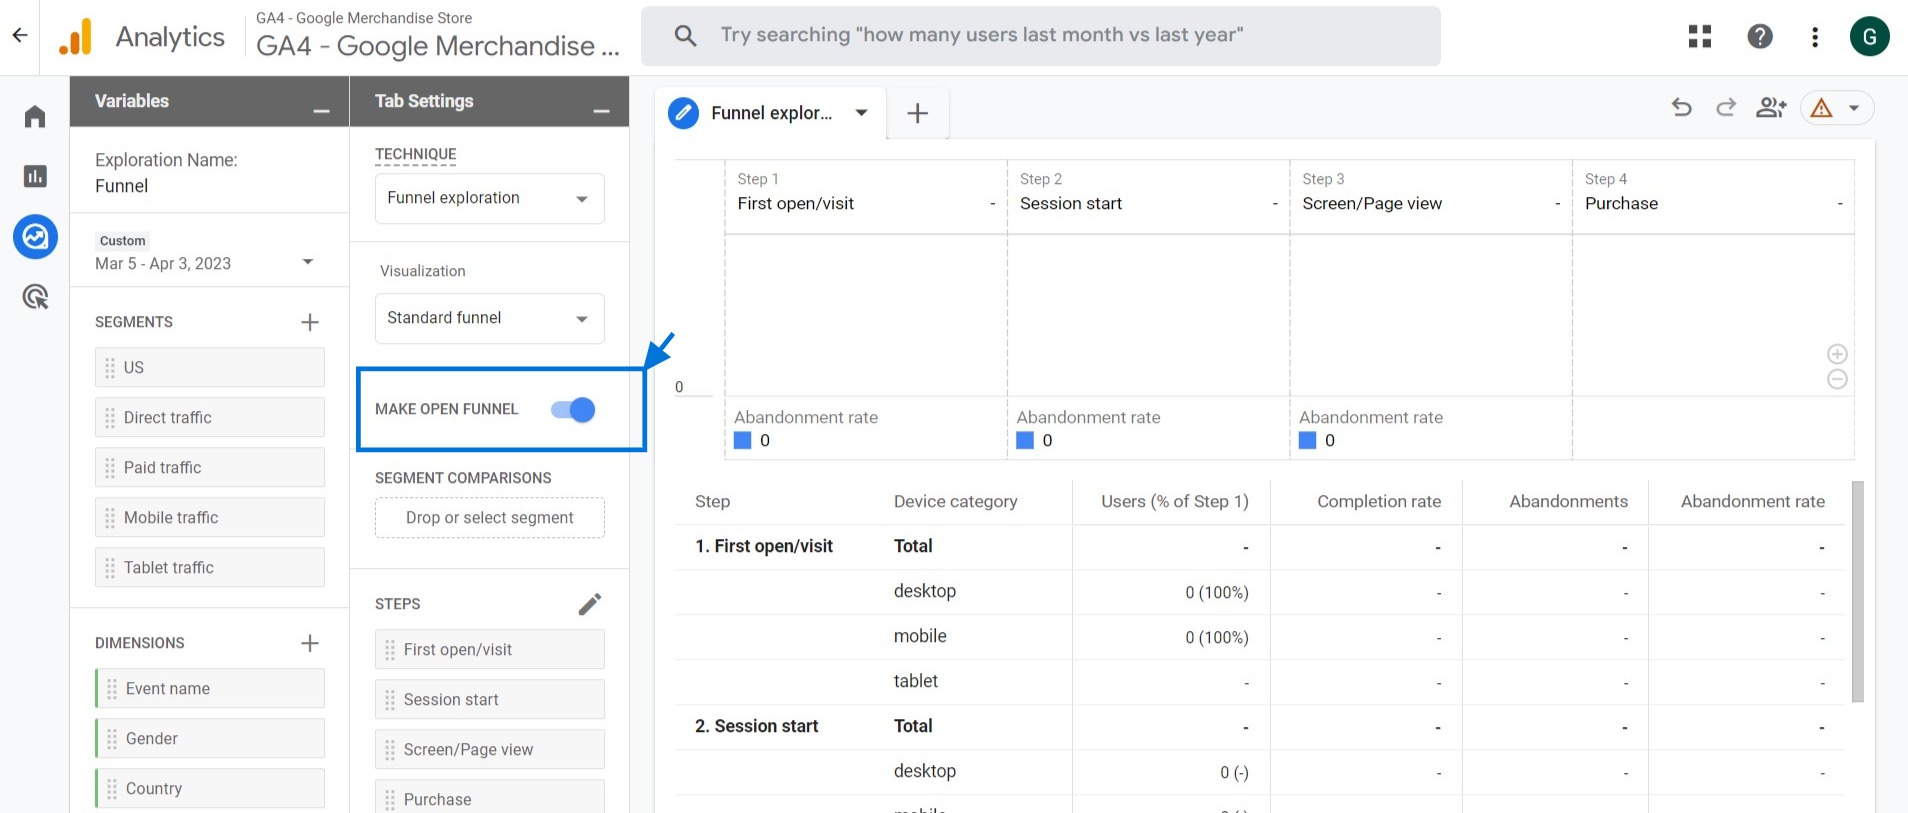
However, if you want to see all users who enter the funnel at any point, you can easily toggle the setting to make the funnel " open " instead.
Segment Comparisons:
To use segment comparison, you can either drag and drop the segments or double-click on them in the variables section.
Segment comparison allows you to apply up to four segments to analyze and compare specific sets of users.
Steps:
In this section, you can customize and configure the different steps of your funnel. When we open a sample report, we see steps added by default.
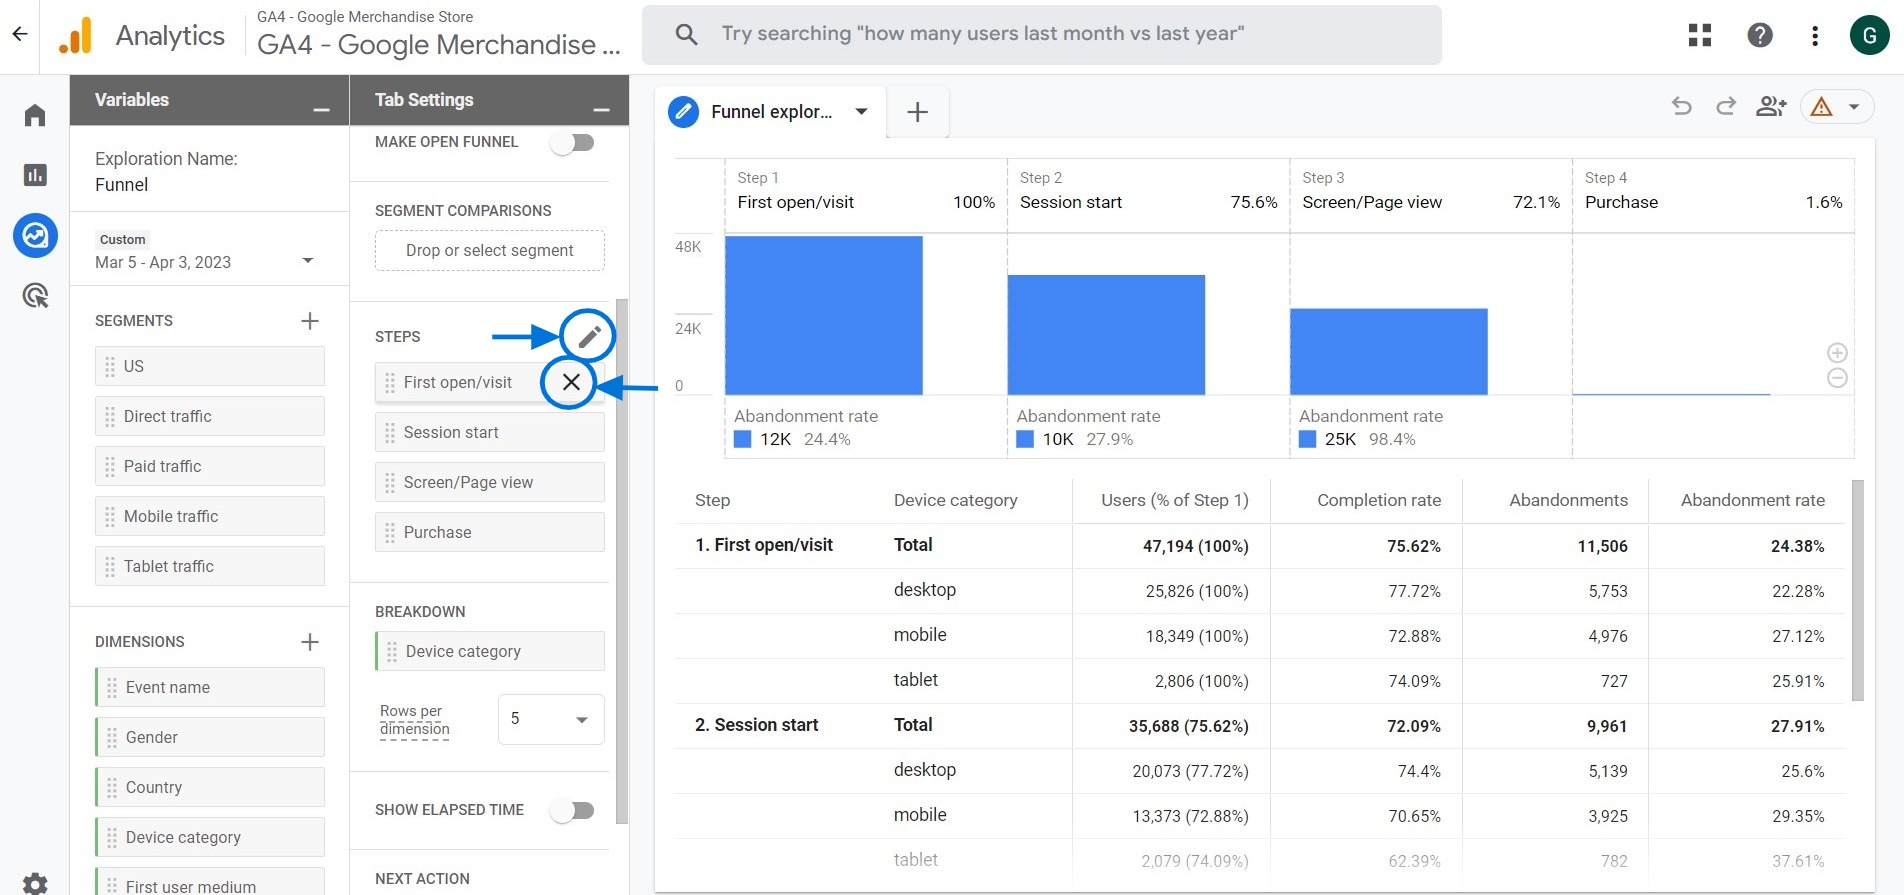
- To remove them, click on the X next to each step.
- If you want to add or edit a step, click on the pencil icon .
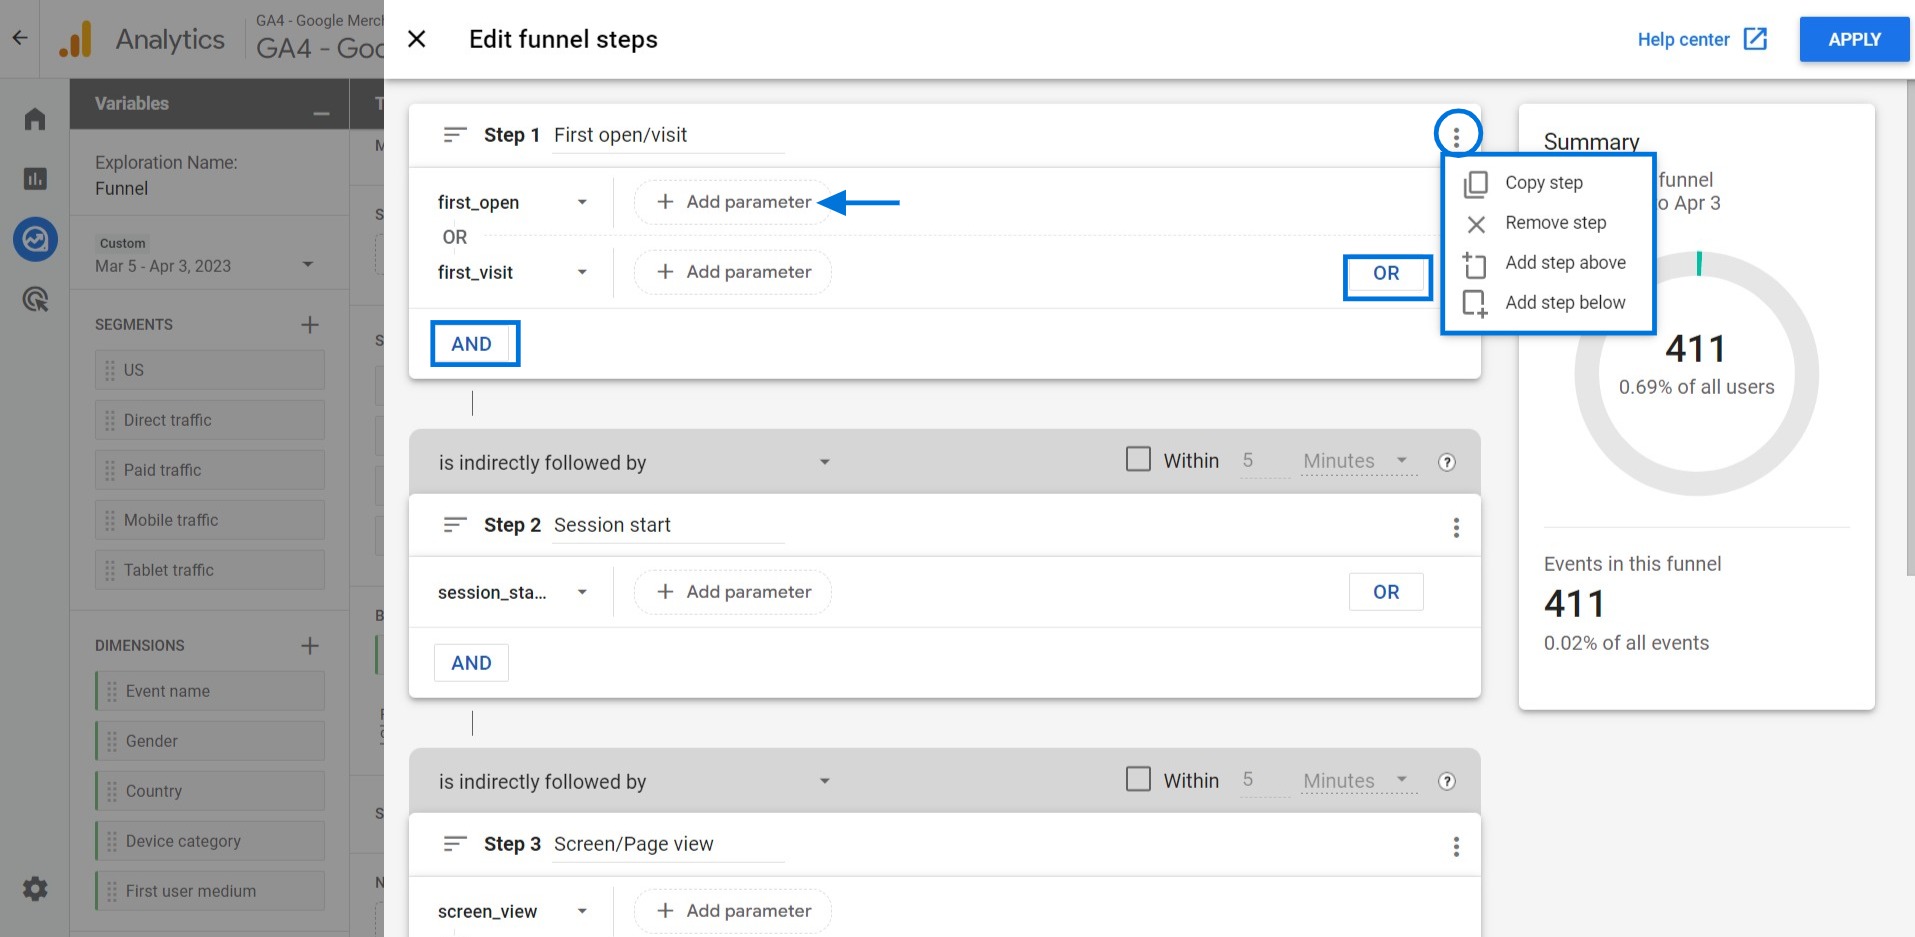
In this interface, you can edit existing steps and add parameters . You can also add more conditions using the AND / OR buttons. Additionally, you have the ability to copy, remove, add a step above, or add a step below by clicking the 3 dots in the right corner.
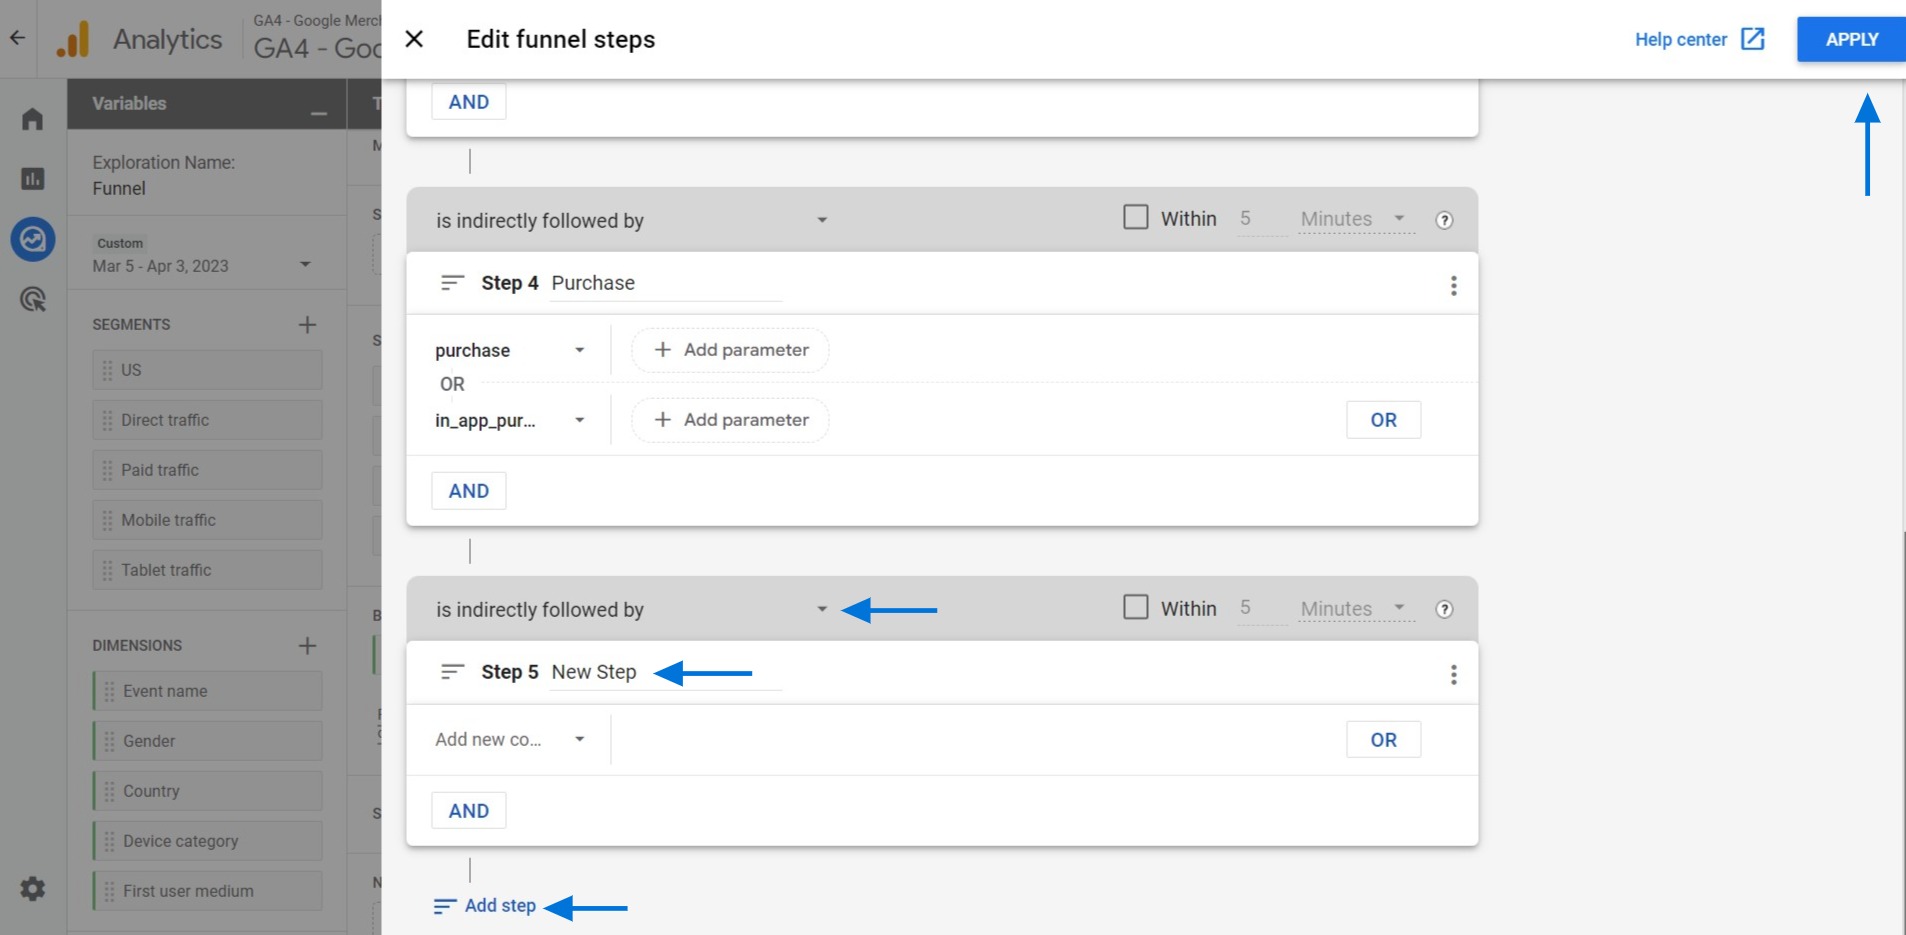
At the end of the page, you will see the " Add step " button. After clicking it, give a name to the step. Above the step name, you can choose whether the step should directly or indirectly follow the previous step.
Once you've configured your funnel steps, click on the " Apply " button in the top-right corner.
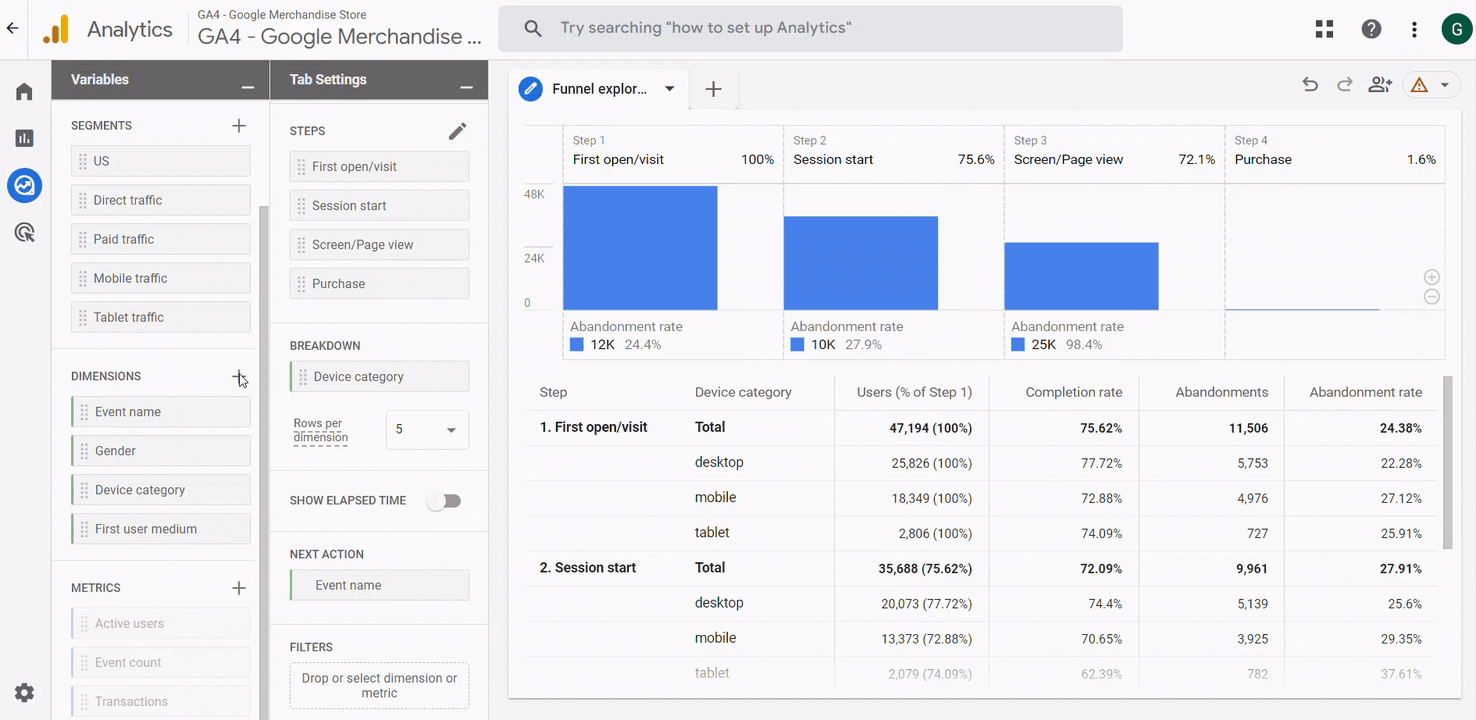
Breakdown:
Here, you can analyze your funnel data by different dimensions, including device category, gender, and more. To access the Breakdown section, simply click on the " Drop or select dimension " area. Once you click on it, a dropdown menu will appear with a list of available dimensions to choose from.
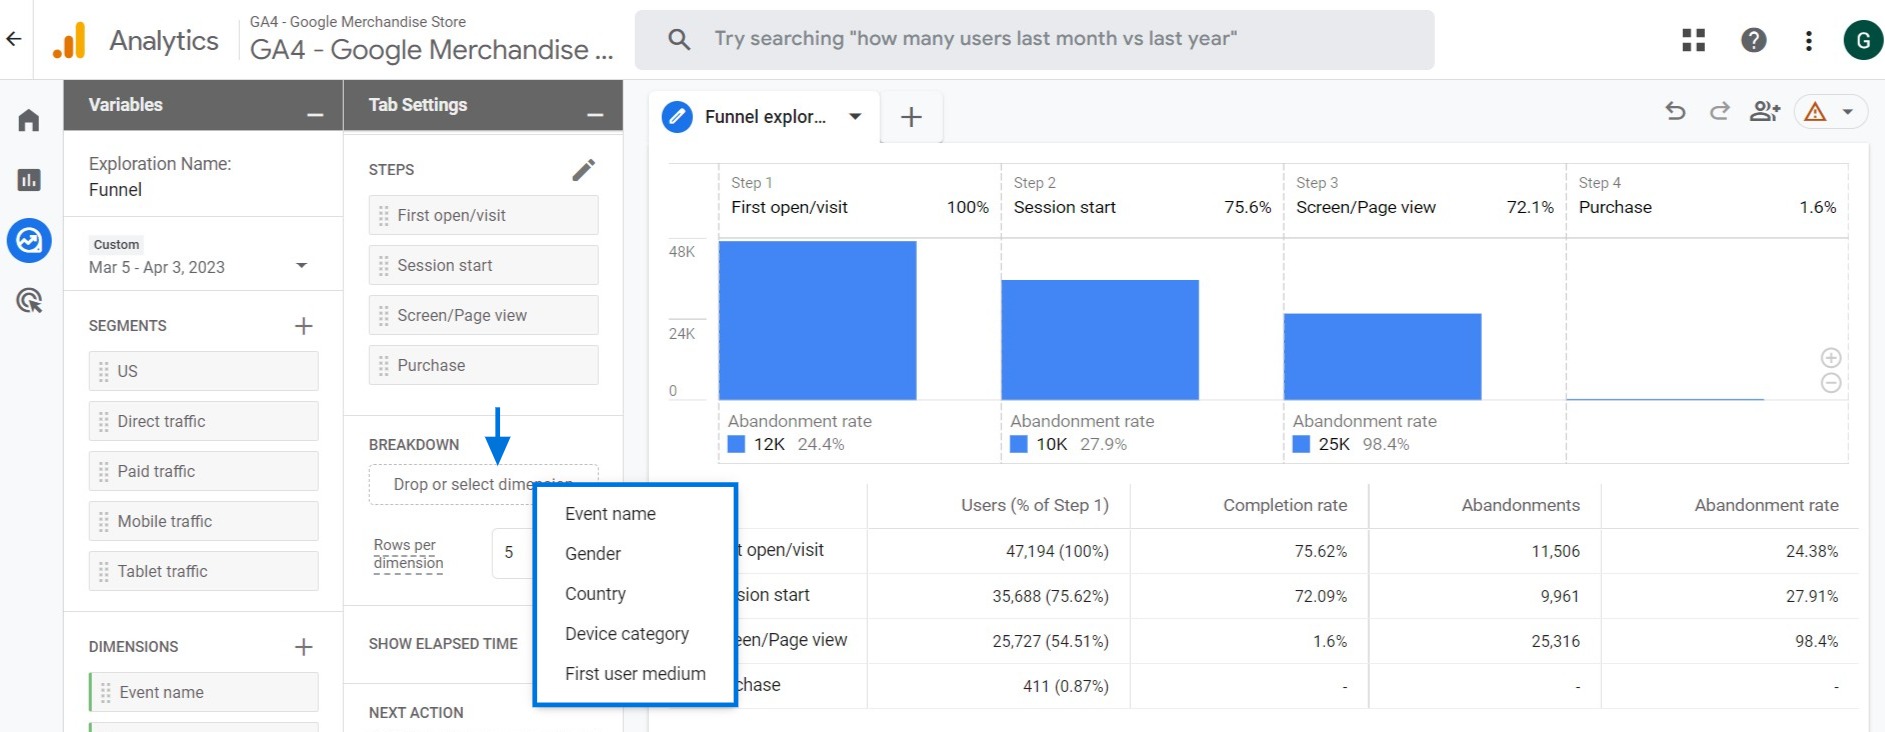
For example, let's say we want to analyze how users of different gender groups complete the funnel. We can select " Gender " as our breakdown dimension to see how they behave throughout the funnel. For instance, if we notice that women are less likely to complete a certain step in our funnel, we can create targeted campaigns to encourage them to move forward.
If the dimension has more than several possible values, we can use the " Rows per dimension " option to select how many rows we want to display. By default, the value is set to 5 , but we can increase or decrease it as needed.
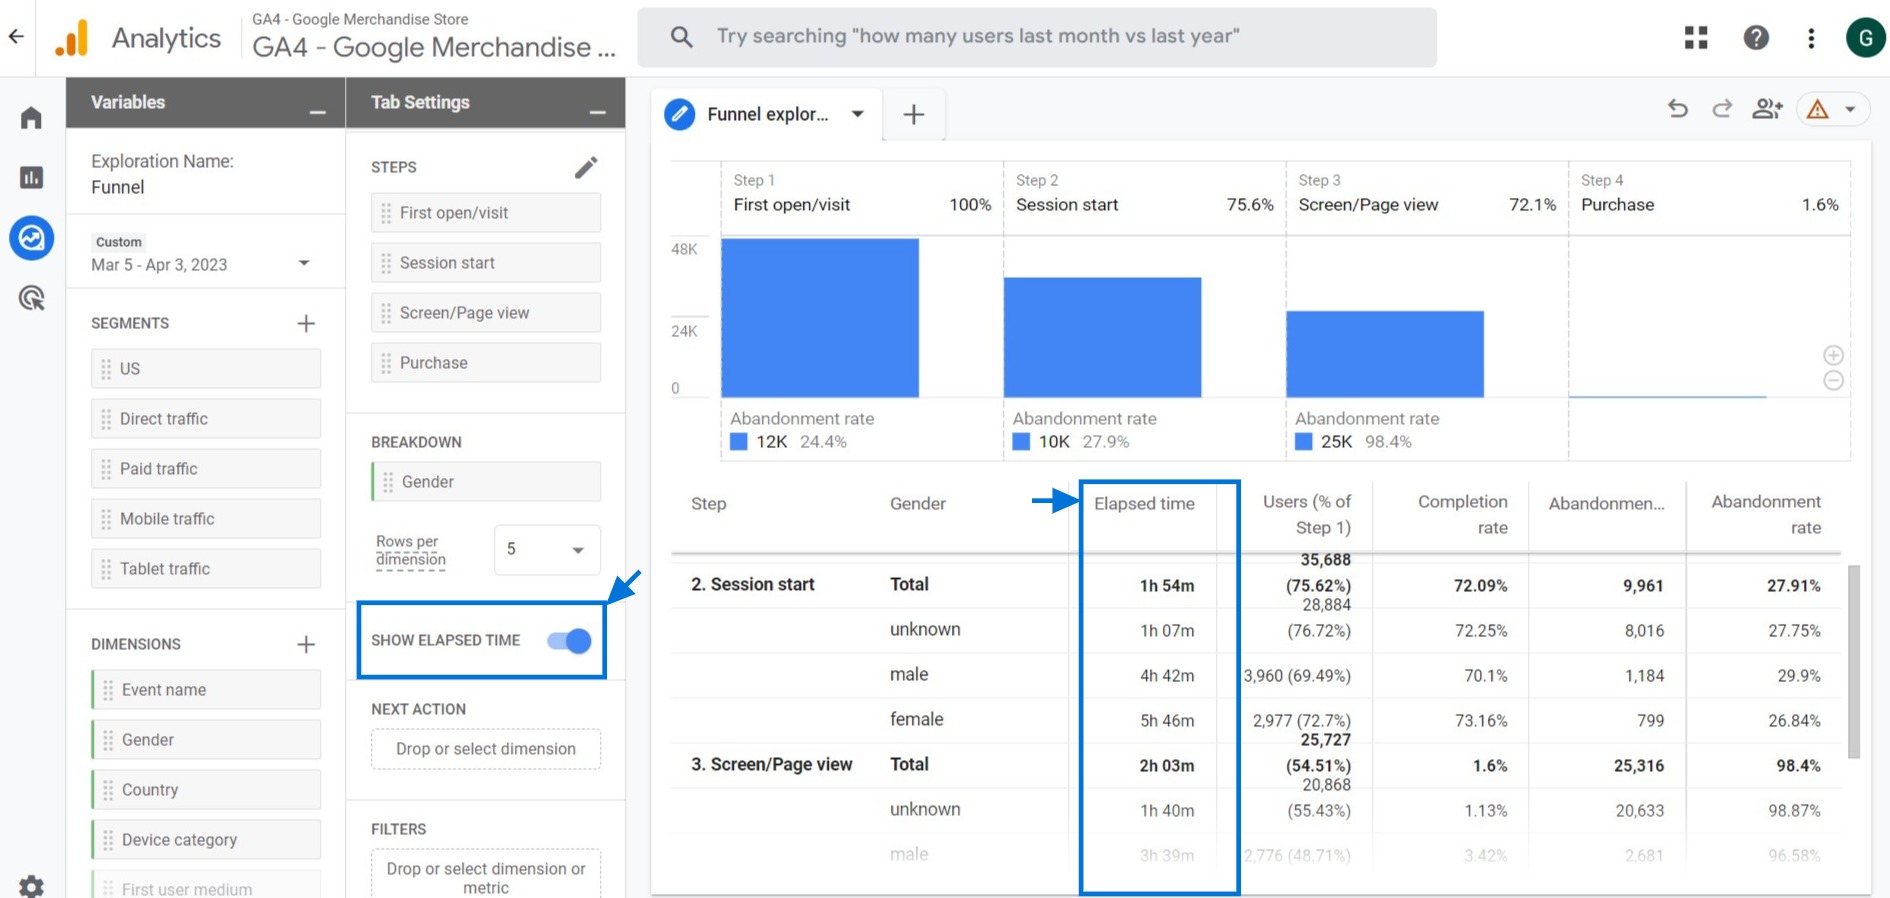
Show Elapsed Time:
Enabling the "Show Elapsed Time" feature in GA4 can provide valuable insights into the time it takes for your website visitors to move from one step to another in your funnel.
Next Action:
For example, let's say we have a funnel in which the first step is to view a product page, the second step is to add the product to the cart, and the third step is to complete the purchase. We want to see what actions our users are taking after each step to identify any drop-off points or areas for improvement.
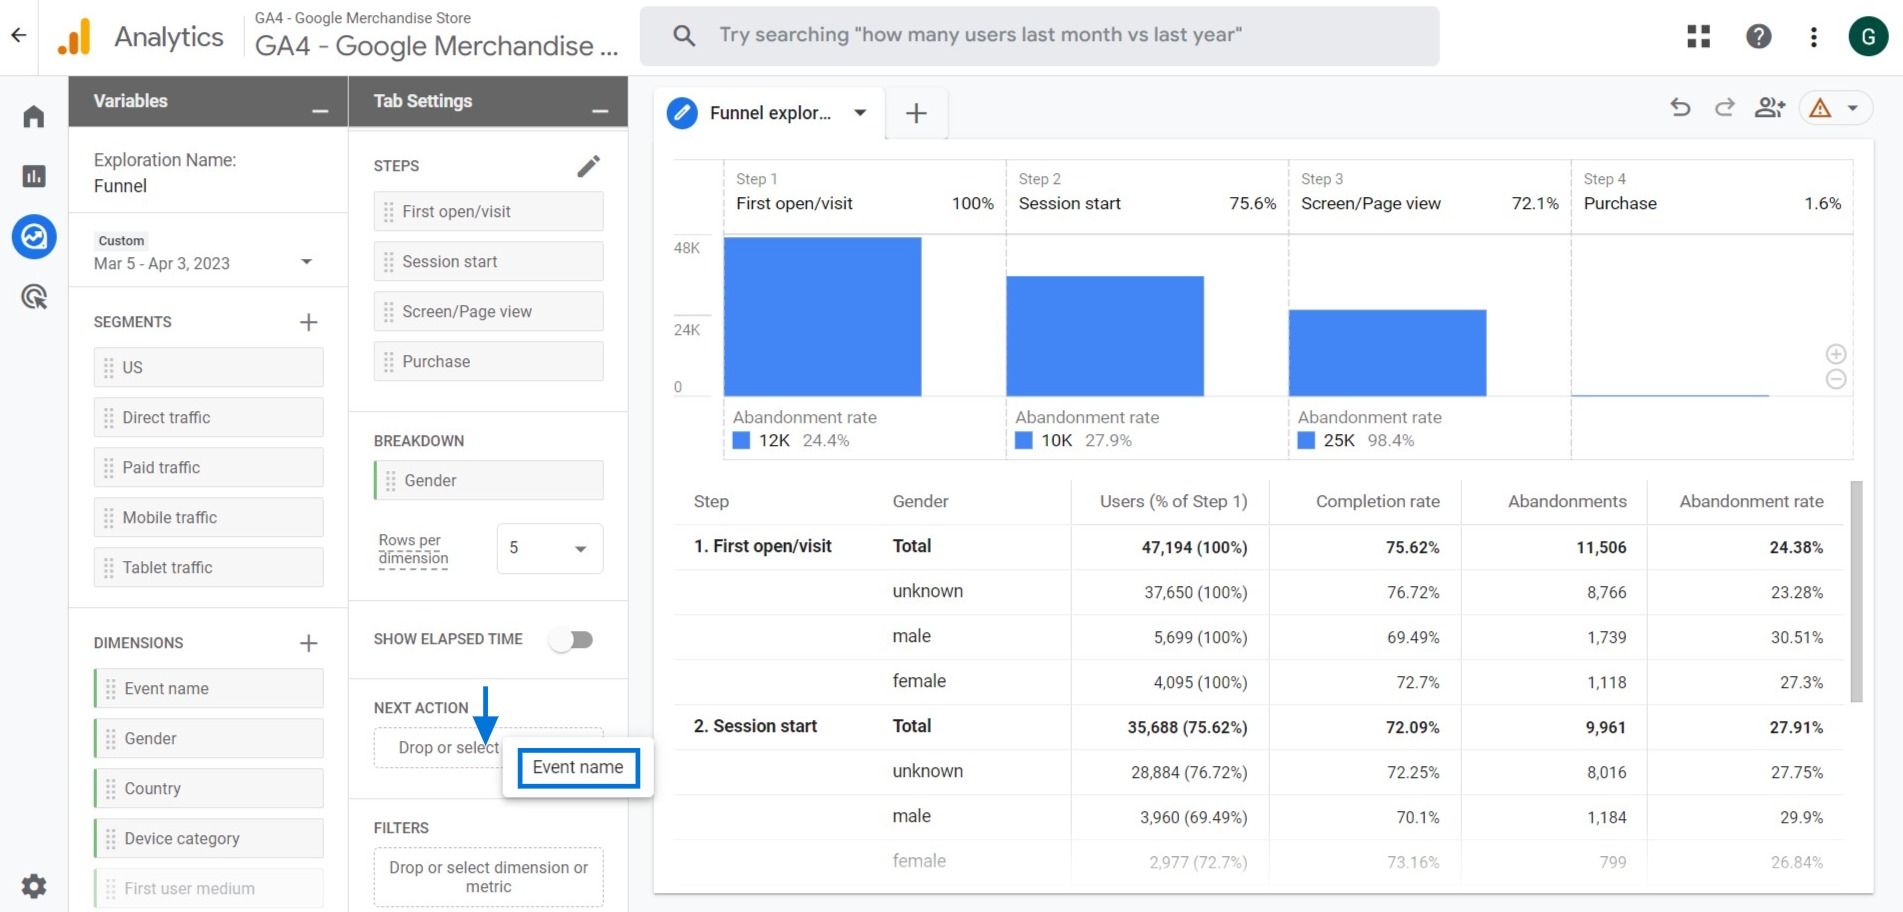
To do this, we can add the Event name dimension and hover over the funnel graph to view the Top 5 Next Actions.
Filters:
Filters allow you to isolate specific information quickly. To do this, you can drag and drop any dimension you already created in the Dimensions section. By using match types such as "contains" and "equals", you can create a filter.
For example, you may want to analyze the conversion funnel for a specific country. First, add the " Country " dimension to the Dimensions section of the Variables column. Then, set the filter as you wish. By doing so, you can filter out all the irrelevant data and focus on the specific country's performance.
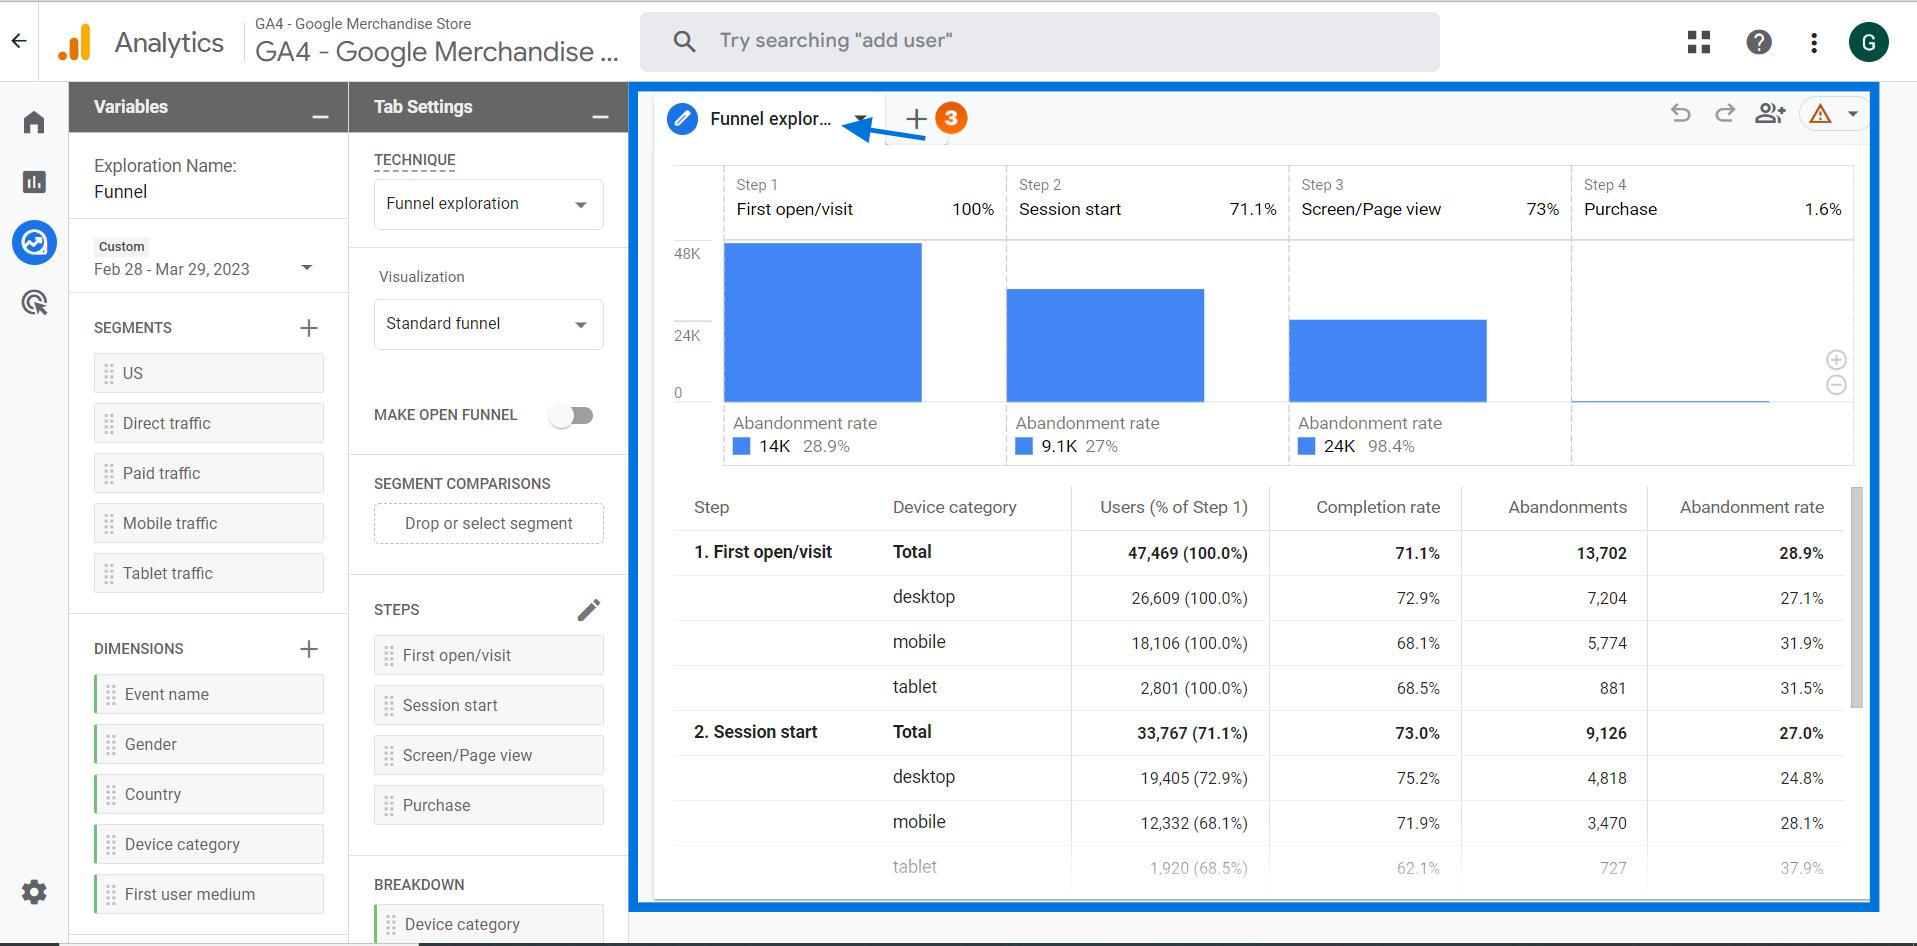
Report
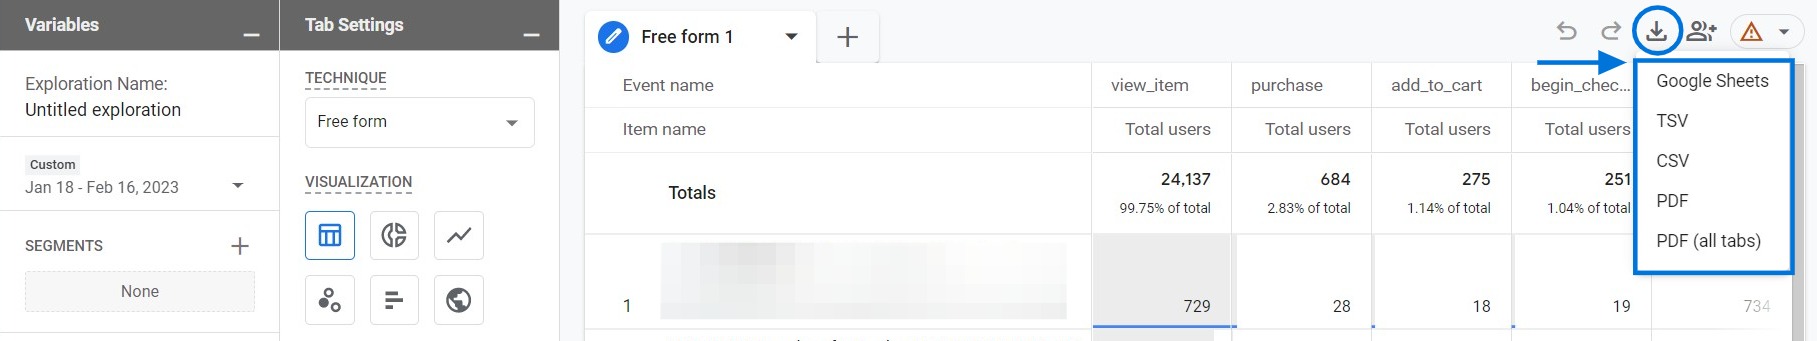
Let's take a look at how to download and share the report. To download the report, select the download option and choose the desired format from the dropdown list.
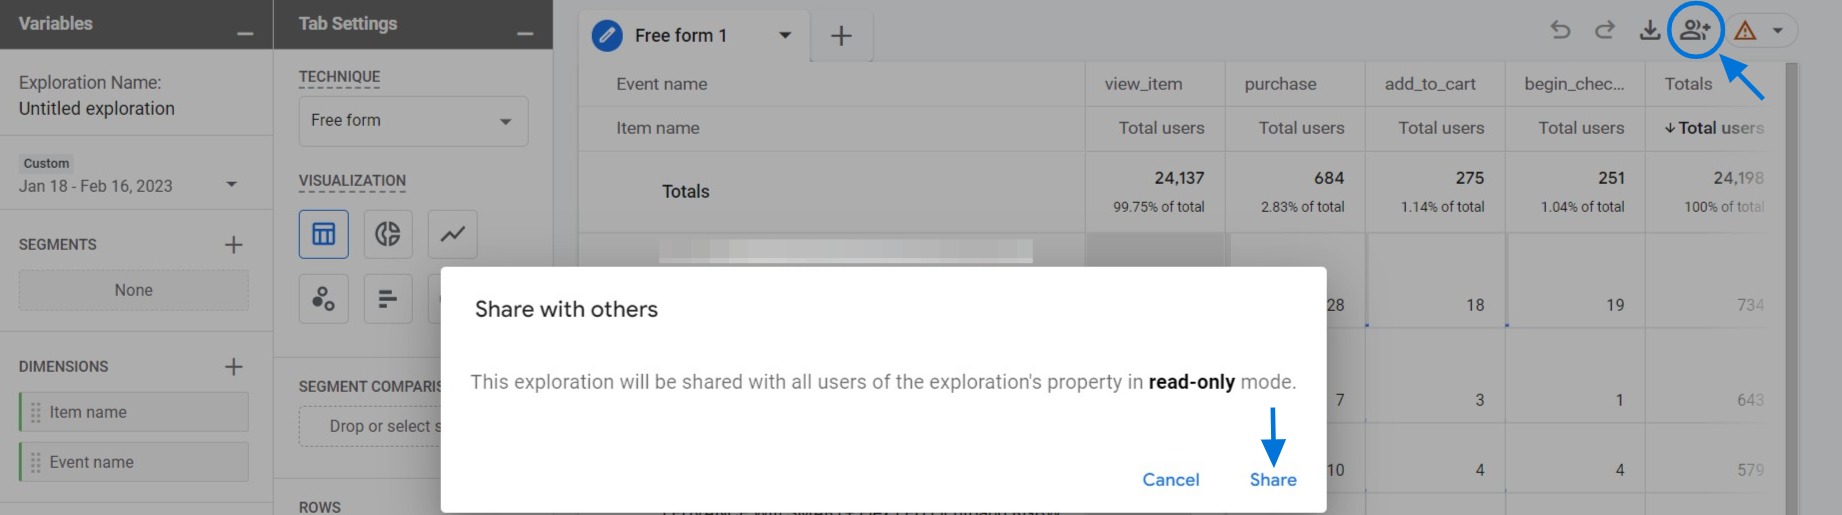
To share the report, click on the share icon and then click on the share button to send it to your colleagues.
Congrats :) Now, you know how to use the Funnel Exploration report in GA4!
