Understanding how your users arrived at your website is one of the most useful pieces of information Google Analytics provides.
The acquisition and engagement reports in GA4 are where you'll find the information you're looking for.
Do you know which reports tell you how many people visited your website and where they came from?
The following default GA4 reports are used for quick and simple analysis of traffic sources:
- Traffic Acquisition Report
- User Acquisition Report
- Conversions Report

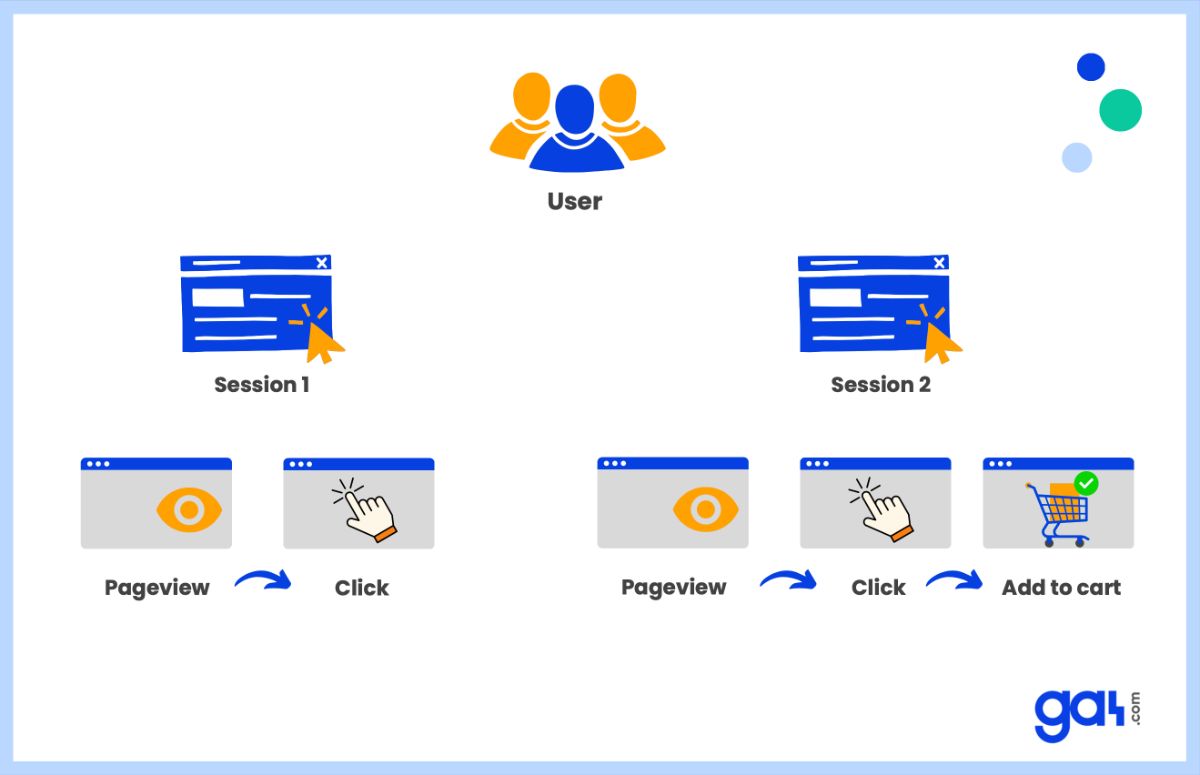
First, you need to know how GA4 organizes sessions. A user's session lasts from the time they visit your website or app until they leave it.
For example, a user goes to your website, looks at a page, click on something, and then leaves.
The next day, they go back to your website and add something to their shopping cart. GA4 considers these as two different sessions.
Let's take a more in-depth look at these reports and the ways in which you can use them to view the entry source for all users.
Traffic Acquisition Report in Google Analytics 4 (GA4)
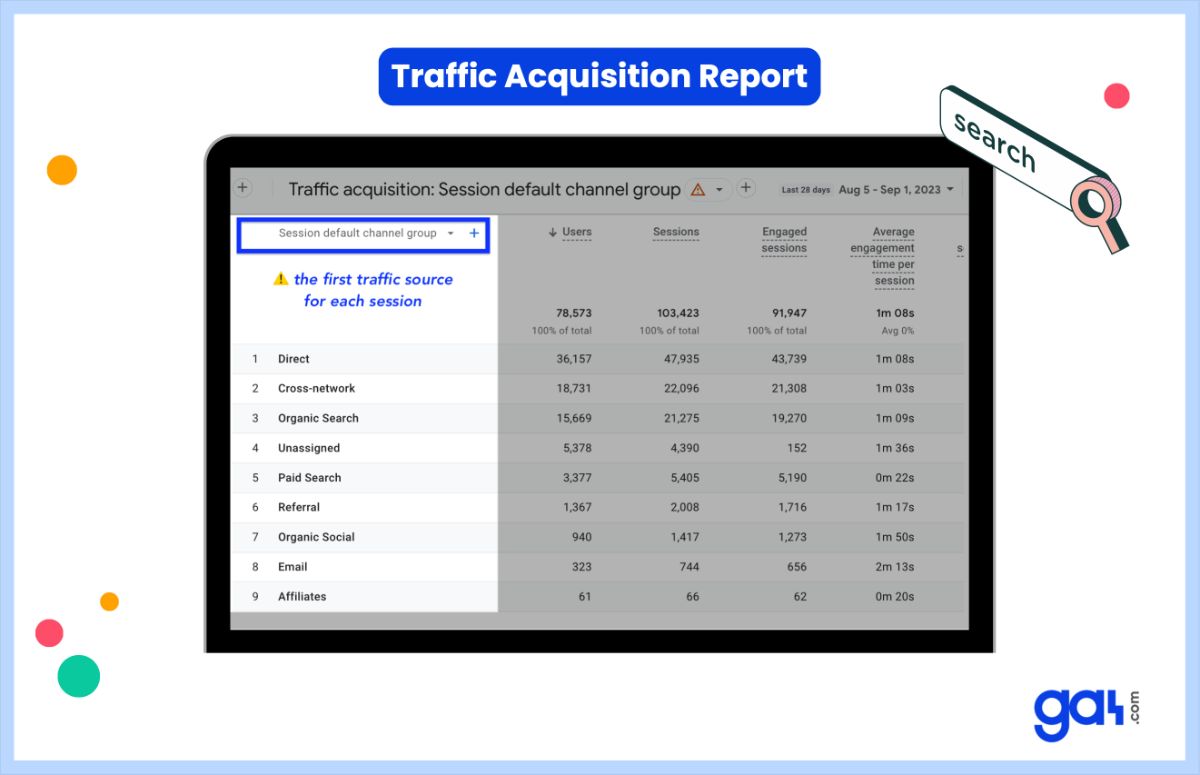
The traffic acquisition report tells you the initial source of traffic for each new session.
You can view where your users came from, such as direct, organic , paid , or social searches, as well as other types of channels.

The traffic acquisition report looks at where the new sessions came from.
For example, the session source dimension shows you the most common sources for new sessions. Therefore, it shows where both new and returning users come from because it includes session-scoped dimensions.
To view traffic acquisition report:
User Acquisition Report
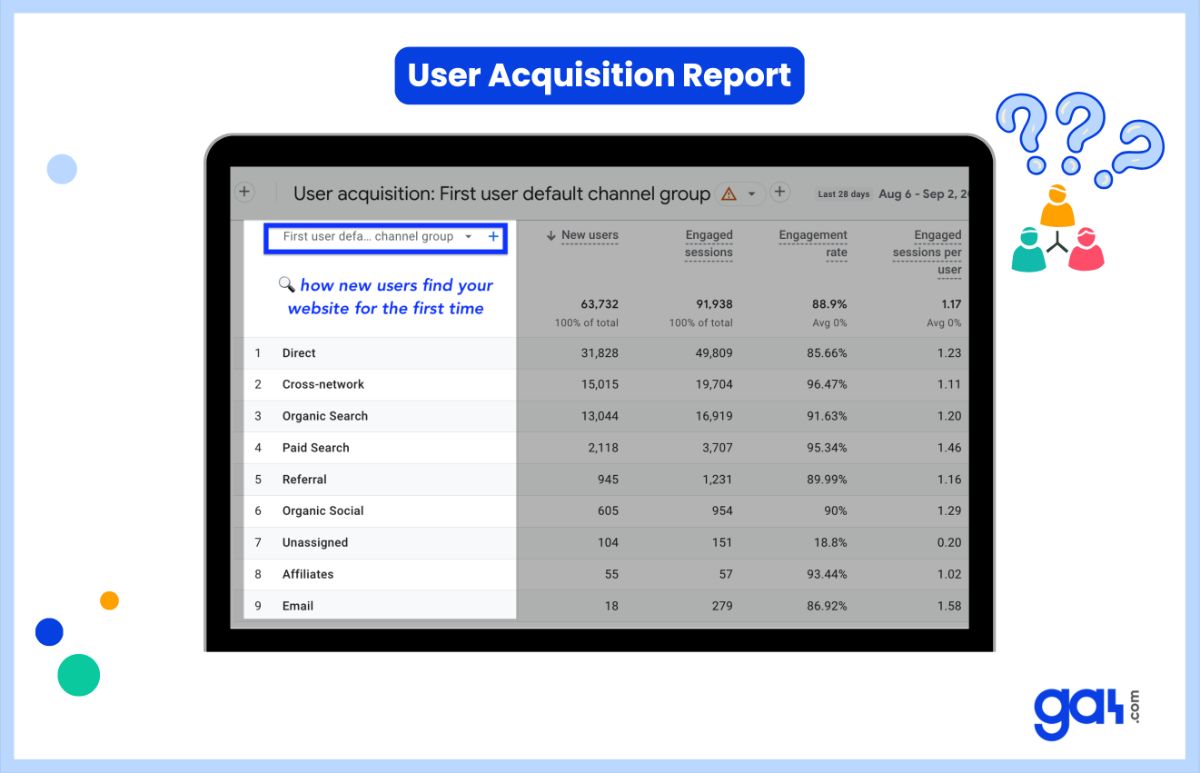
User acquisition report is a user-scoped report that shows you the very first traffic source for each user who visited your website.
For instance, if a user came to your website for the first time using paid search and then returned the following week through organic search, GA4 will only show paid search because that was the user's starting point of interaction.

Thus, GA4's user acquisition report tells you how first-time visitors find your website .
When you look at the report, you will notice that each dimension has the text First user included in it. If the First user source has a value of organic, for example, it indicates that these are users who arrived on your website for the first time via Google Search.
To view user acquisition report:
Conversions Report in Google Analytics 4 (GA4)
The conversions report is the final standard GA4 report that can be used to view data about traffic sources.
This report is event/attribution scoped . Let's clarify this.
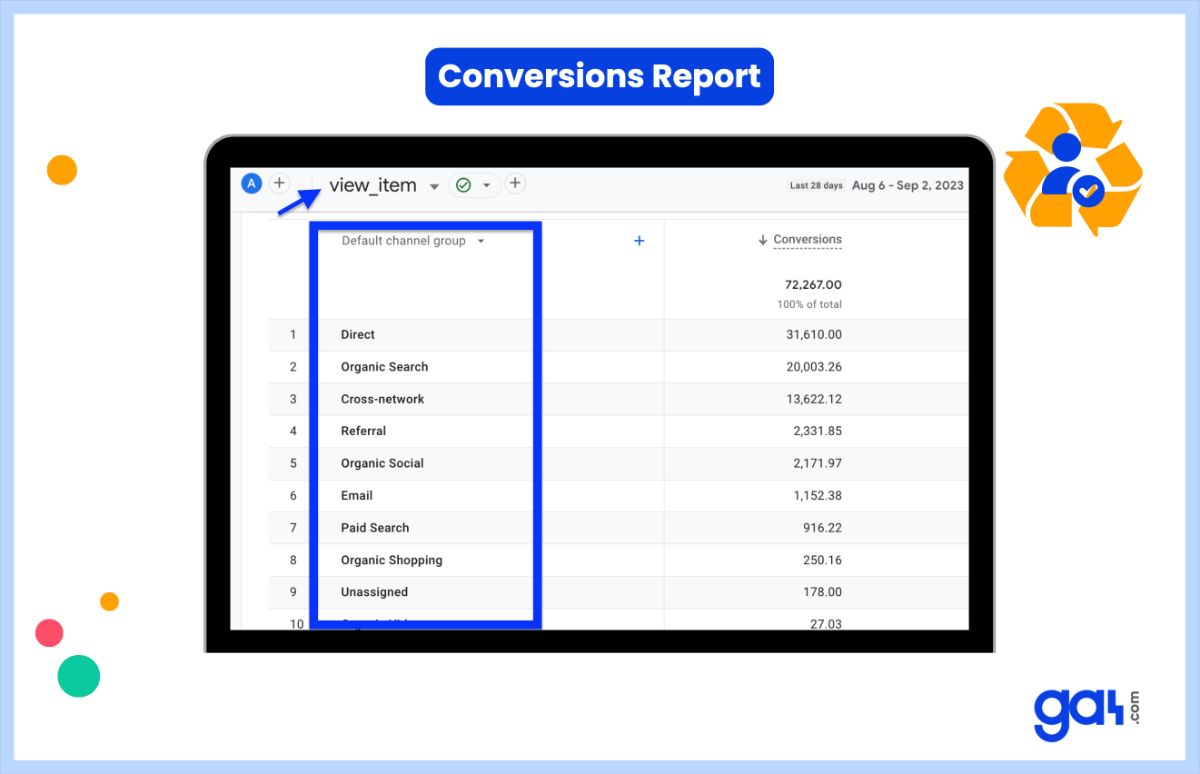
If a user makes a purchase, the conversions report will tell you where this user come from. Since this customer has successfully made a purchase, they have been converted.
As a result, you can see data about traffic sources for every single conversion event. Most people don't realize that attribution (credit) is only given to users who convert.

If you access the conversions report, you will see event names in the first column. When you click on an event, you will be able to view a detailed report for each individual event.
Here, you need to know that event-scoped dimensions only show you the traffic sources for users who converted. Users are excluded from this report if they do not have at least one conversion recorded.
The attribution model you choose affects all reports with event-focused traffic dimensions.
To view conversions report:
Google Analytics lets you collect traffic-source data by manually tagging destination URLs or by integrating with ad platforms and using their auto-tagging features.
We also recommend you to check out Google's documentation on traffic-source dimensions , manual tagging, and auto-tagging.
In conclusion, we can't say exactly how many users came from a source in the GA4 interface.
It is unfortunate that these reports cause you to miss some traffic from sessions that contain multiple traffic sources within the same session.
FAQ
Conclusion: Traffic Sources in Google Analytics 4 (GA4)
Google Analytics 4 offers three main reports to understand where your website traffic comes from: Traffic Acquisition, User Acquisition, and Conversions reports.
Each provides different insights based on sessions, users, or conversion events.
The Traffic Acquisition report shows you the source of each new session, User Acquisition shows how first-time visitors find your site, and the Conversions report connects traffic sources to specific conversion events.
