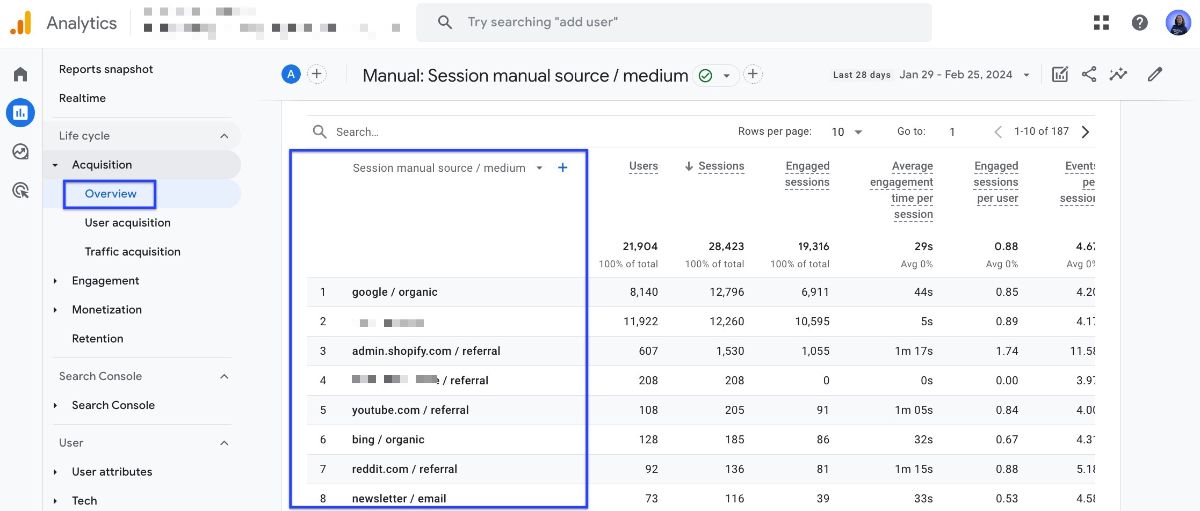
GA4 has released a set of manual traffic source dimensions and the manual report that allow you to see where your traffic comes from including campaign IDs and the specific type of content that generates clicks.
This isn't just another minor update; it's a significant step forward for cross-channel analytics.

Why Is The Manual Source Dimensions in GA4 Update Is Important
Manual sources in GA4 provide a more accurate picture of how different campaigns perform.
In simpler terms, GA4 is giving us tools to identify not only the general categories such as search engines or socials but also the specifics of campaigns.
Let's explore more details!
What Is GA4 Manual Source?
GA4 now includes eight new dimensions and their variations obtained from paid ads, organic search, and other sources. These manual source dimensions work across multiple platforms and can be customized based on the user, session, or specific events.
Here's a breakdown of each dimension and how it's populated:
|
Manual Source Dimensions |
Explanation |
|---|---|
|
Manual source |
Identifies the origin of traffic, such as a specific search engine or a domain such as “google” and “tiktok.com”. |
|
Manual medium |
Specifies the type of traffic which might include socials, email, CPC (cost per click), etc. |
|
Manual source/medium |
Combines the source and medium for a comprehensive view of the traffic's origin. |
|
Manual campaign name |
Names the marketing campaign associated with the traffic. |
|
Manual campaign ID |
Uses a unique identifier to track and compare campaigns. |
|
Manual term |
Identifies the keywords in paid search driving the traffic. |
|
Manual content |
Differentiates between ads or links that direct to the same URL, but are placed in different locations. It’s useful for A/B testing and finding certain ad elements like CTAs. |
|
Manual source platform |
Indicates the platform from which the traffic originated, particularly useful for mobile app analytics. |
How To View Manual Campaigns in GA4?
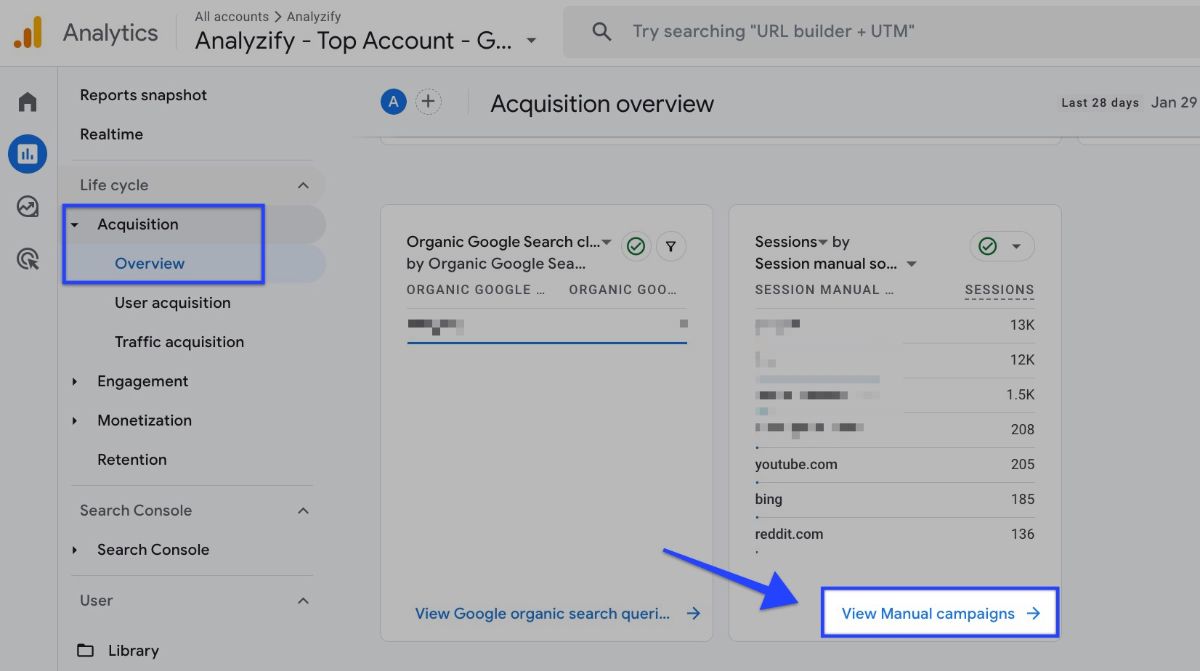
To view the report, first navigate to the Acquisition overview report, then scroll down and click on View Manual campaigns . If you don't see the manual report, here's how to add a report to your GA4 dashboard .

Manual Traffic Source Dimensions and Metrics
Along with the acquisition overview report, you can create an exploration report and add these metrics.
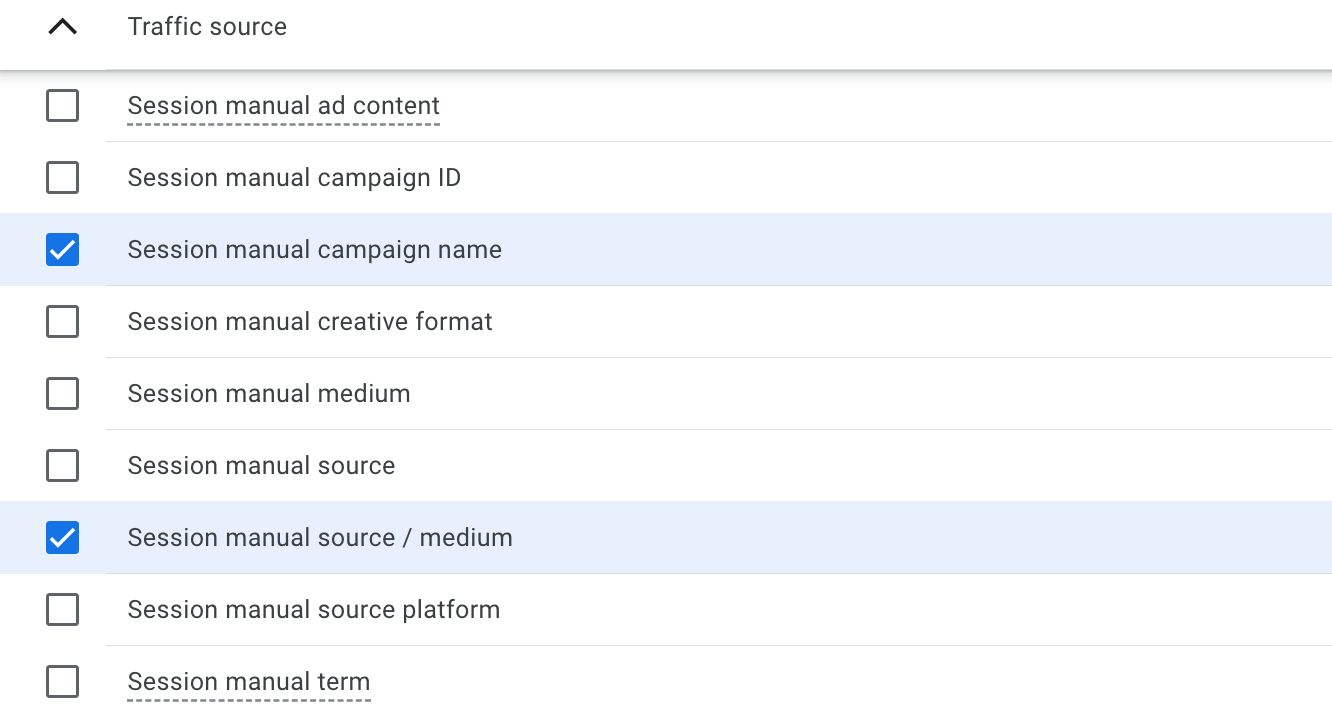
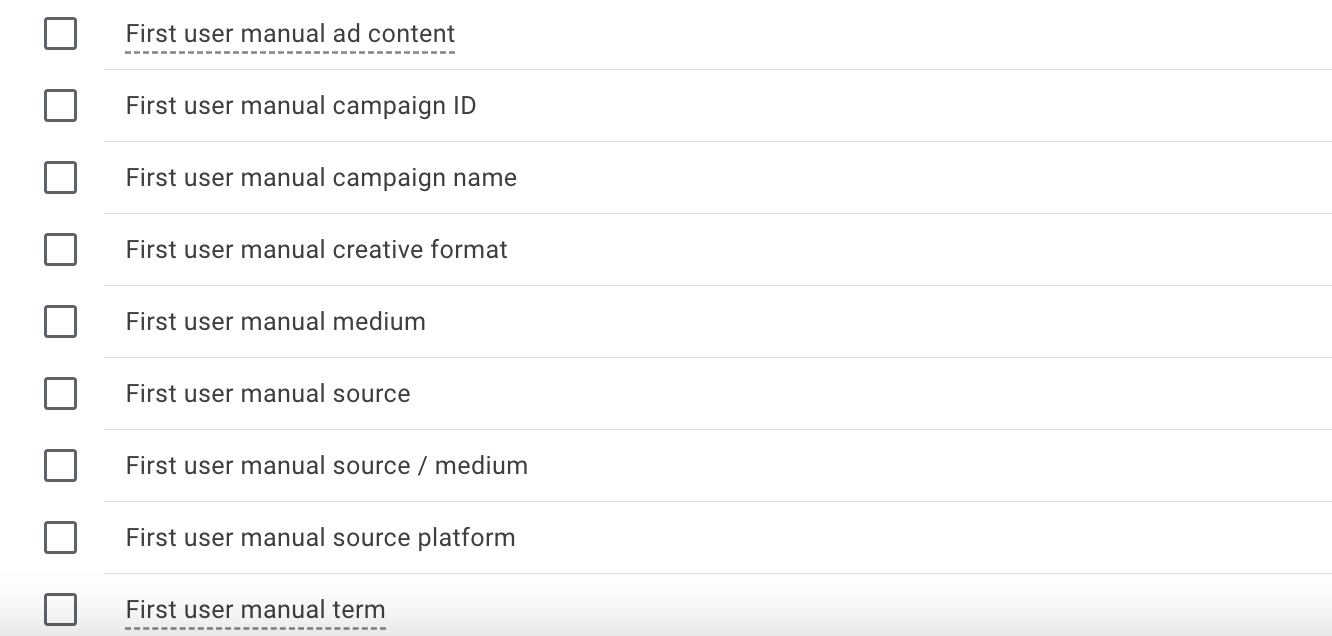
With this manual source release, there are now a number of new options available when creating an exploration :
➜ Session Manual Dimensions

➜ First User Manual Dimensions

In the manual report, you can find the following metrics, as well as common metrics used in other reports:
- Cost per conversion (How much you paid per click on average for your ad campaign.)
- Cost (How much you spent on your whole ad campaign.)
- Return on Ad Spend (The total revenue earned from ads for every dollar spent.)
- Clicks (The total number of times users clicked on your ads.)
- Users (Any user who has an engaged session.)
Learn more about manual source dimensions and metrics in the official Google support page.
How Are Manual Source Dimensions Populated?
These dimensions are populated with UTM parameter values embedded in click URLs, as well as new UTM values passed in the campaign_details event for mobile apps specifically:
- FirebaseAnalytics.Param.CAMPAIGN_ID,
- FirebaseAnalytics.Param.SOURCE_PLATFORM.
This method ensures that traffic source data is captured accurately and reflects campaign-specific details.
🚨 Keep in mind that these metrics will show up in the manual report once you've linked your advertiser to your property successfully. Follow this tutorial to link your Google Ads with GA4.
Initially, it was harder to get this much information. Now, the manual report in GA4 useful for you to get a deeper understanding of your digital marketing campaigns.
Conclusion
To wrap up, GA4's manual source dimensions transform how you analyze traffic by offering insights into where your visitors come from and how they interact with your campaigns.
With detailed tracking through UTM parameters, you can now pinpoint which strategies are driving results and optimize your marketing efforts with confidence.
