Tracking email campaigns and traffic in GA4 can provide you with valuable insights into how you are performing in terms of email campaigns.
To analyze email traffic, you need to create a new report which displays all the information within 9 different tabs in GA4's Explorations section.
Therefore, you can have a detailed report that looks something like this:
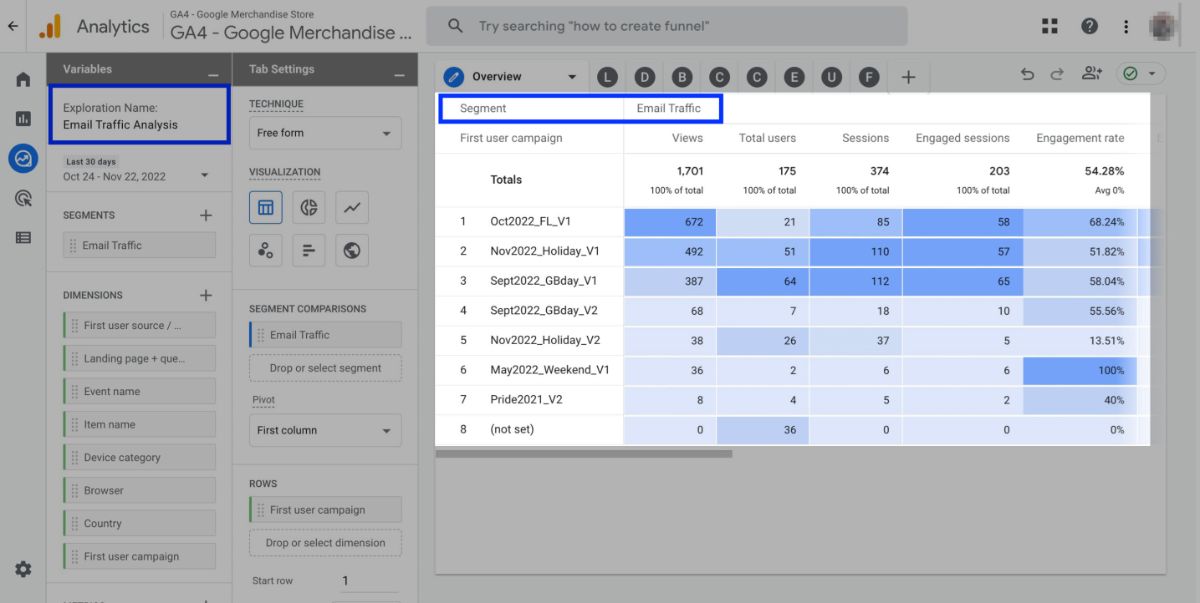
In this guide, you will learn step by step how to create this kind of exploration for email tracking in GA4.
Here is what those tabs will include:
- Overview, displaying a general picture of each marketing campaign
- Landing Pages, showing the performance of your landing pages from email traffic
- Devices, demonstrating the performance of devices such as desktop, mobile, smart TV, etc. that provided email traffic to your website
- Browsers, presenting the performance of web browsers that provided email traffic to your website
- Countries, showing the countries that generated email traffic to your website
- Conversions, providing all the conversions created by email traffic on your website
- Ecommerce, revealing the ecommerce performance of email traffic to your website
- User Flow, demonstrating how the email traffic is using your website
- Funnel, displaying how the email traffic is converting on your website
Important: To start creating email tracking reports in Google Analytics 4, you first need to create a report named ‘Organic Traffic Analysis’ in the Explorations section. Then, you will use it as a template for the email tracking report.
Now, follow the steps below to go ahead and create Organic Traffic Analysis first.
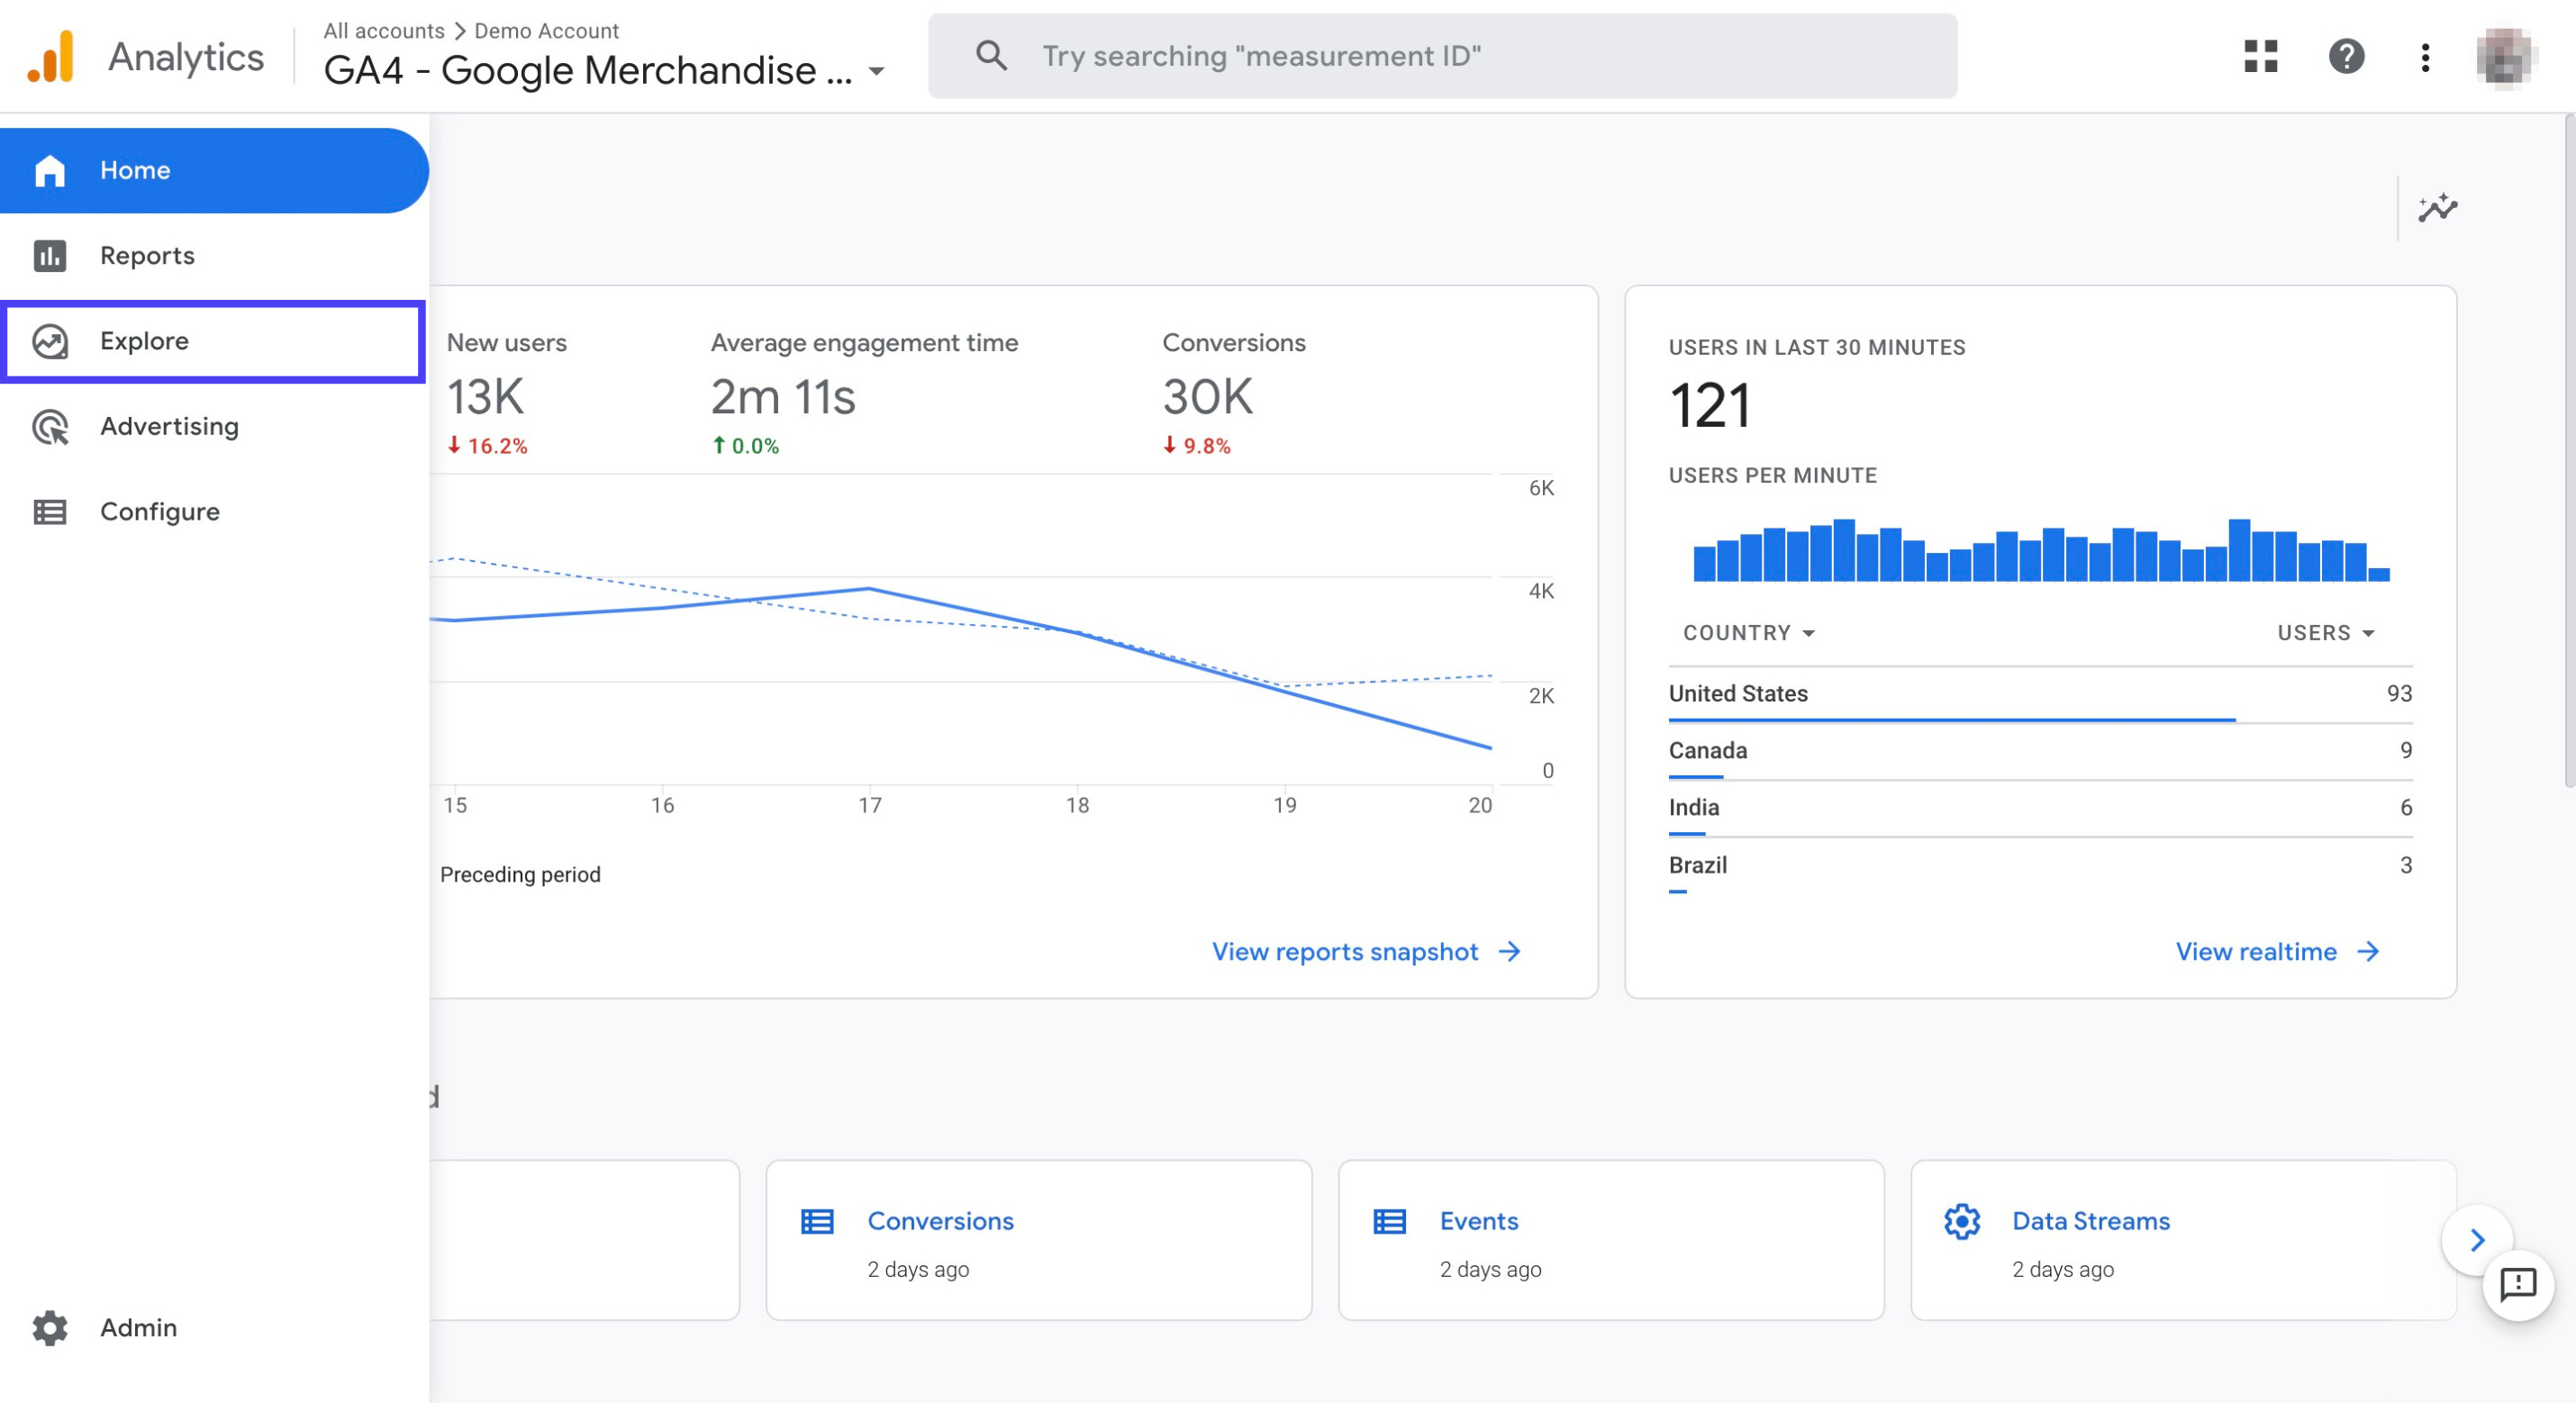
Go to your Google Analytics 4 property, and find 'Explore' on the left menu.
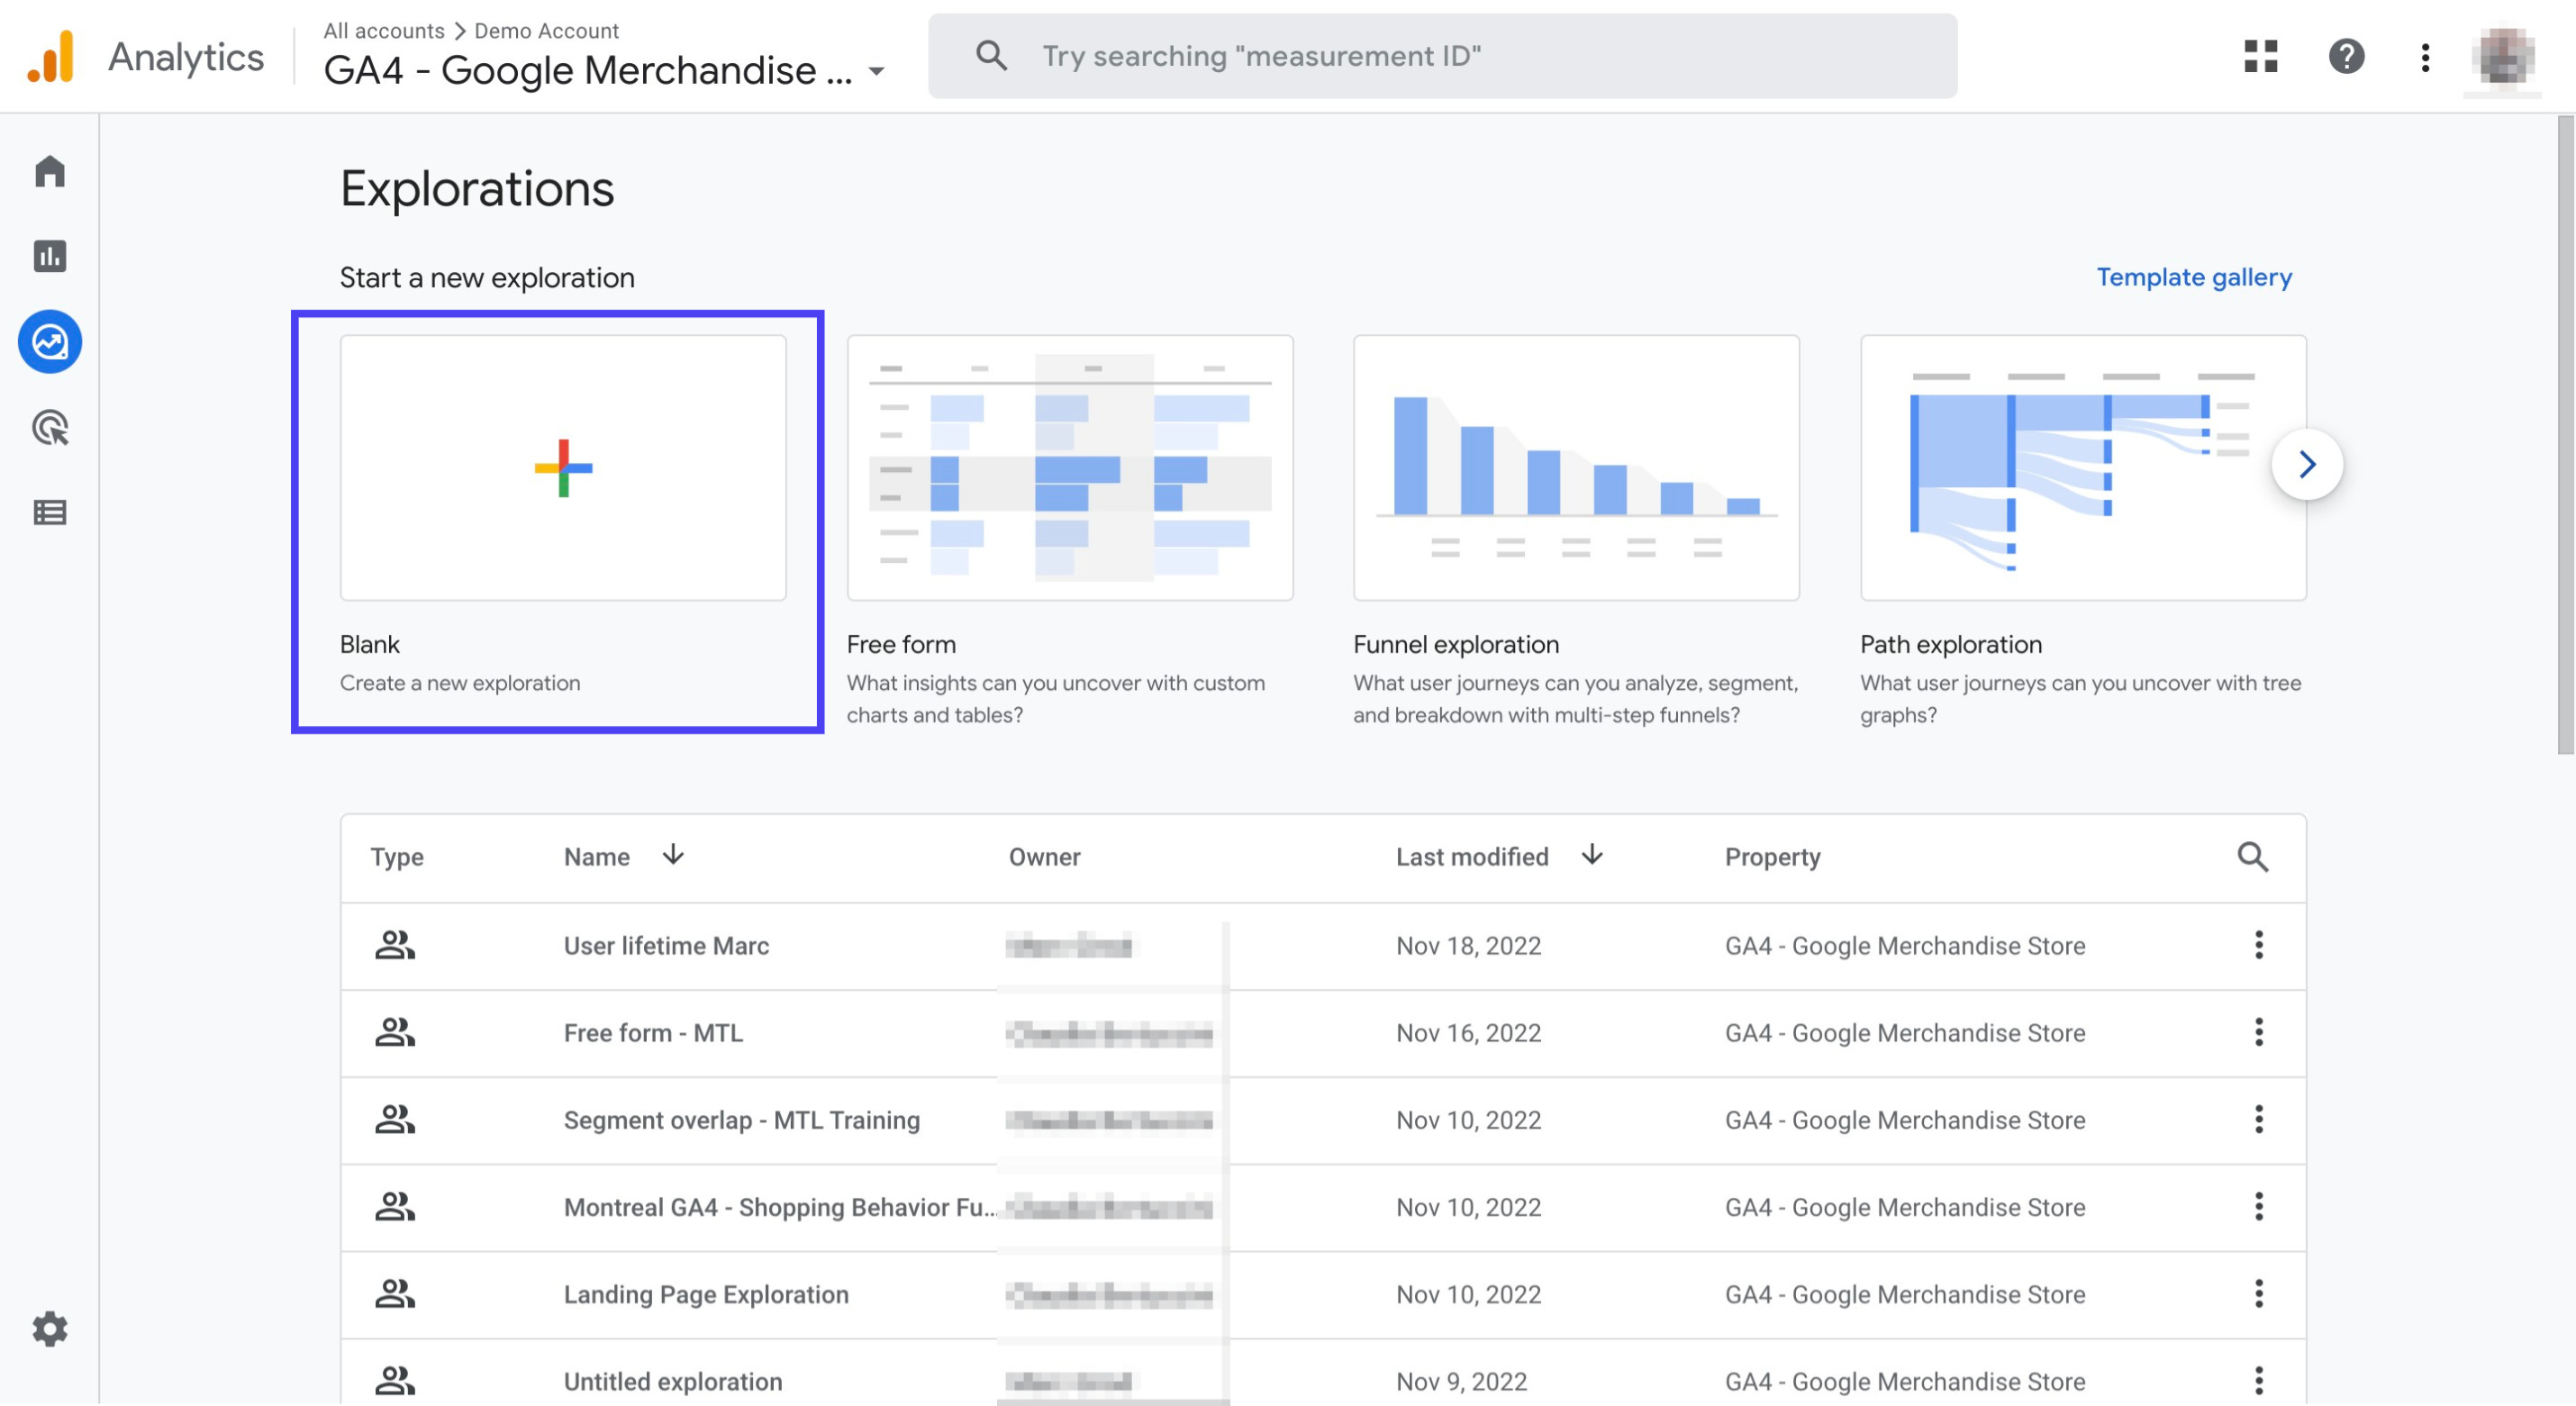
Click the '+' sign on the blank report
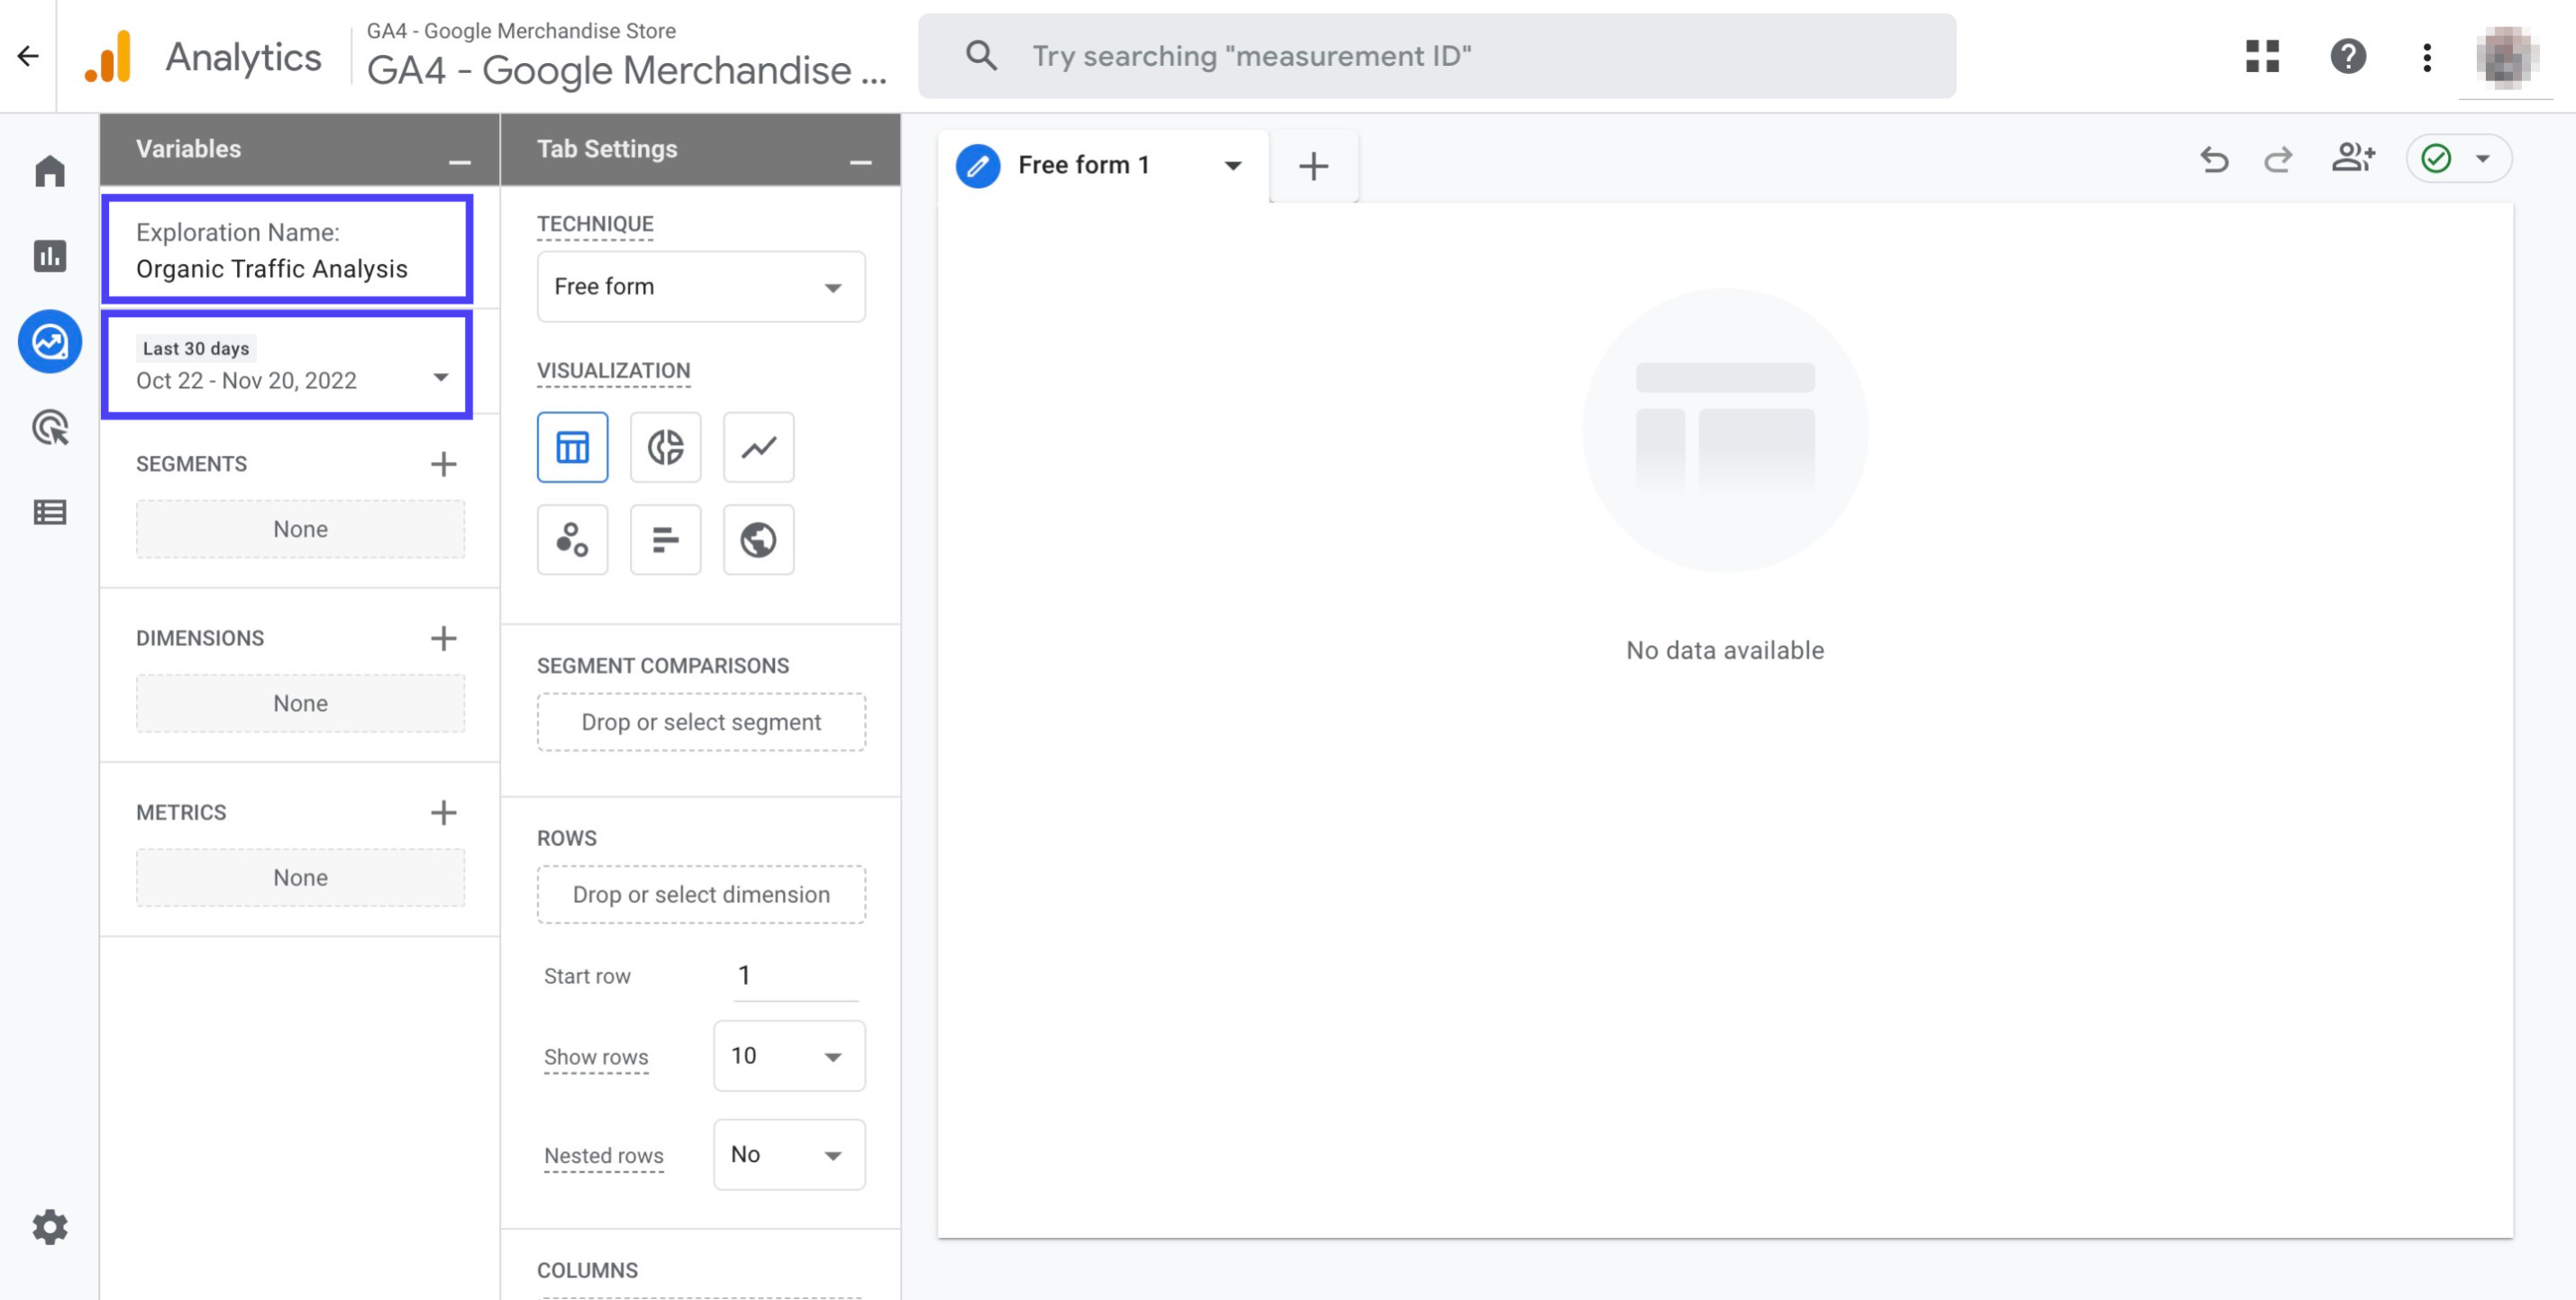
Name your report as 'Organic Traffic Analysis' and set the date range to 'Last 30 Days' under Variables on the upper left corner
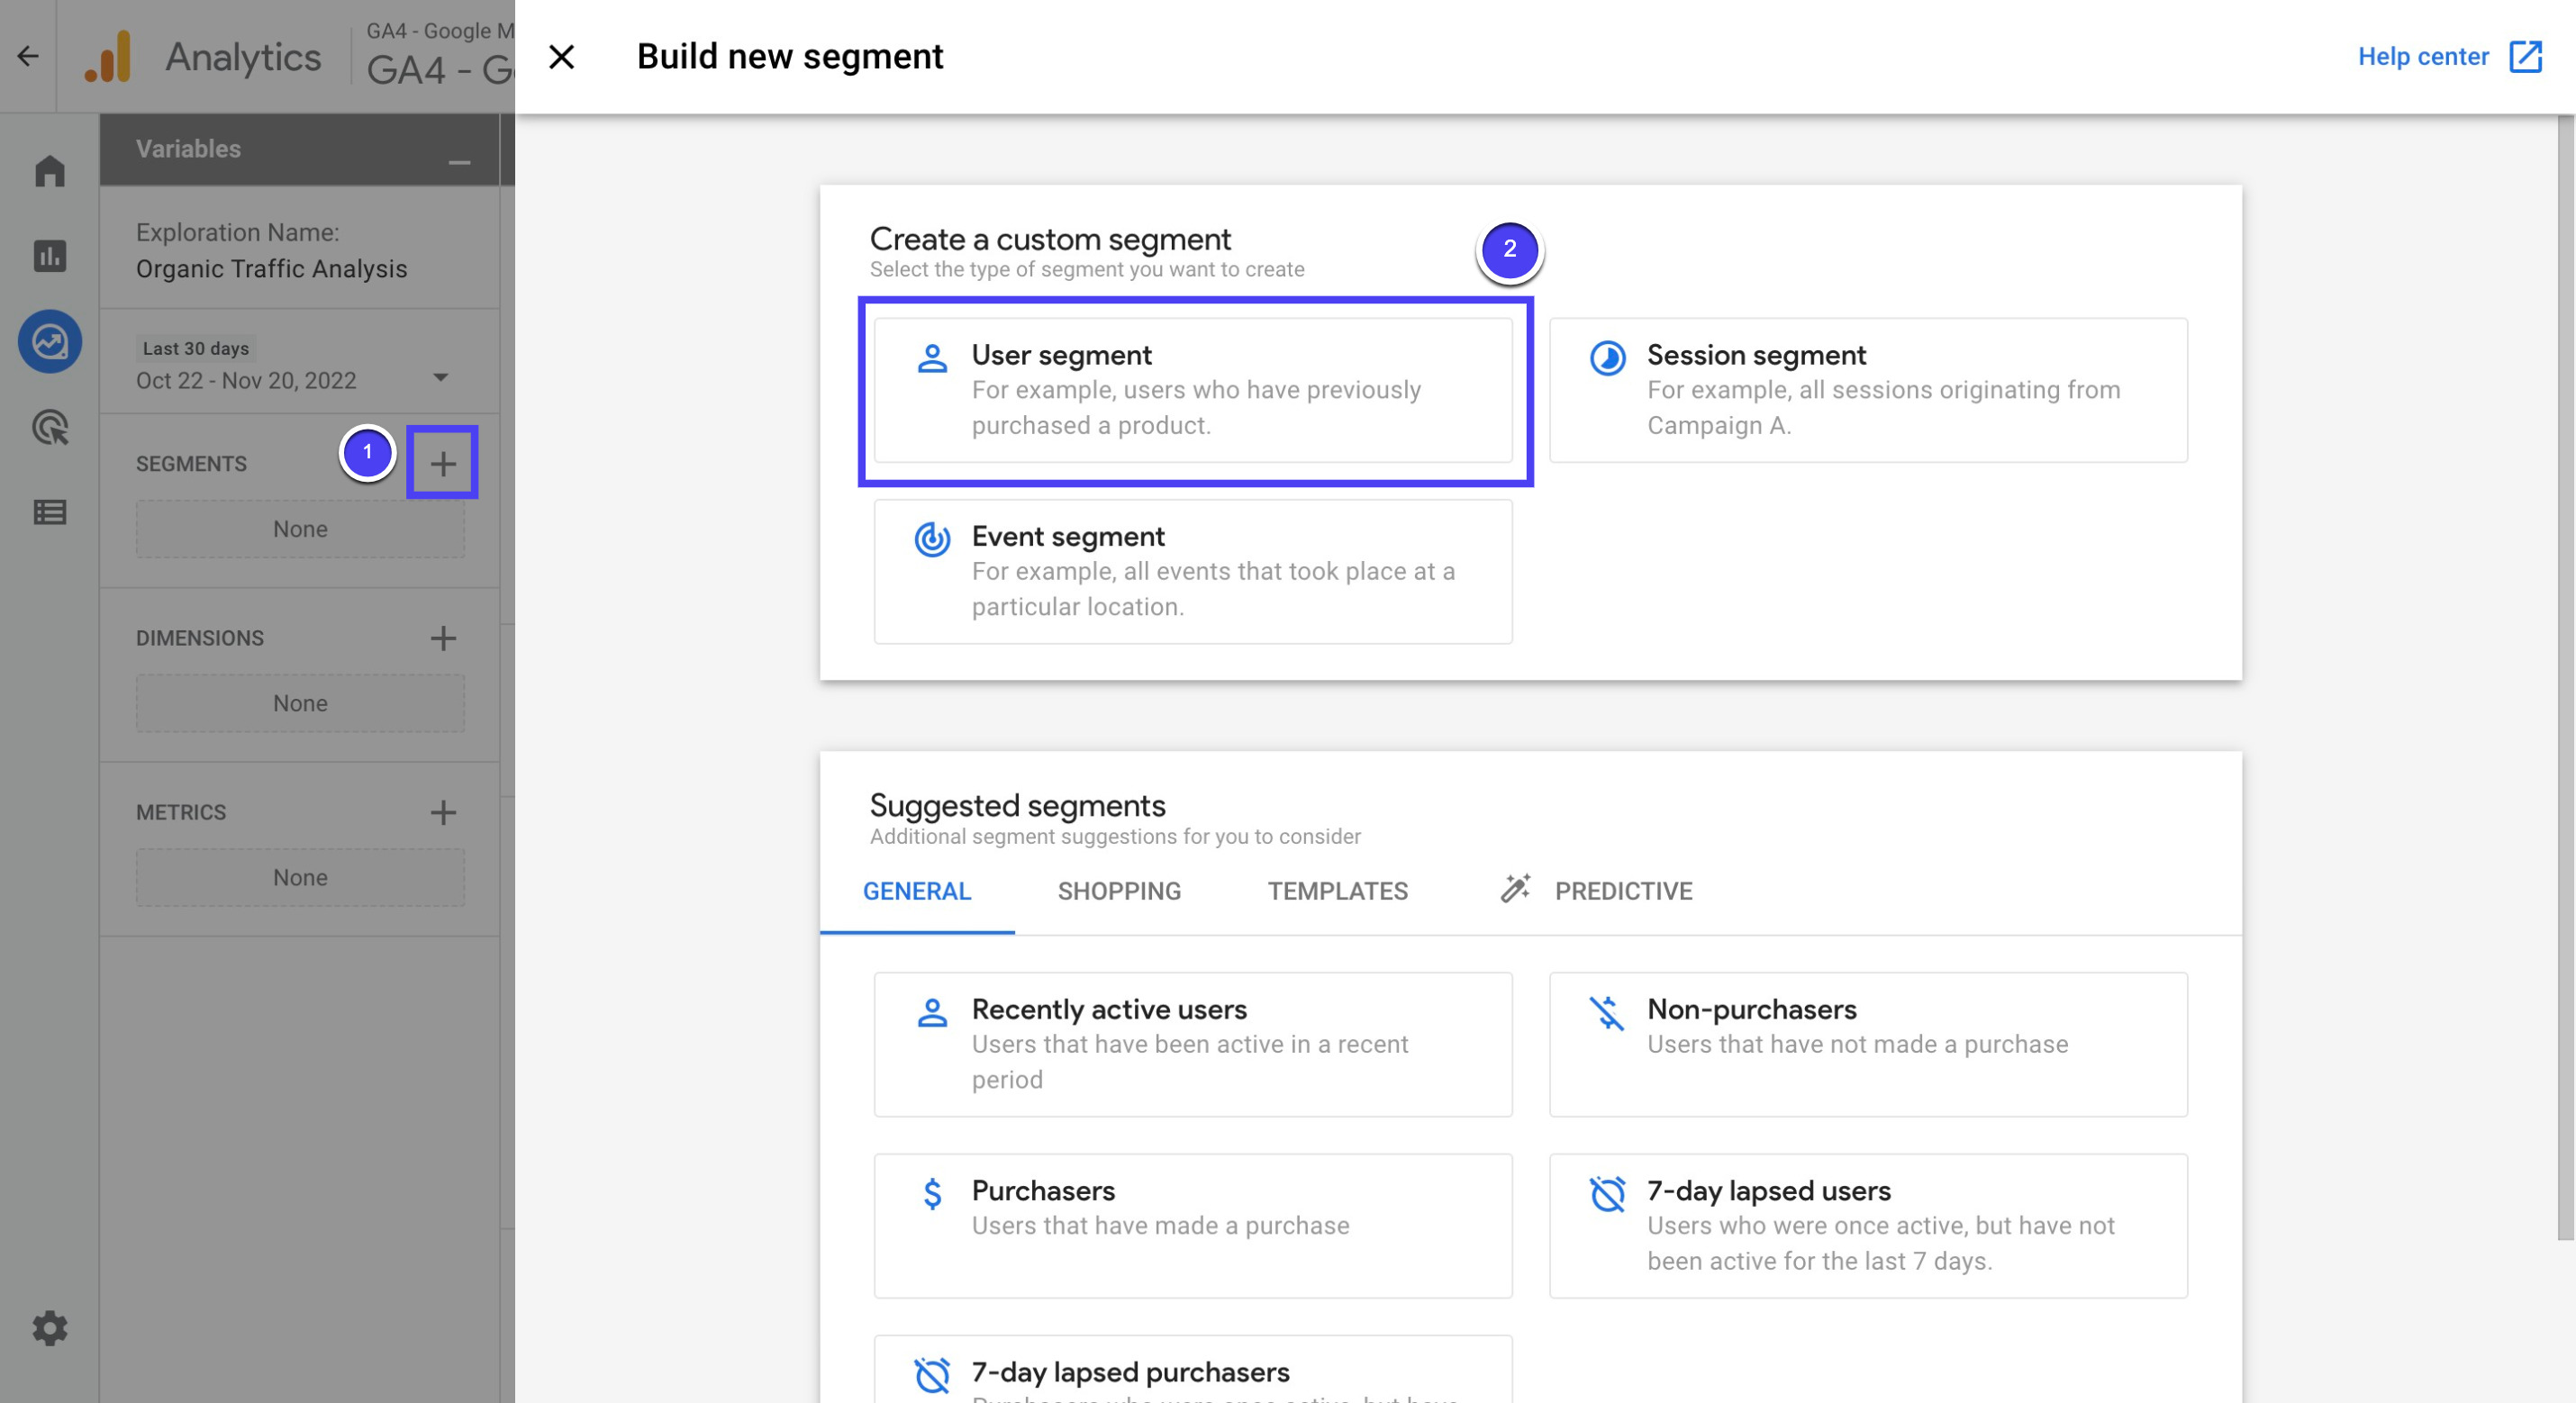
Click the '+' next to 'Segments' and then choose 'User segment'
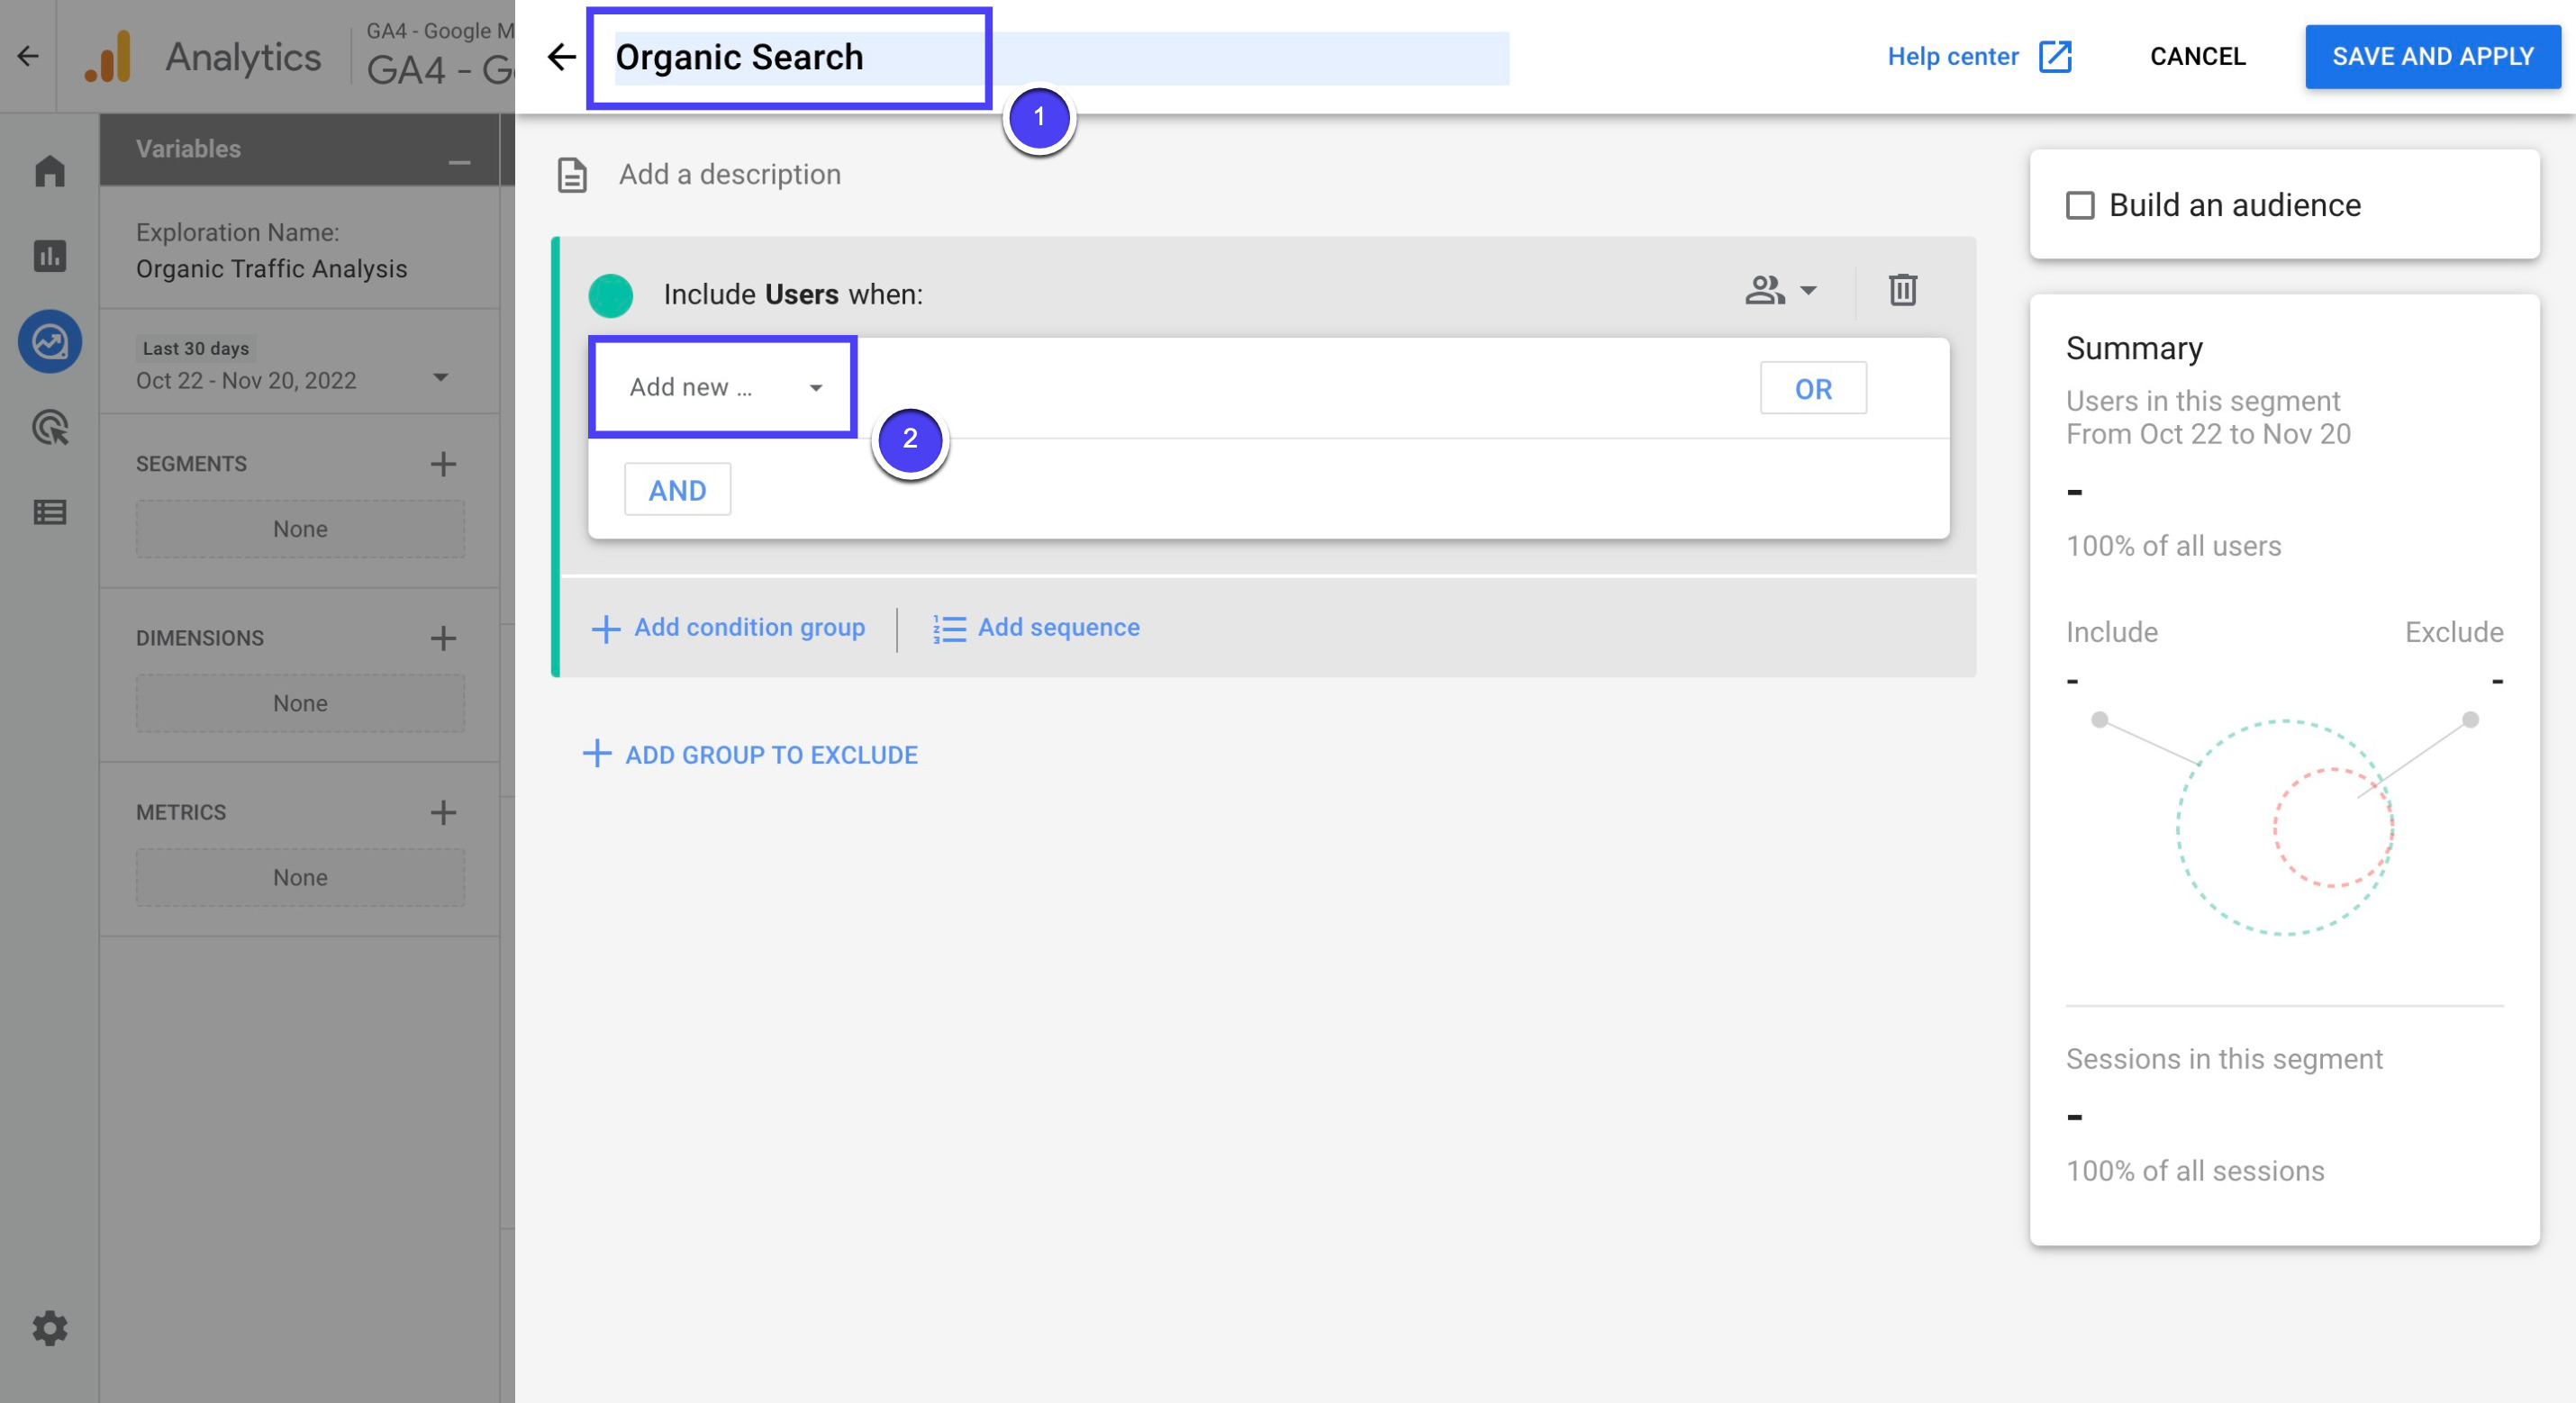
Name the new segment as 'Organic Search' and then click on 'Add new...'
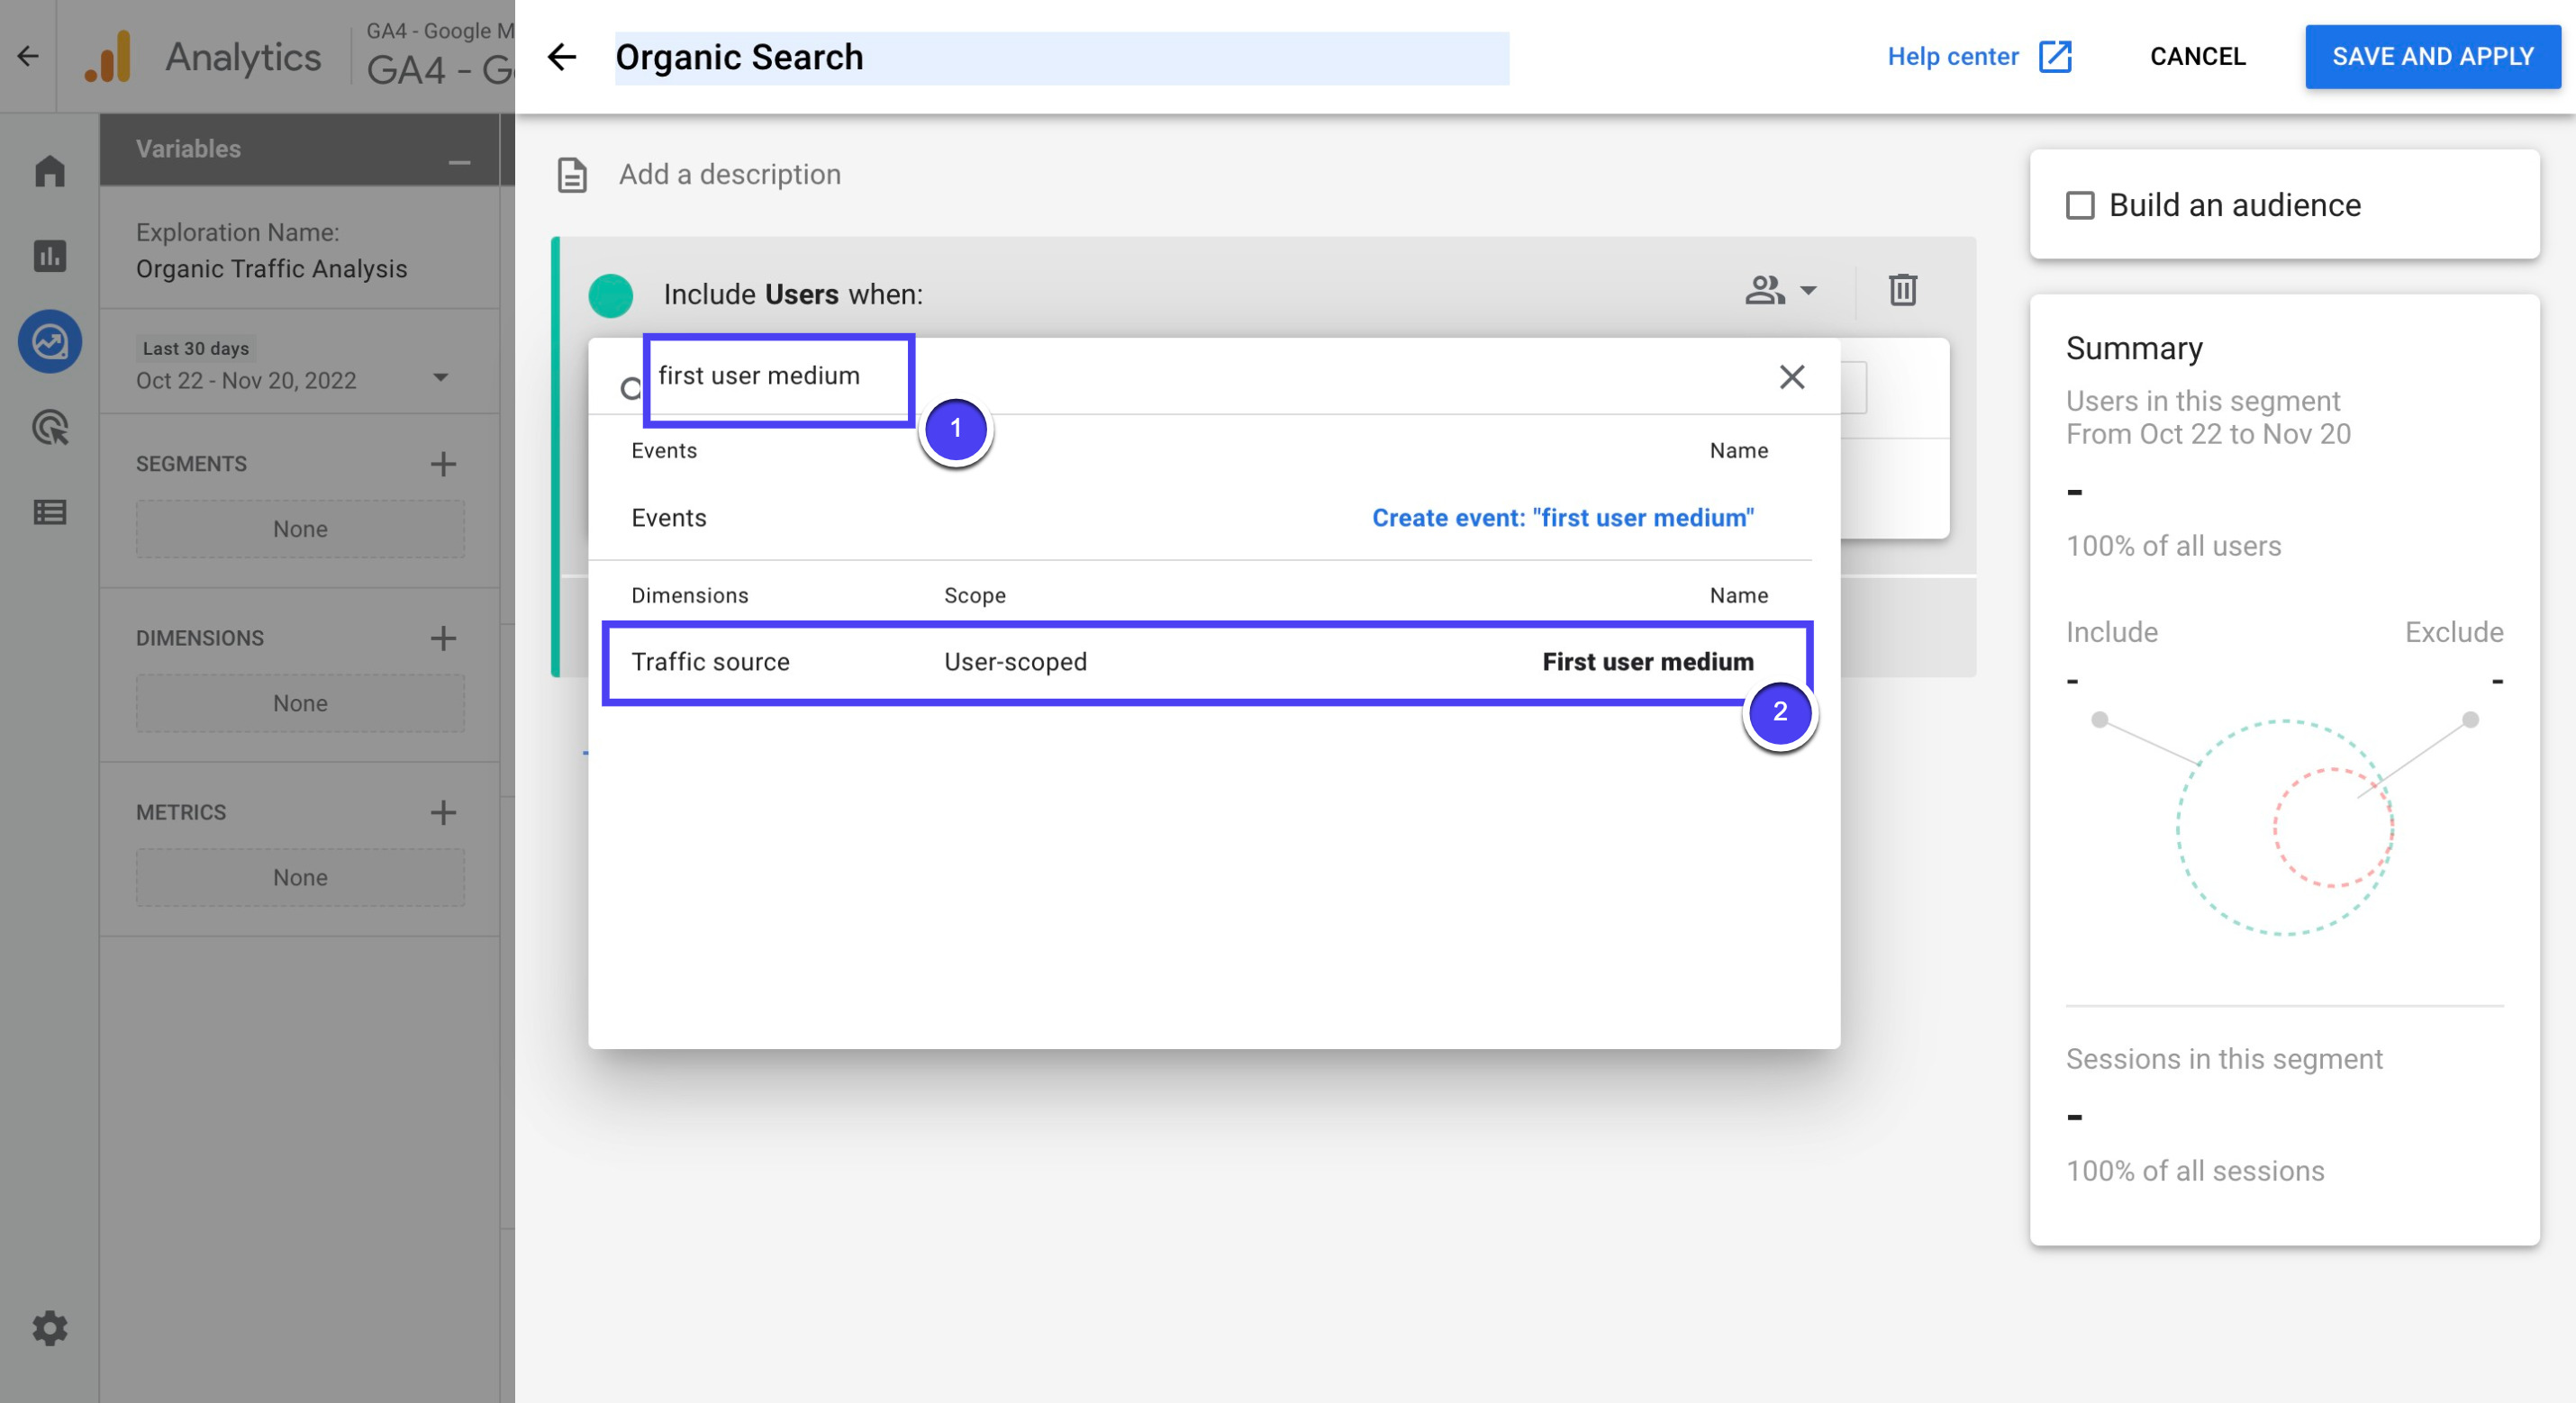
Search for 'First user medium', then click on it when it appears in the search result
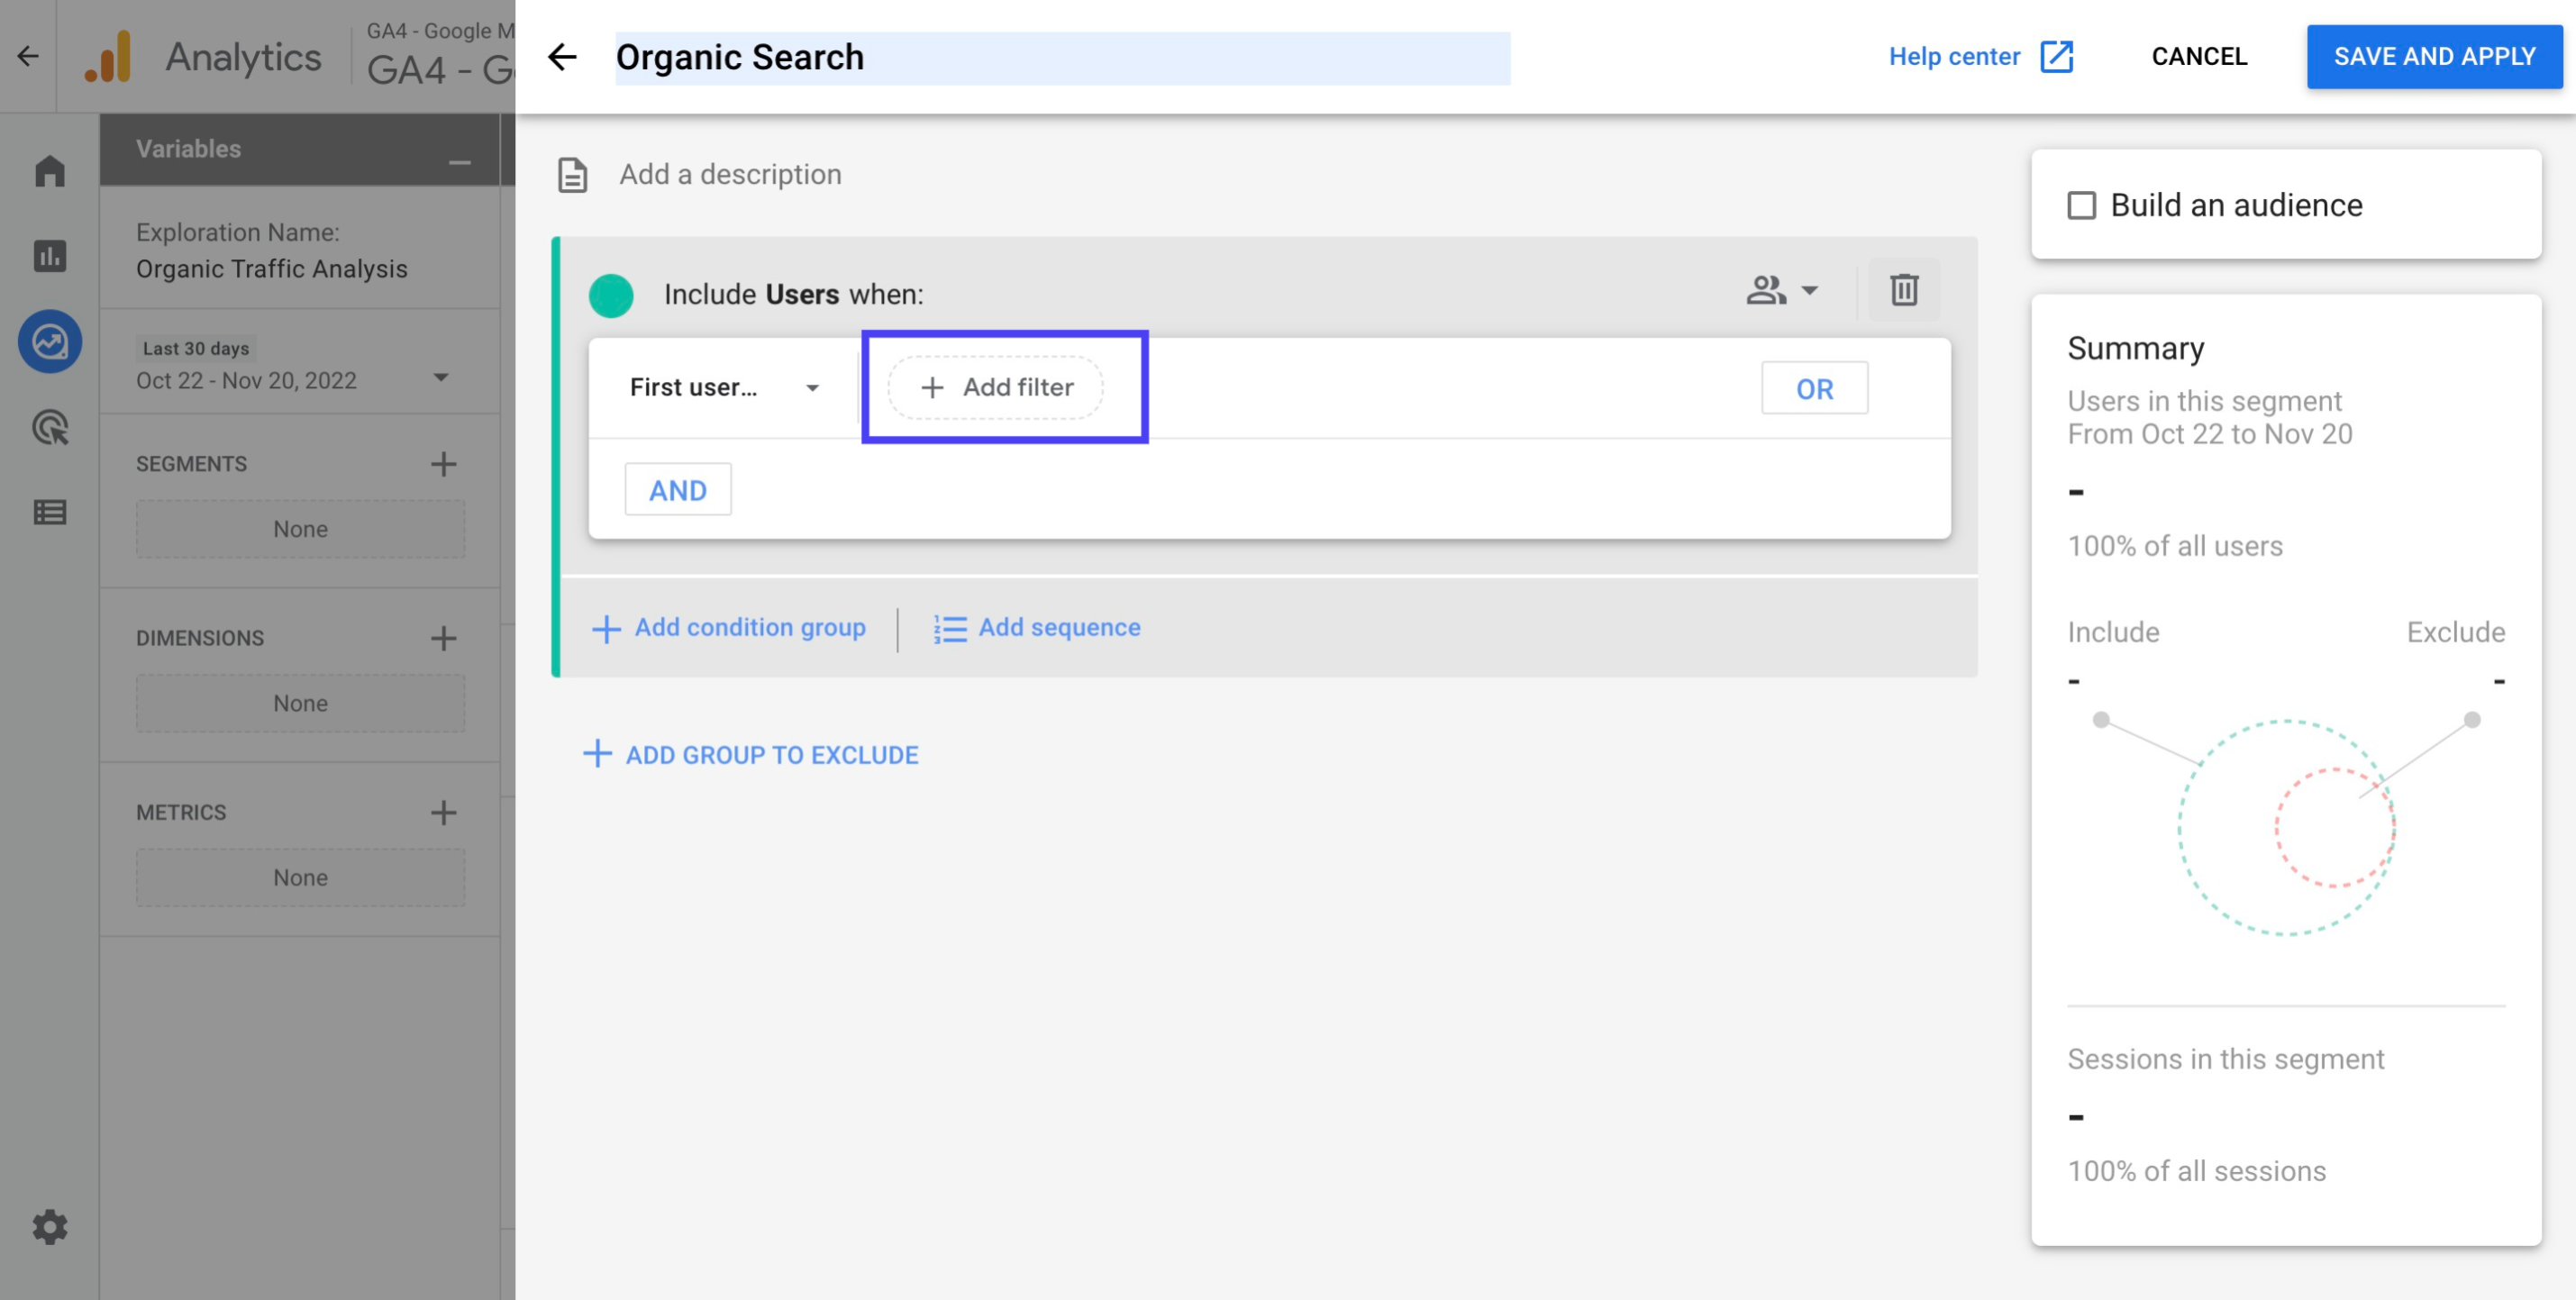
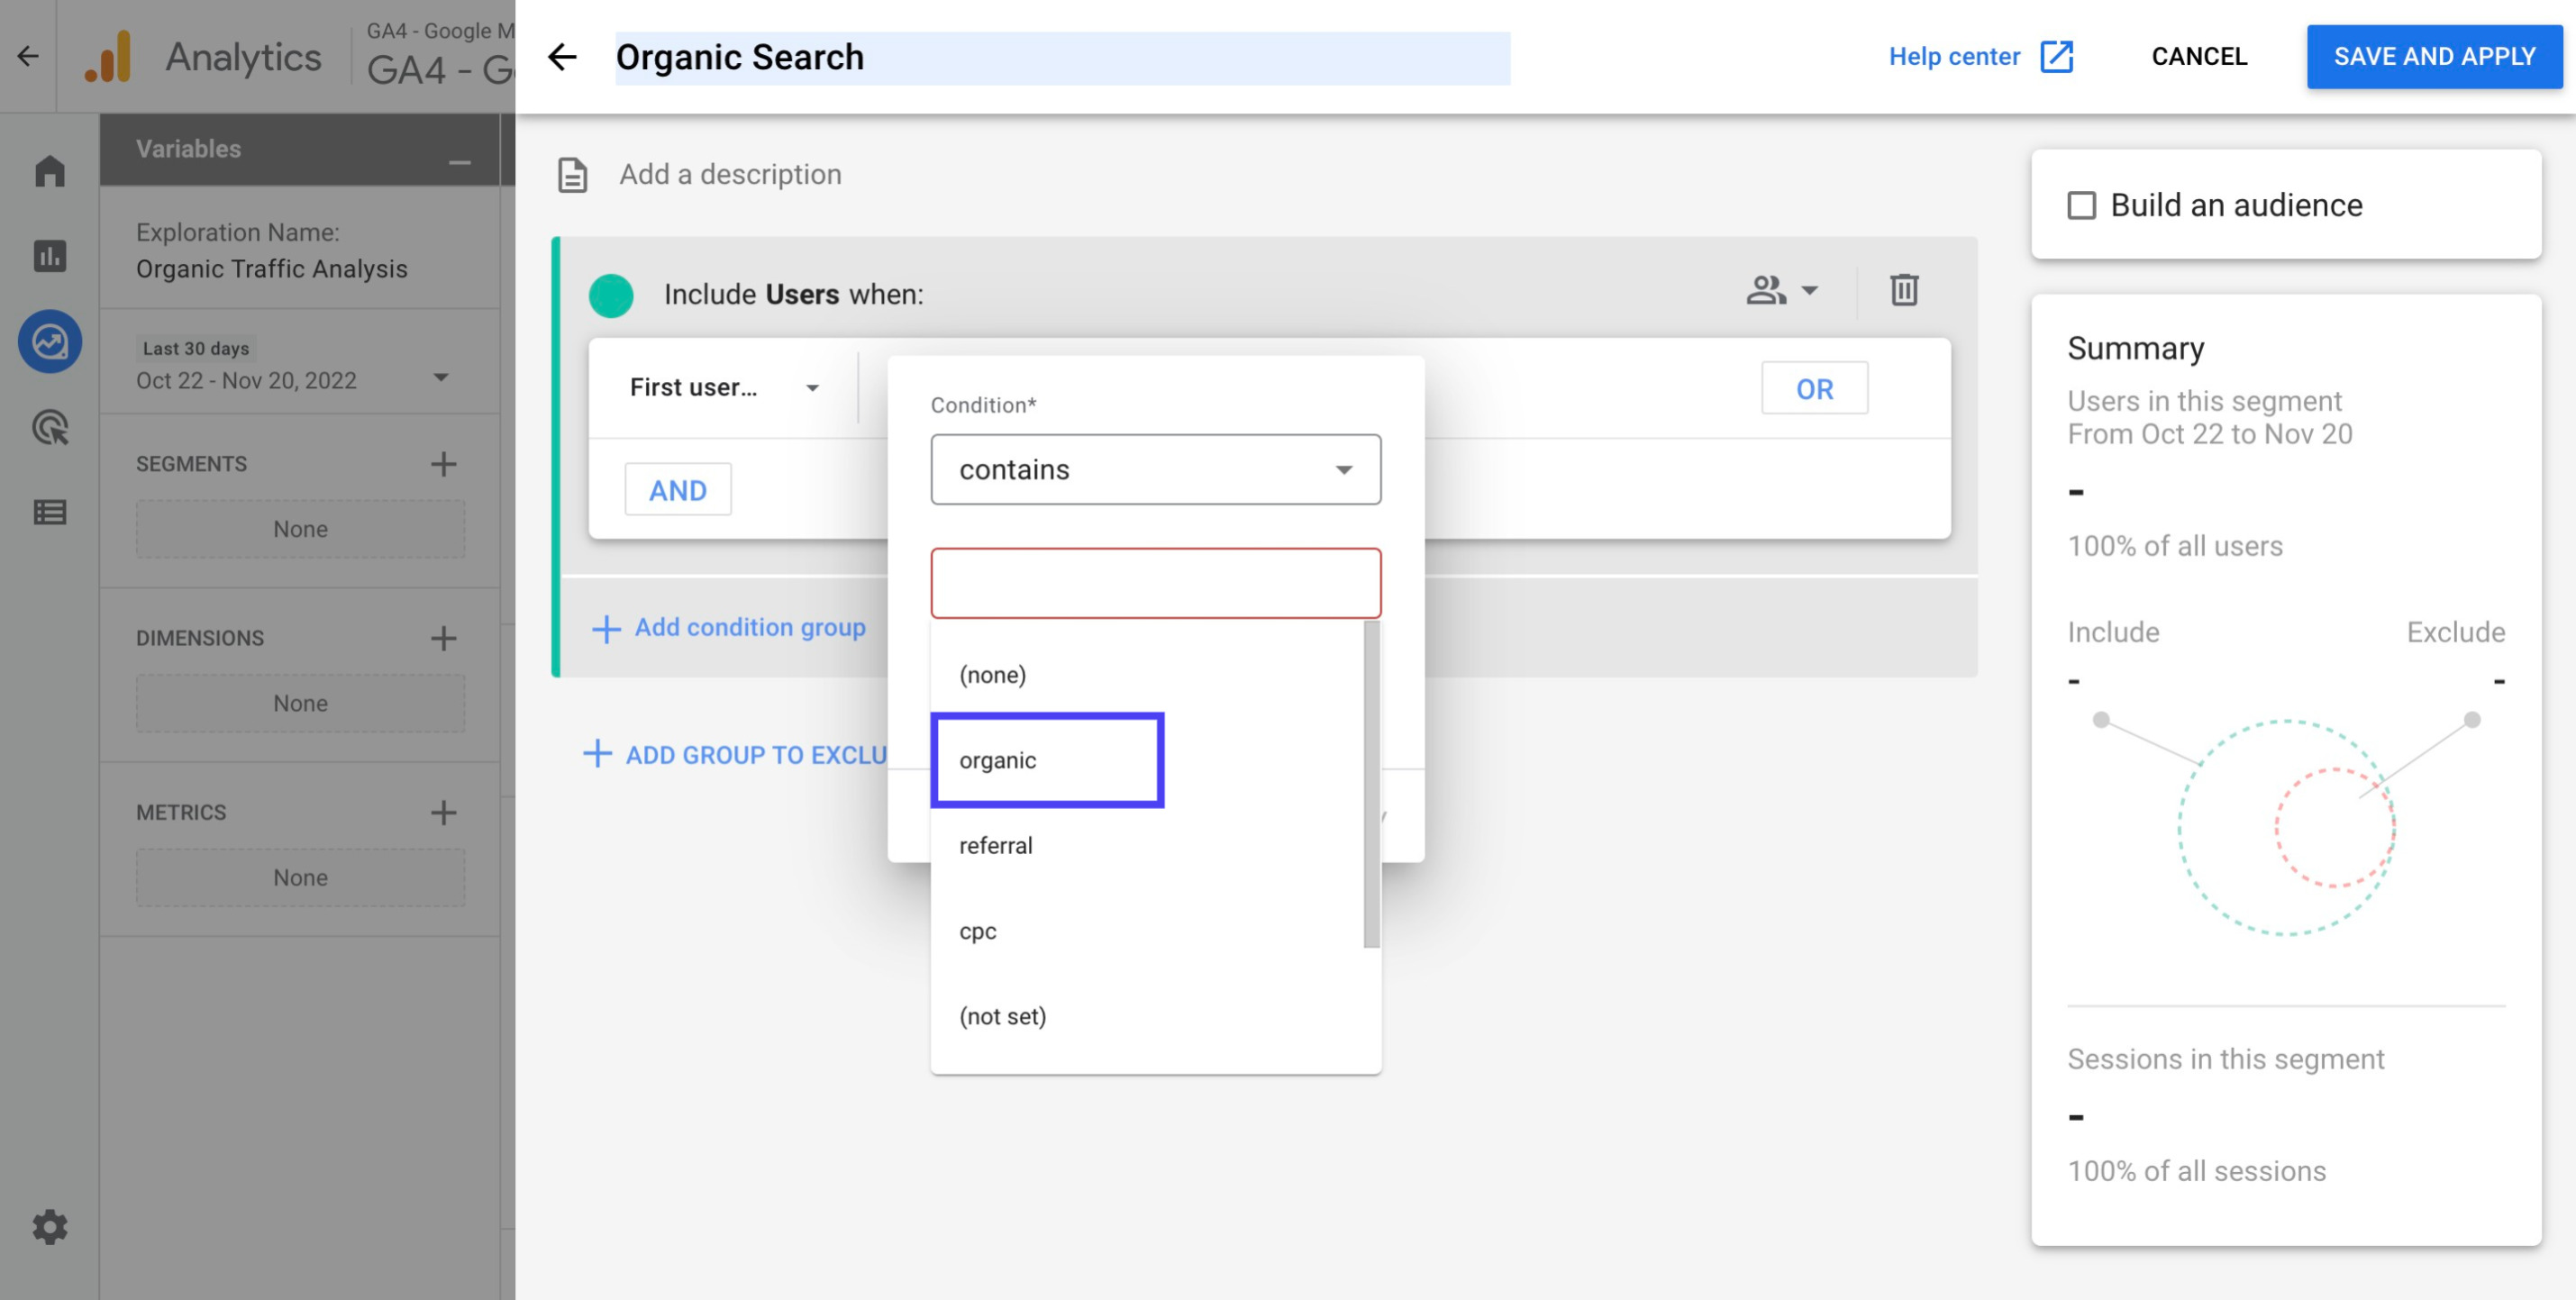
Click on 'Add filter'
First, click on the text box under 'contains'. Second, choose 'Organic' from the list that shows up. Then, click 'Apply' below
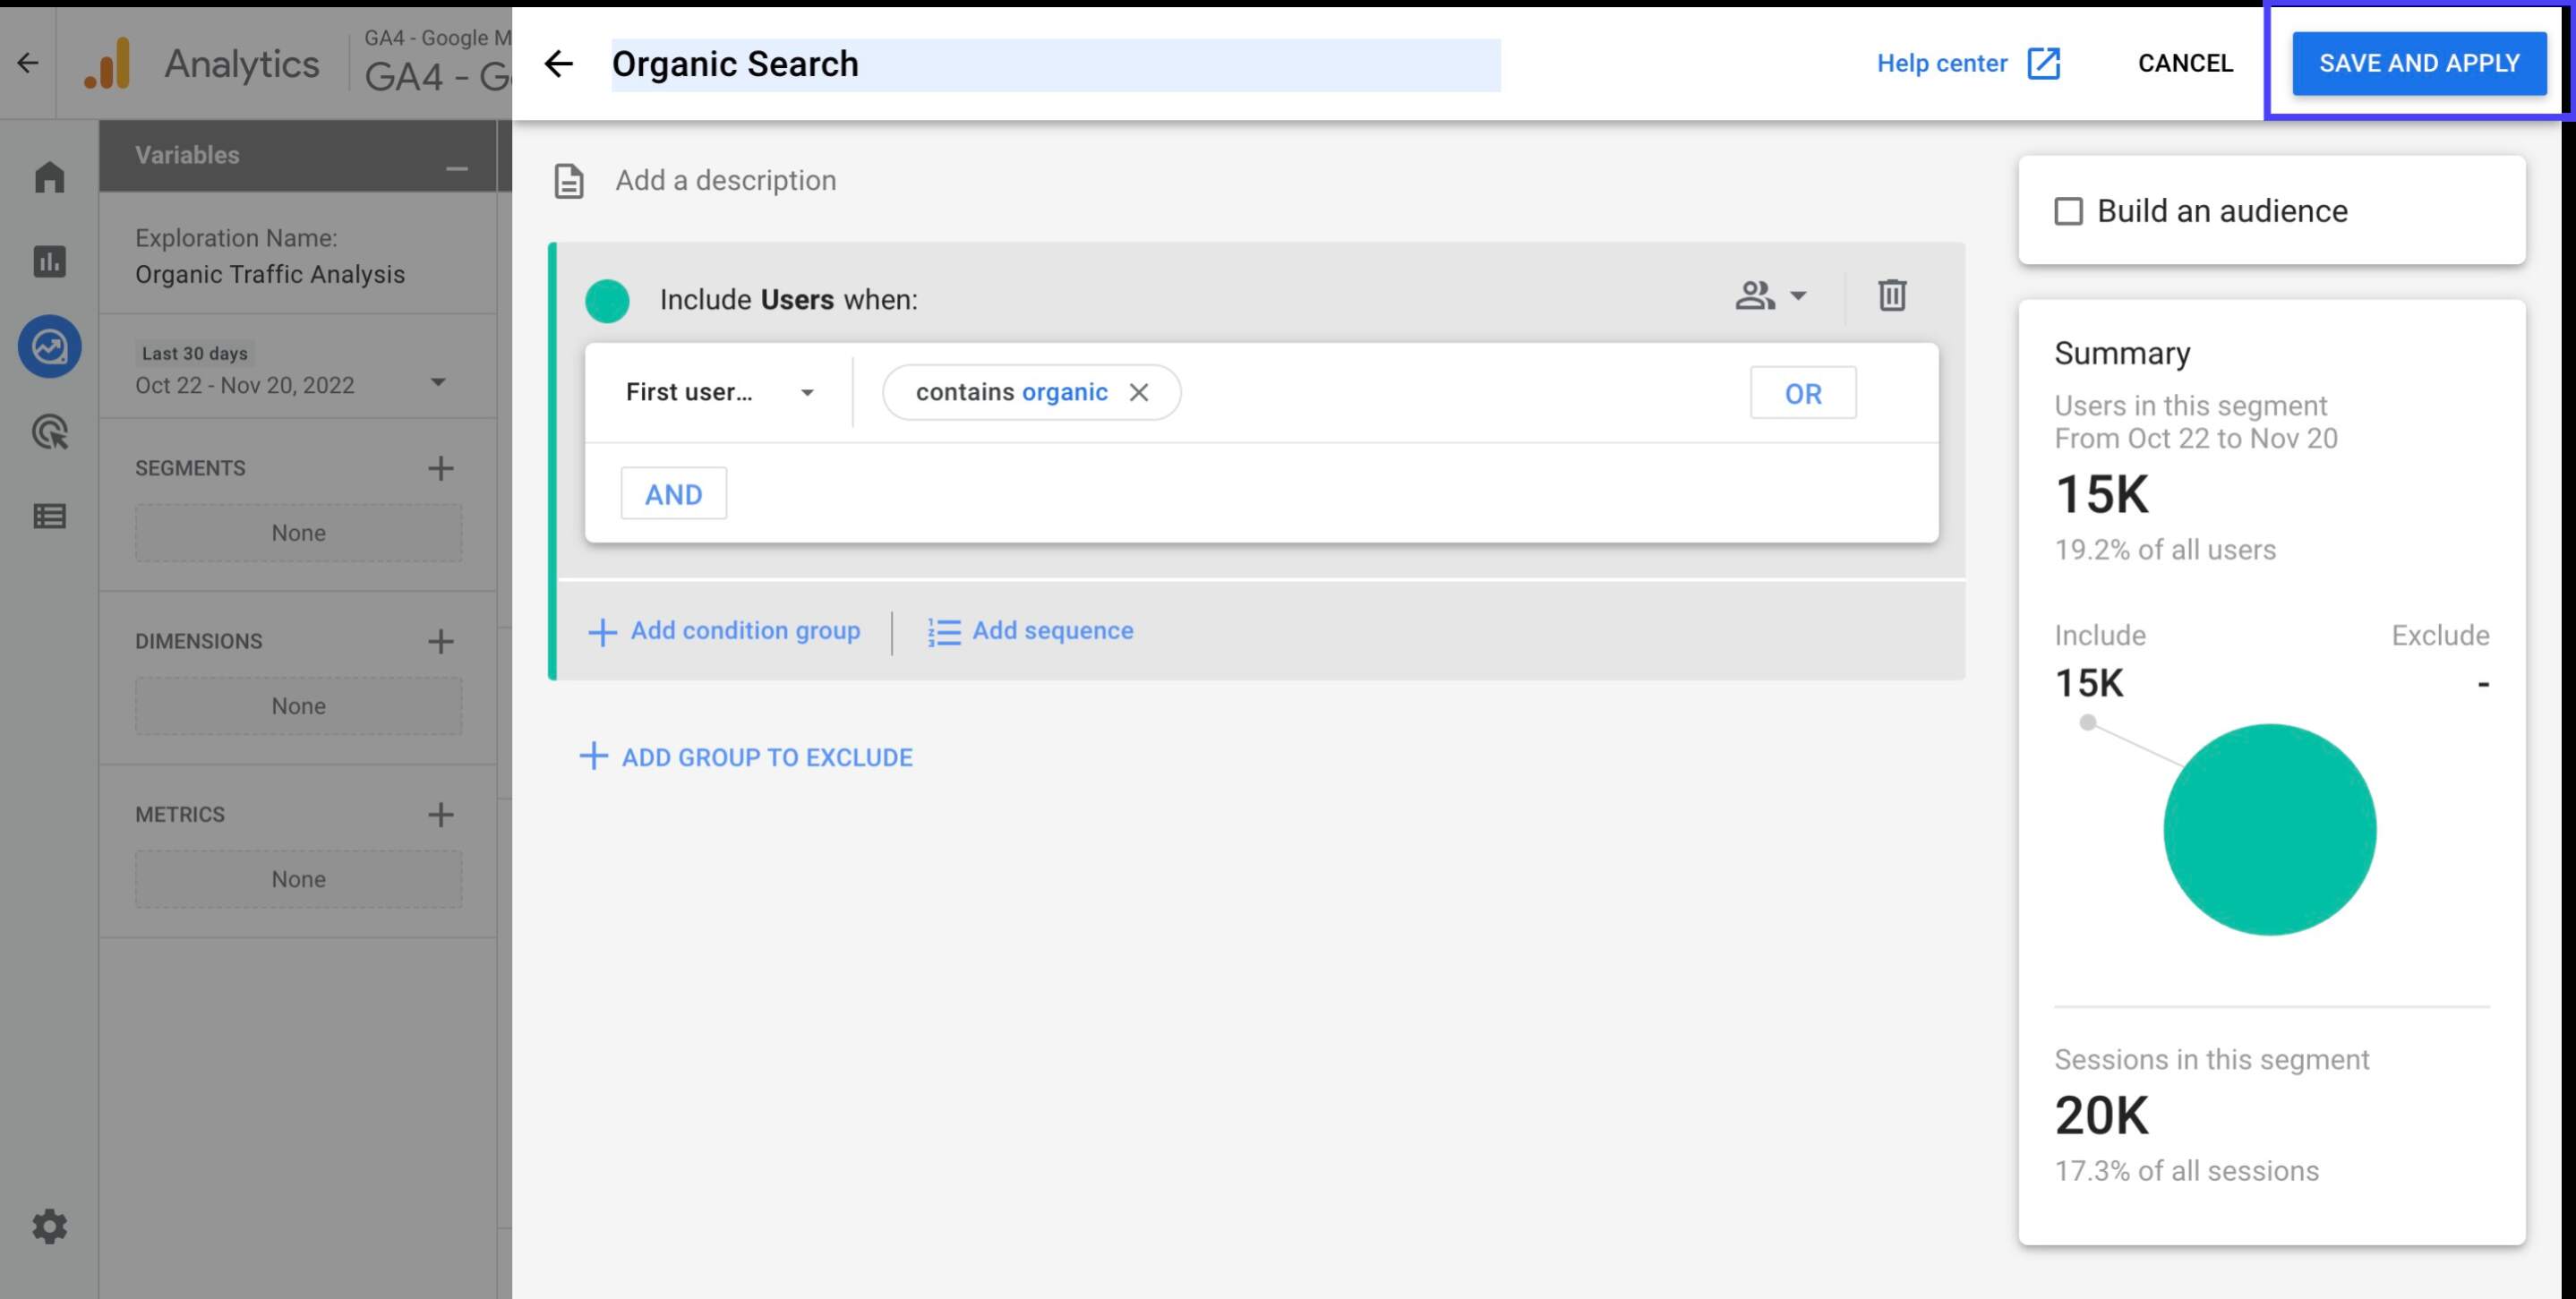
Click on 'Save and Apply' on the upper right corner
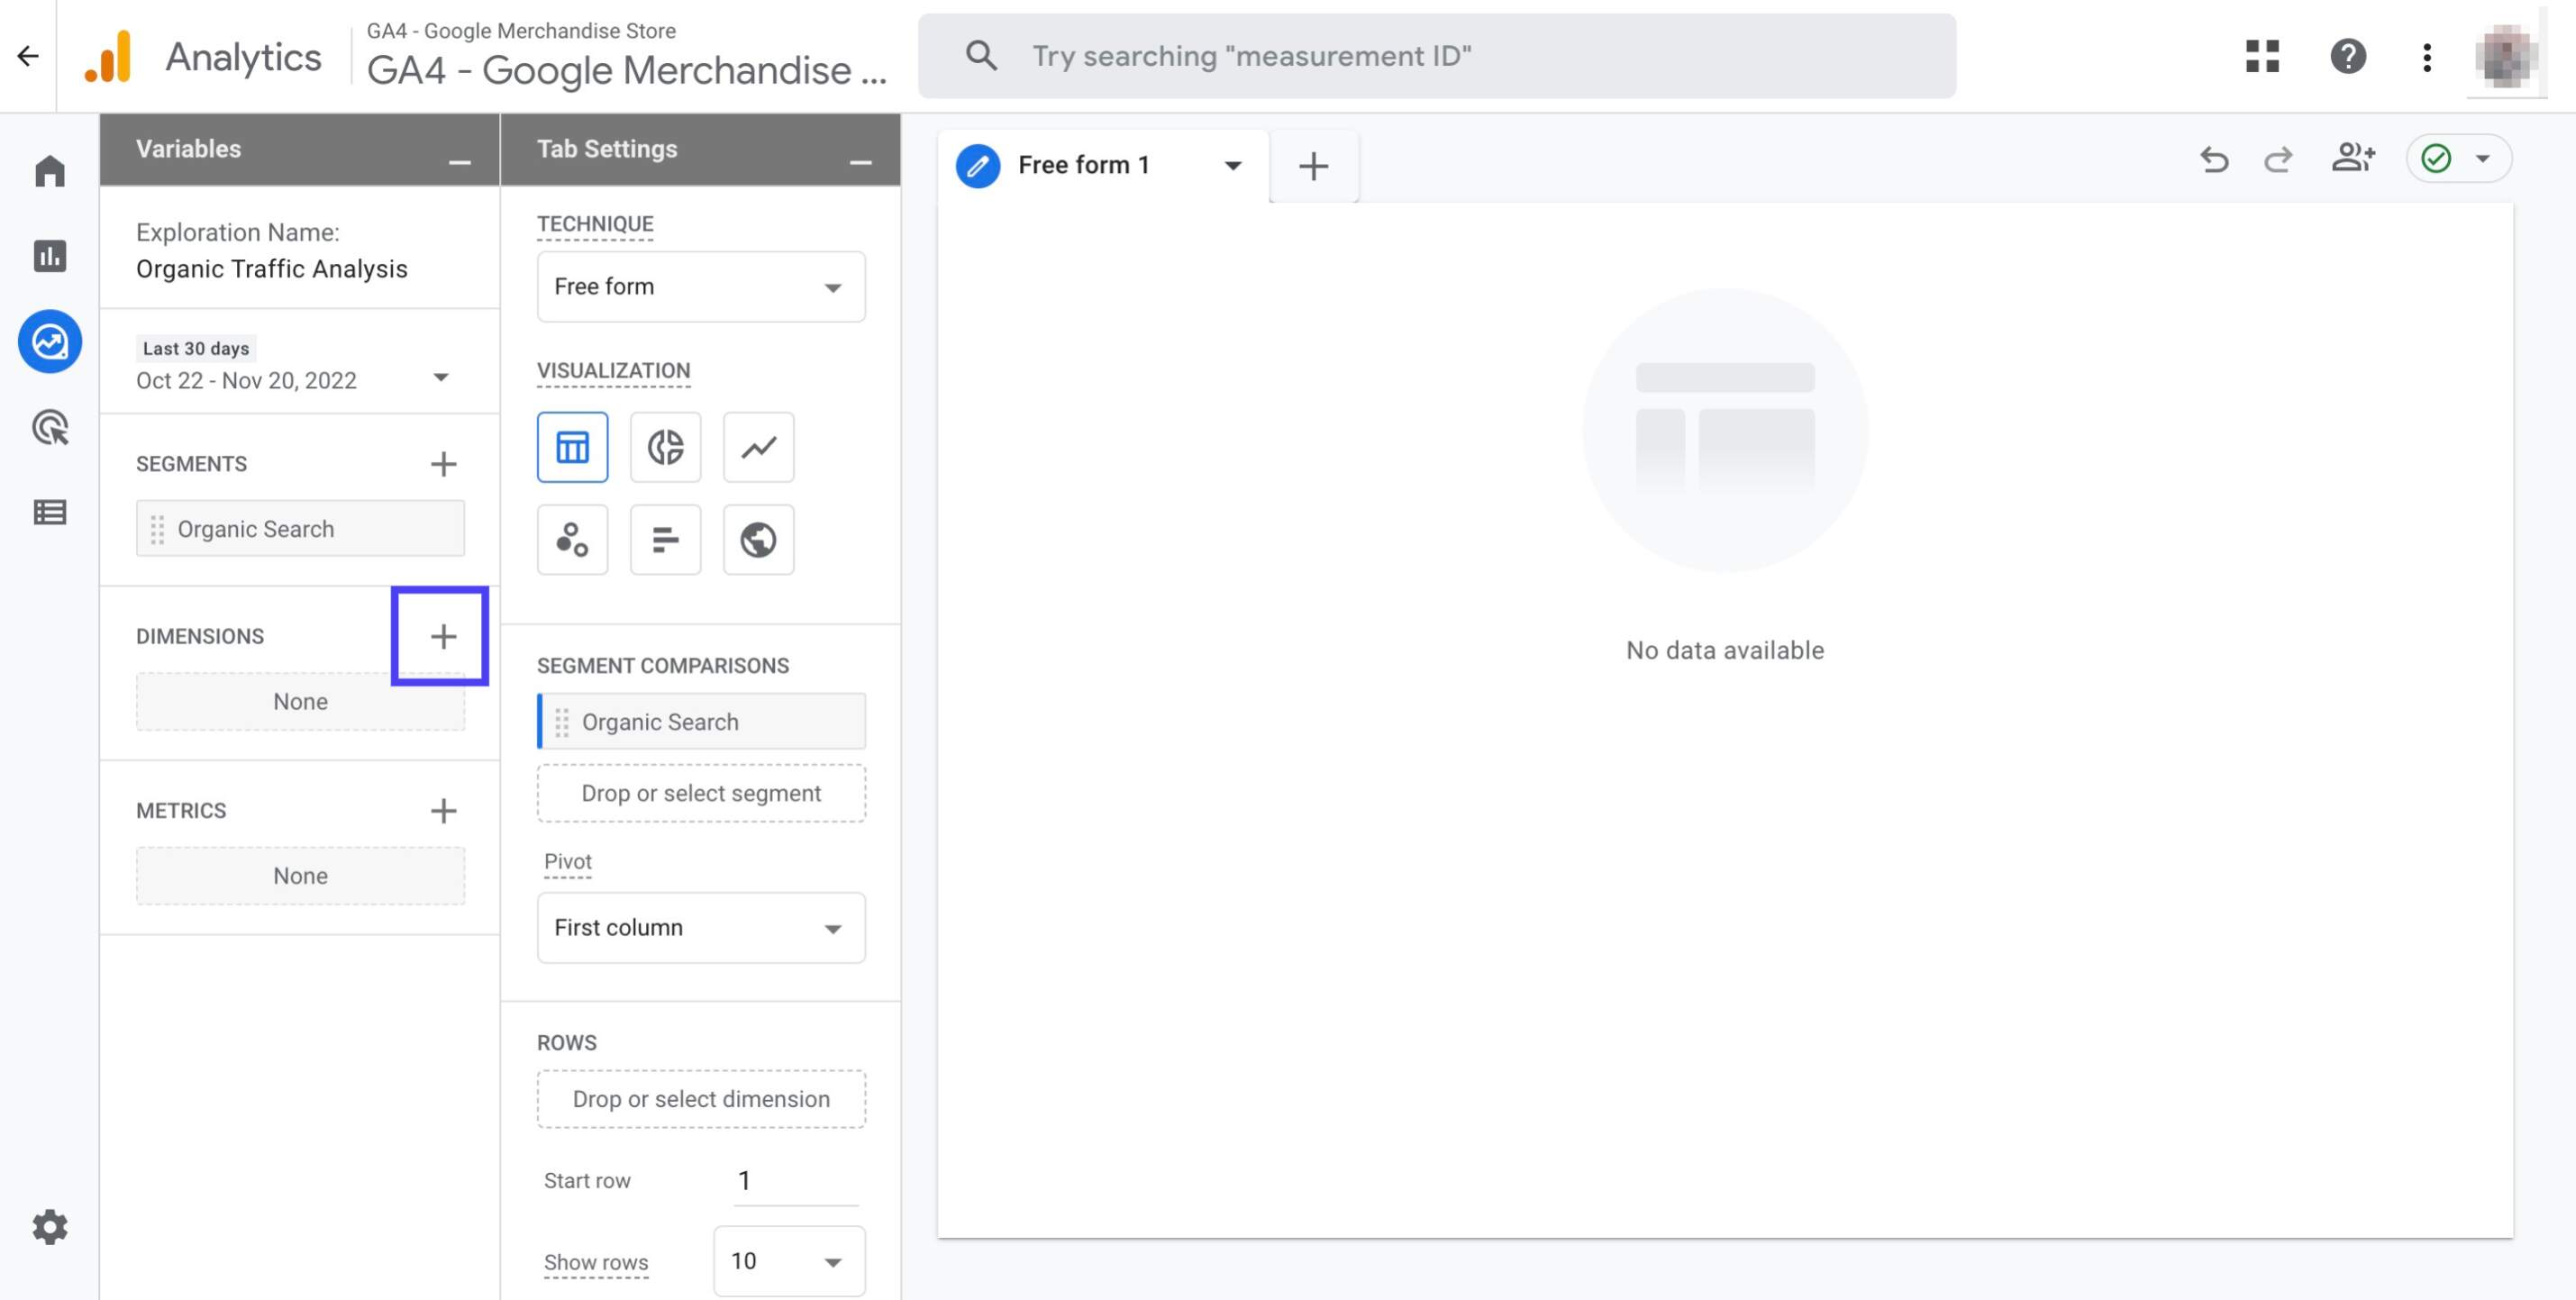
Click the '+' button right next to 'Dimensions'
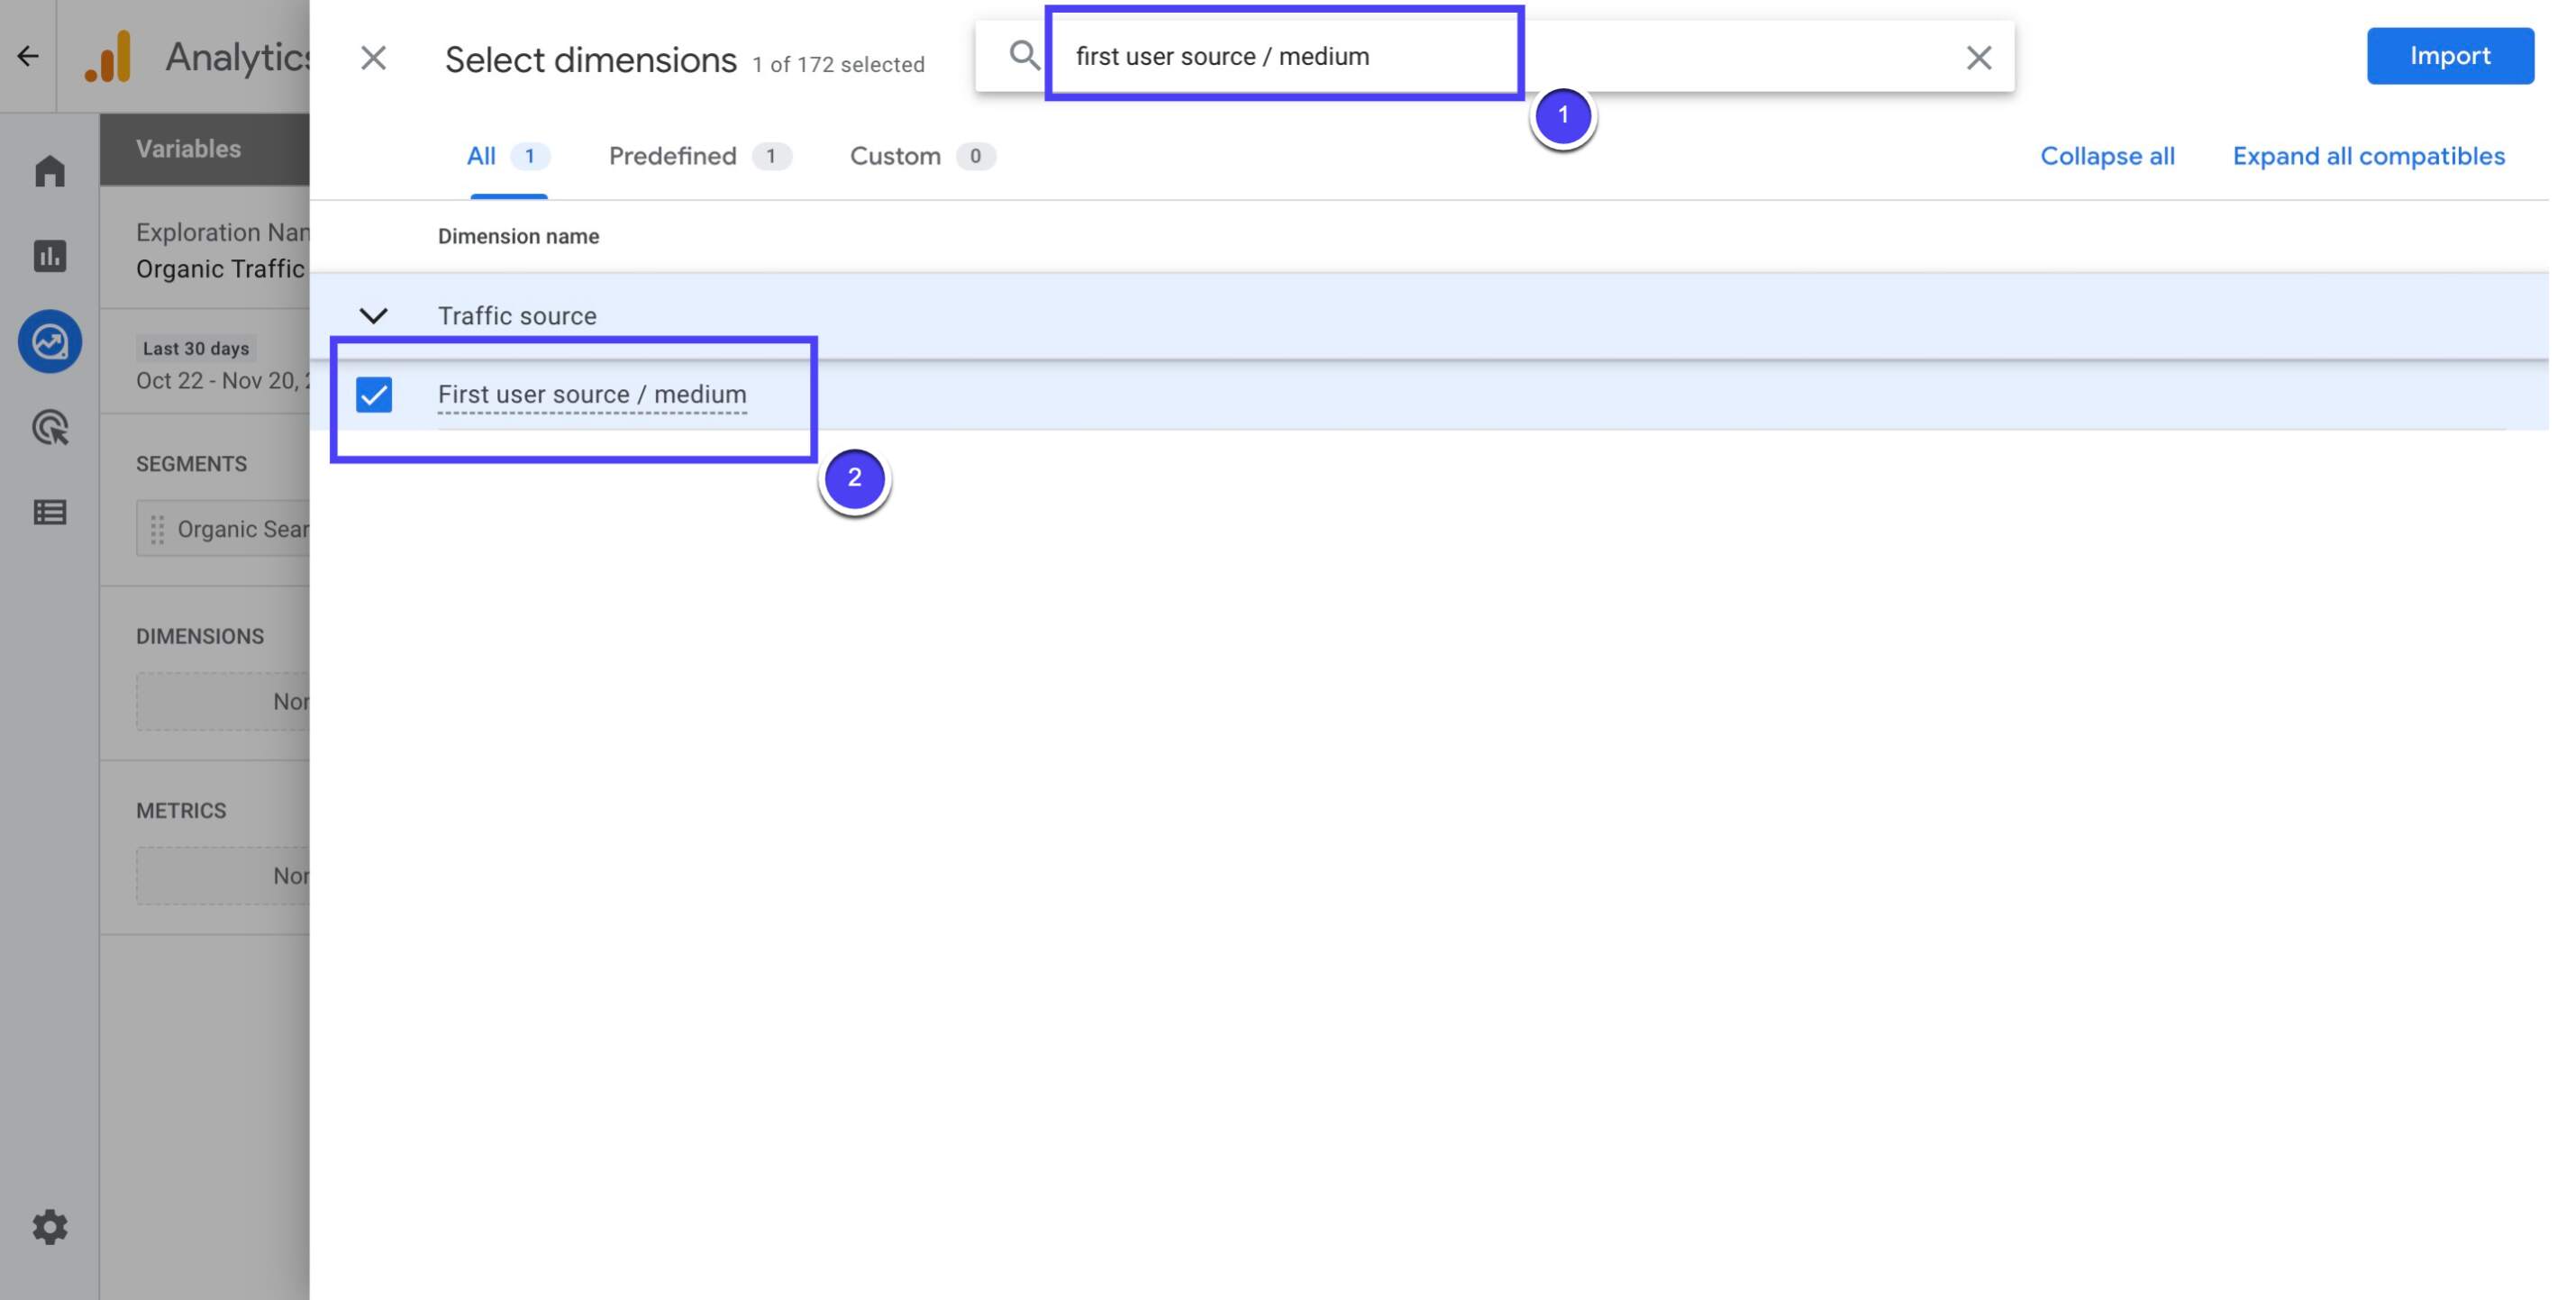
Search for 'first user source / medium', and then click the checkbox when it appears
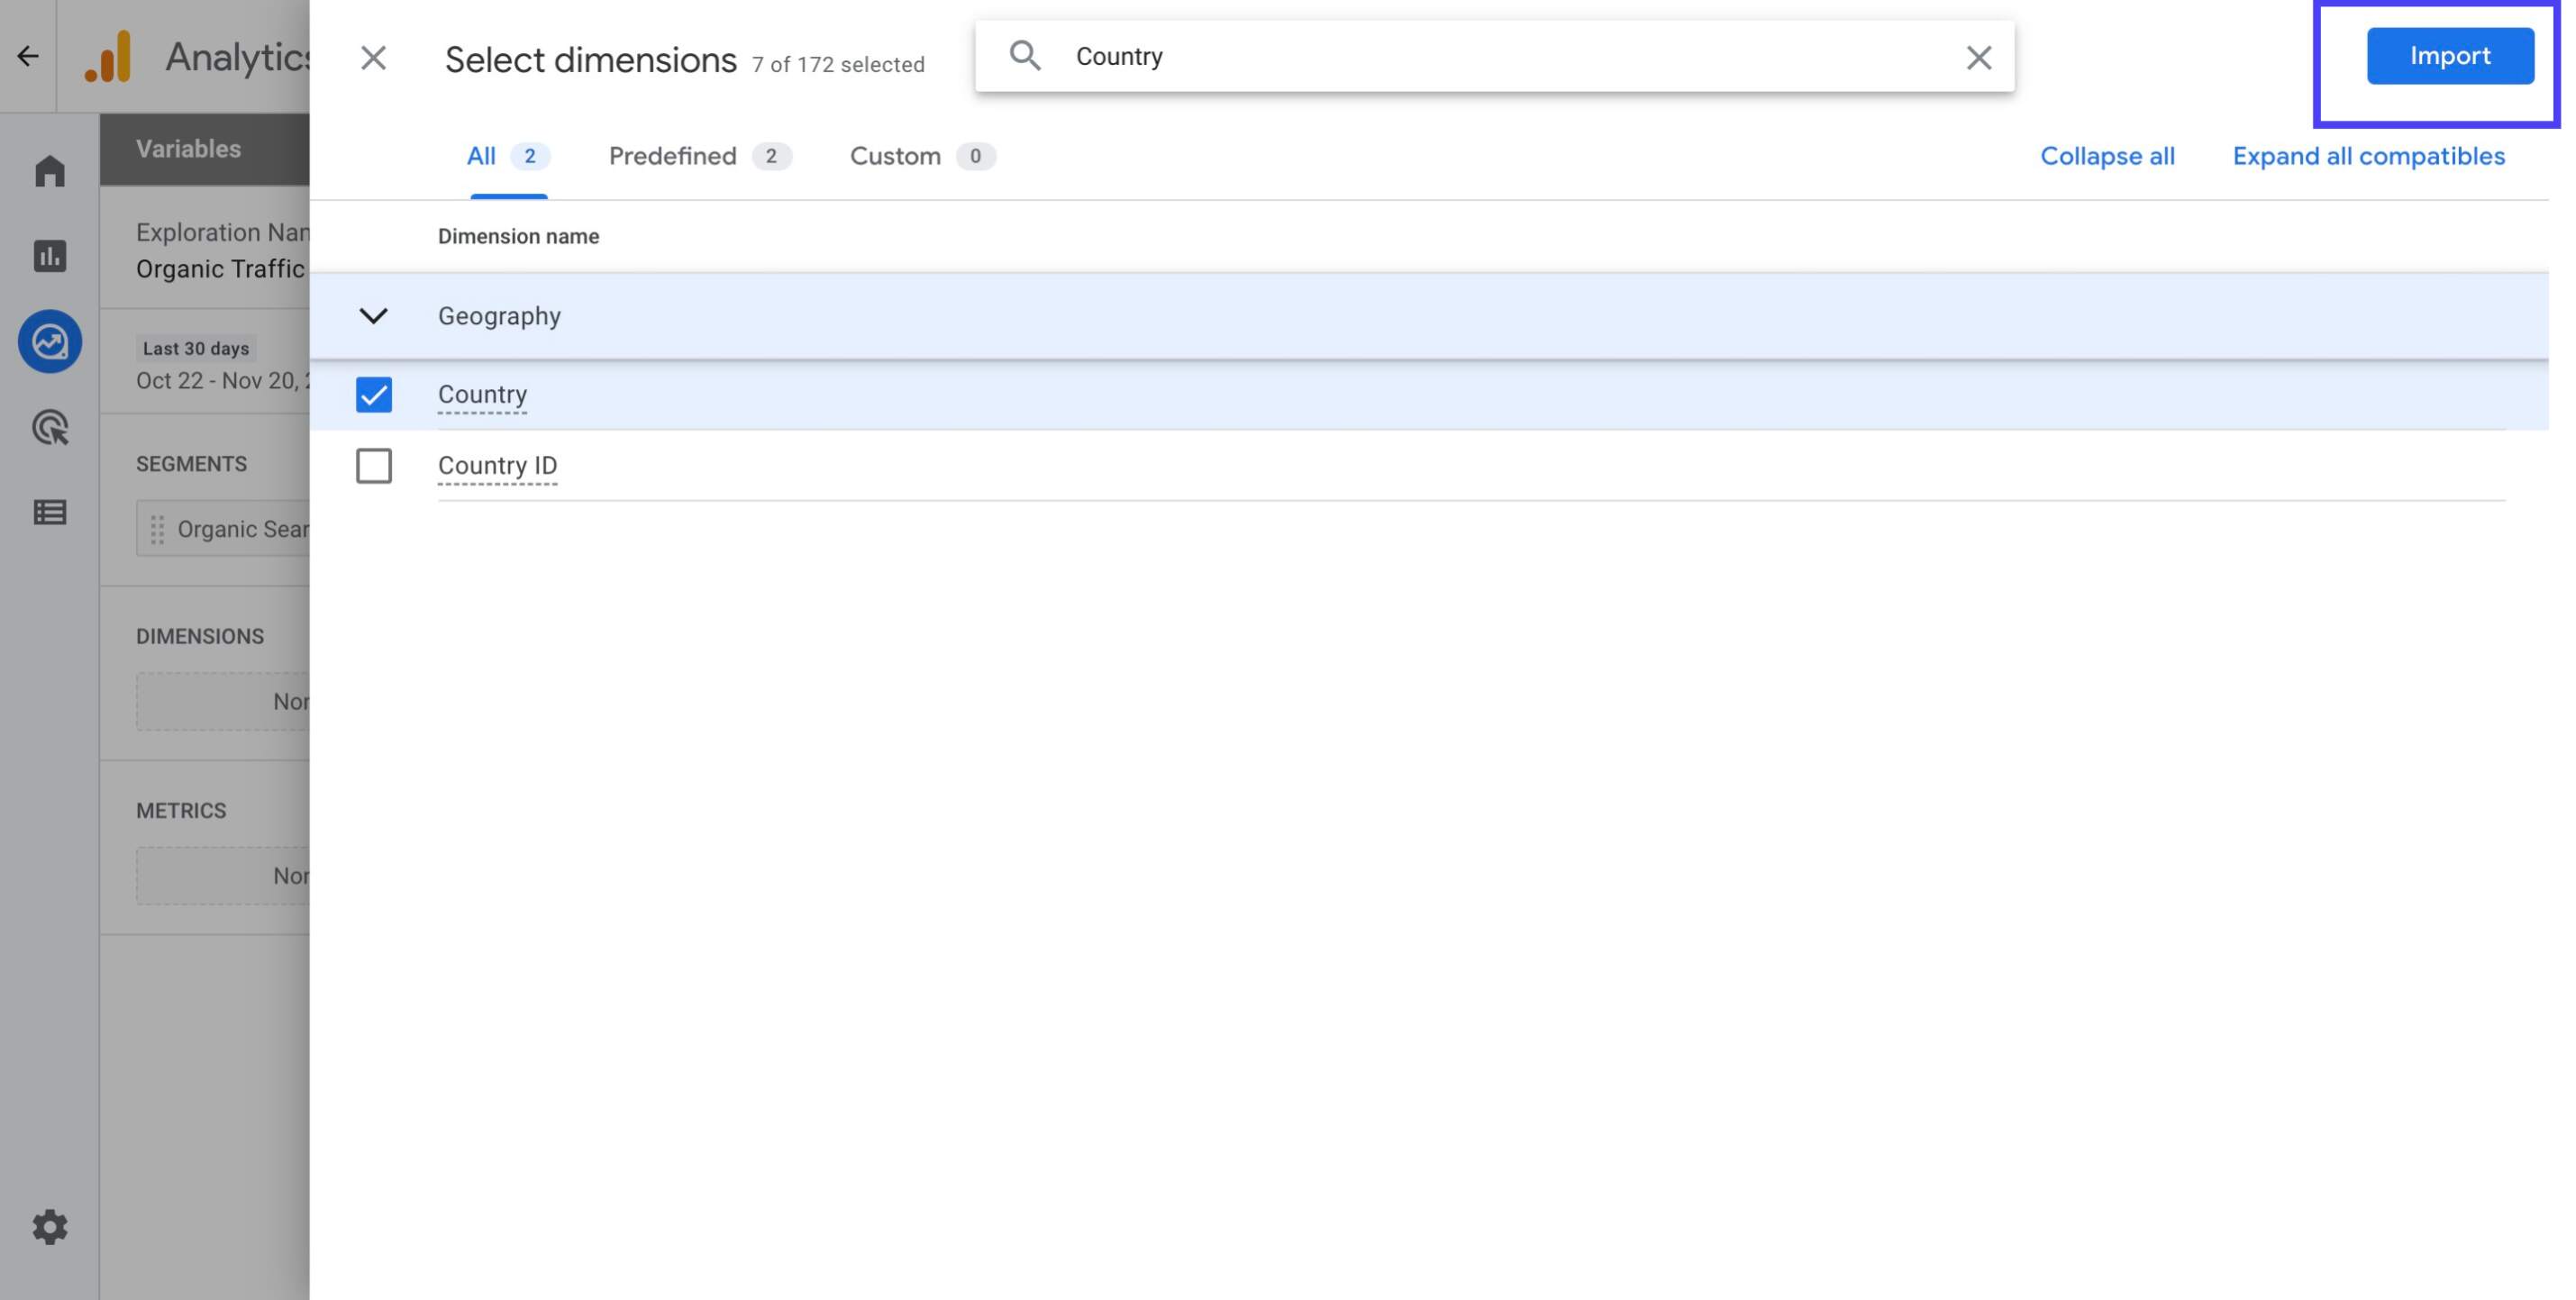
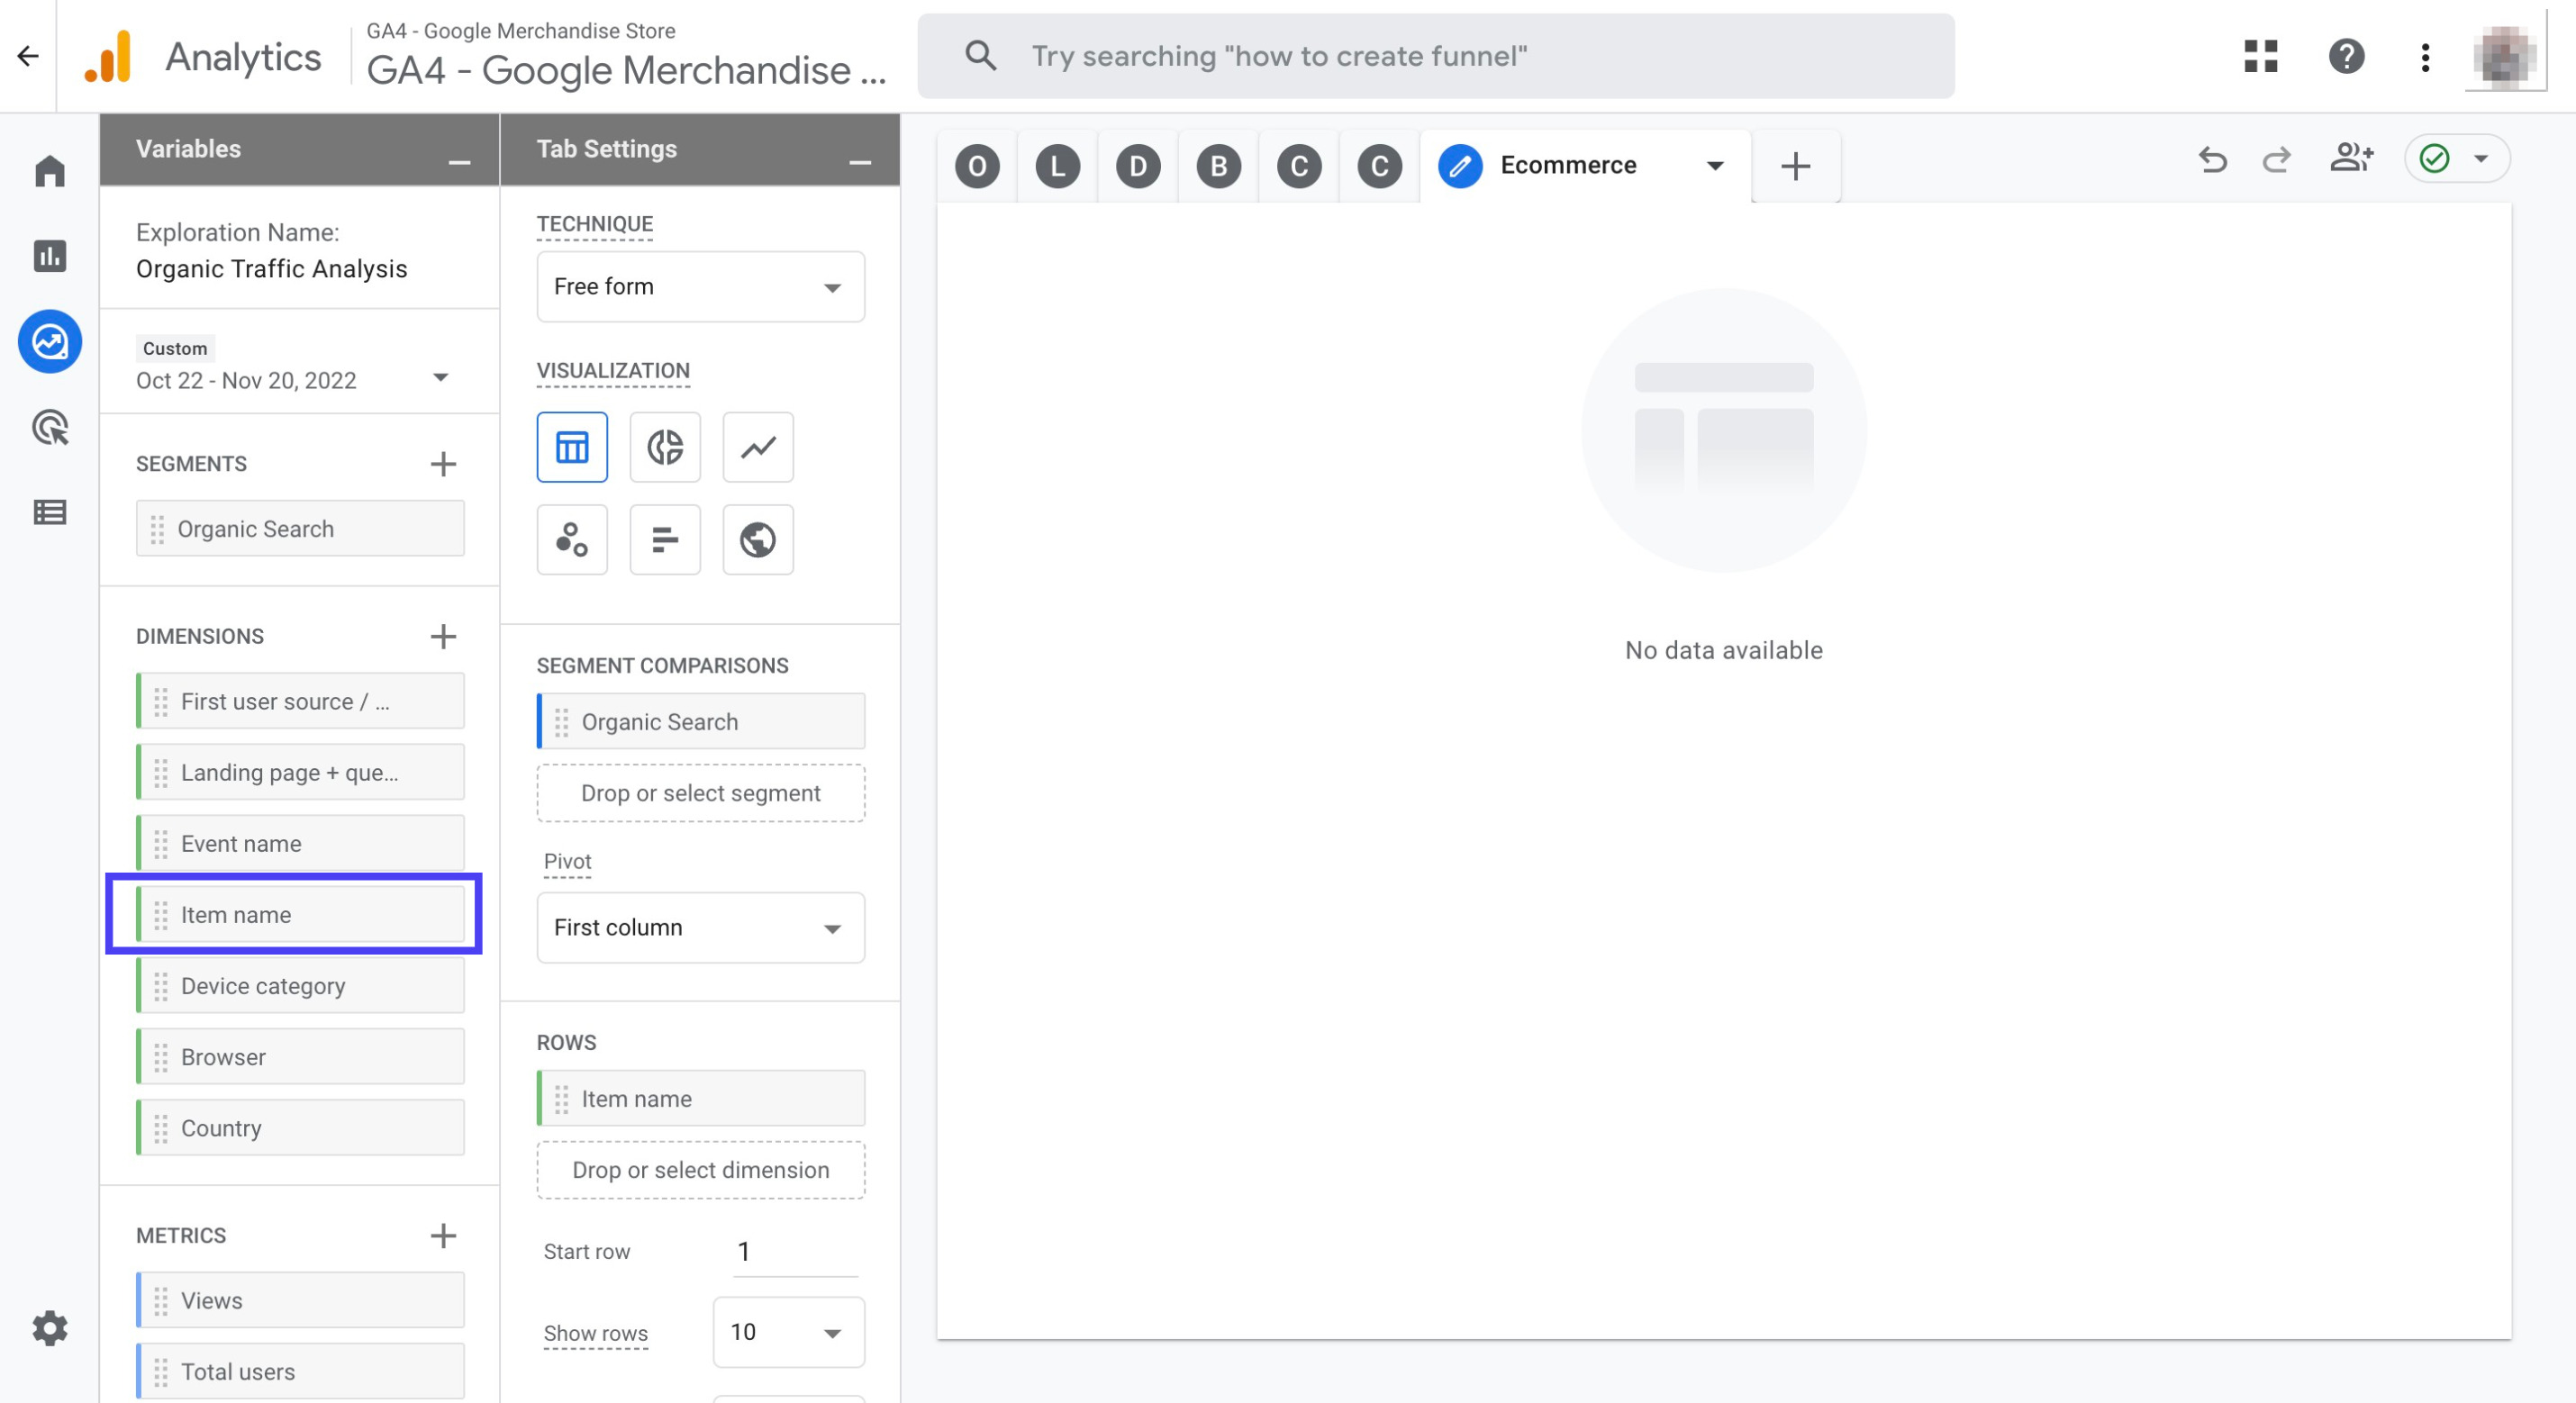
Now, just like in the previous step, search for the following dimensions and click on the checkbox right next to them when they appear: 'Landing Page', 'Event Name', 'Item Name', 'Device Category', 'Browser', 'Country'
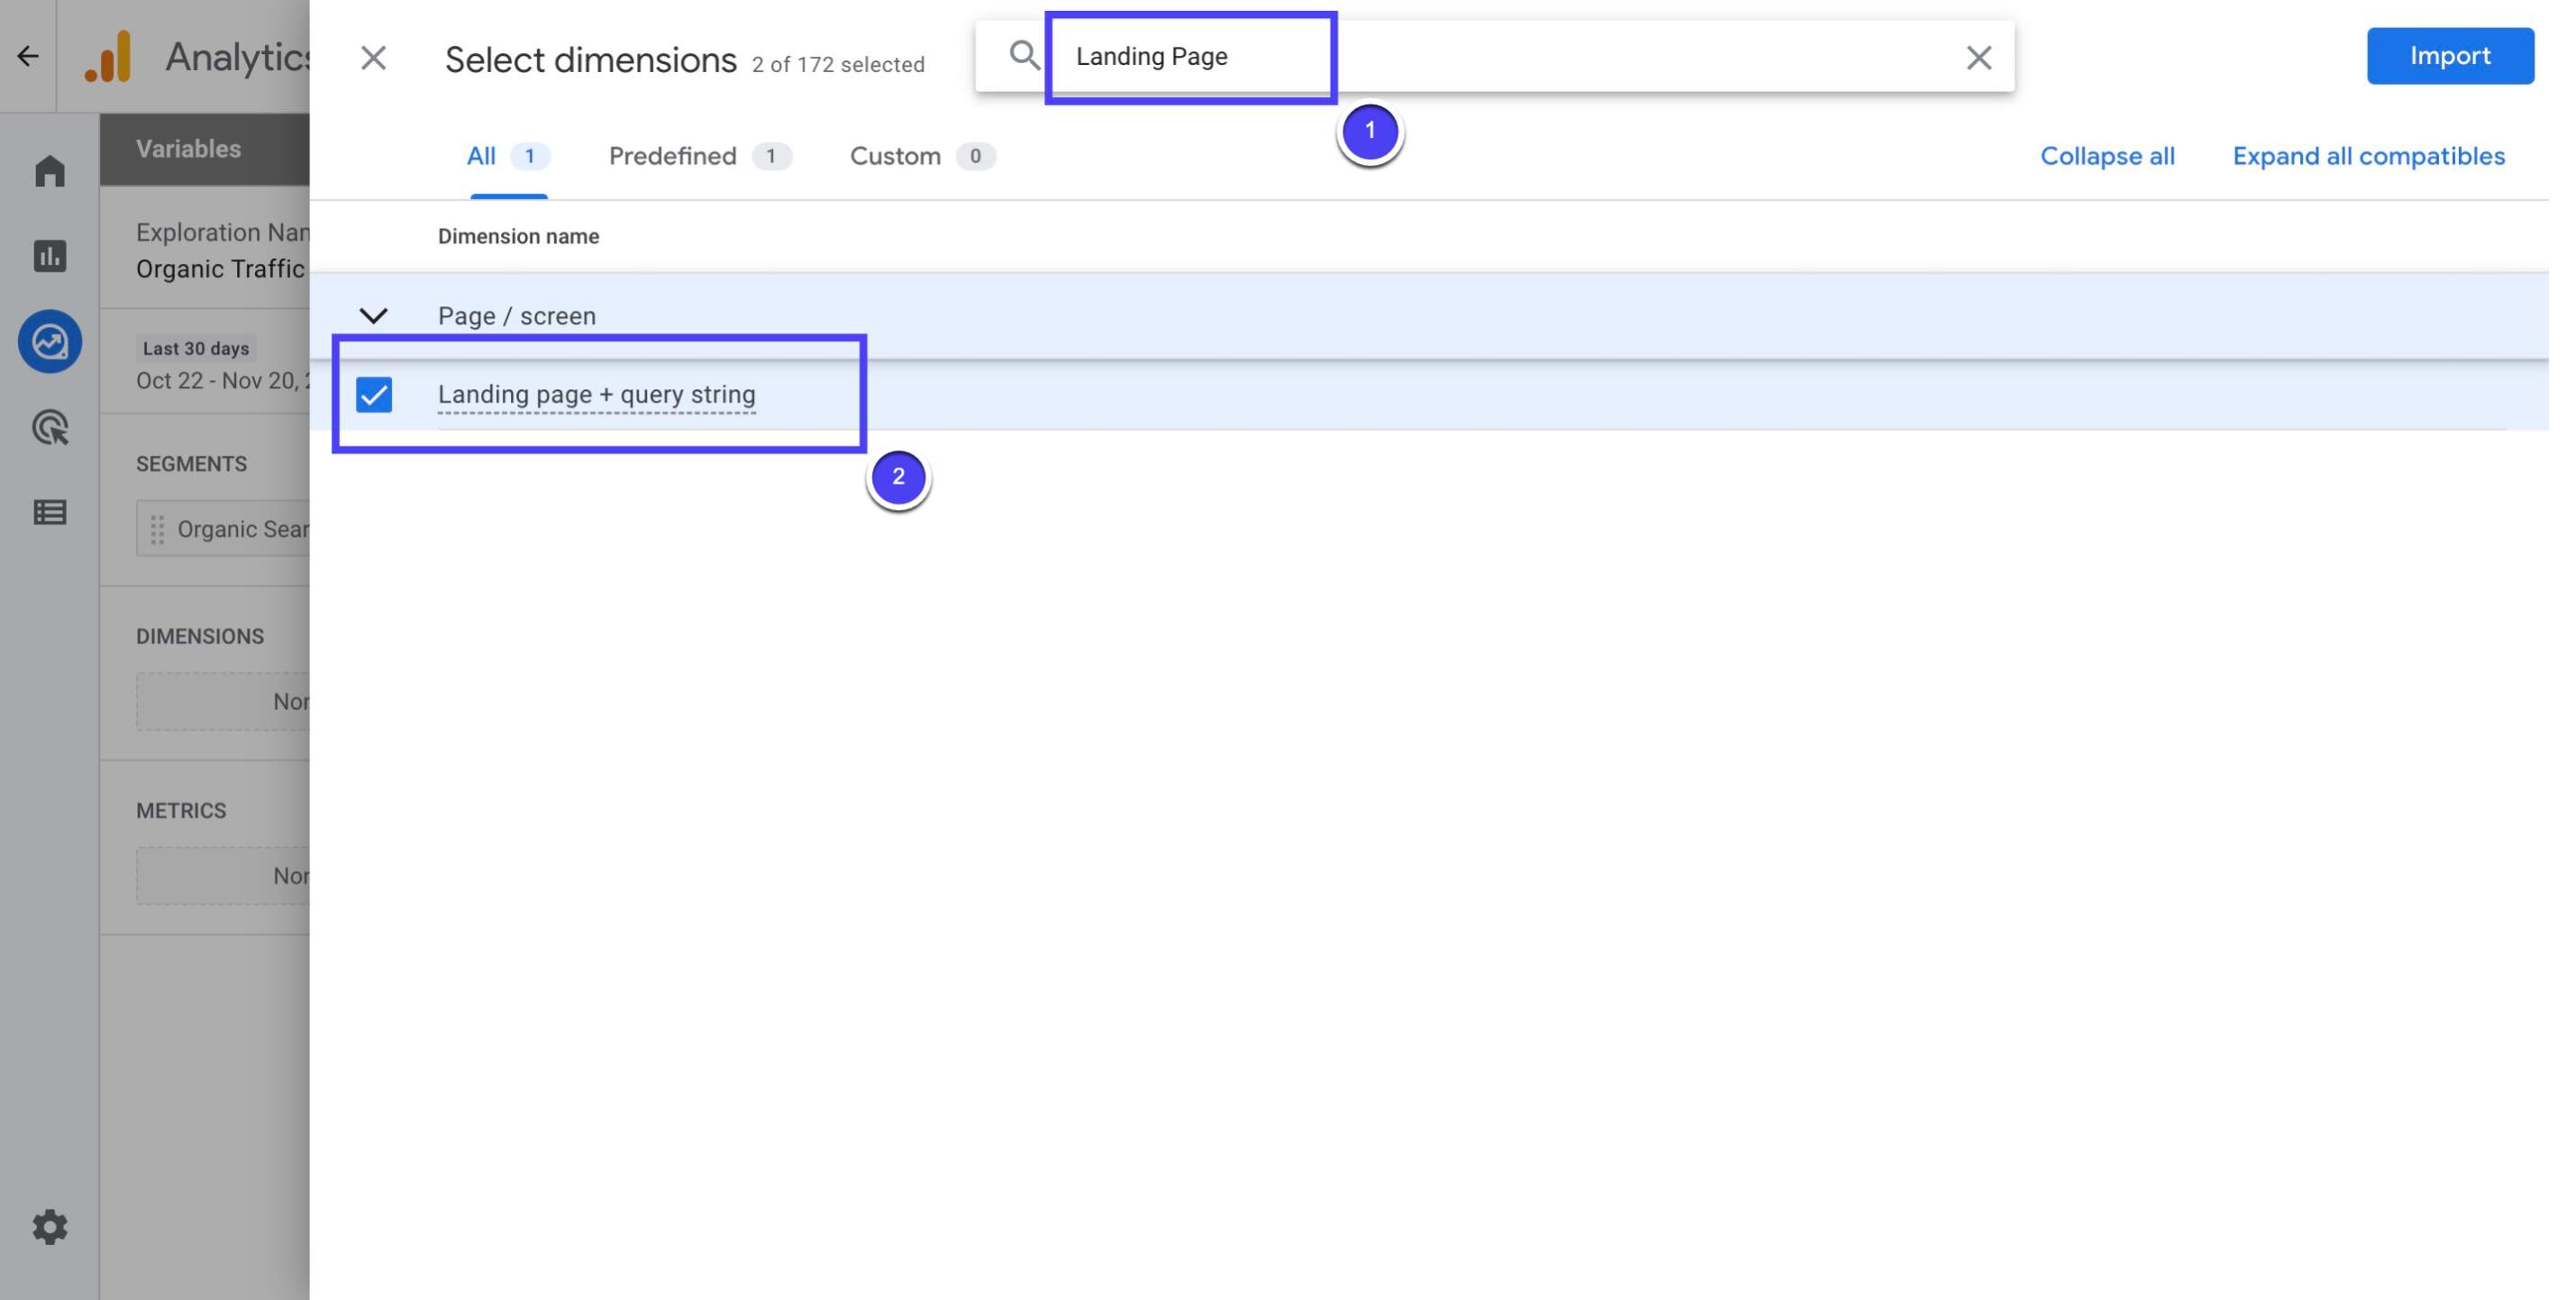
Then, click on the 'Import' on the upper right corner to import all dimensions you choose
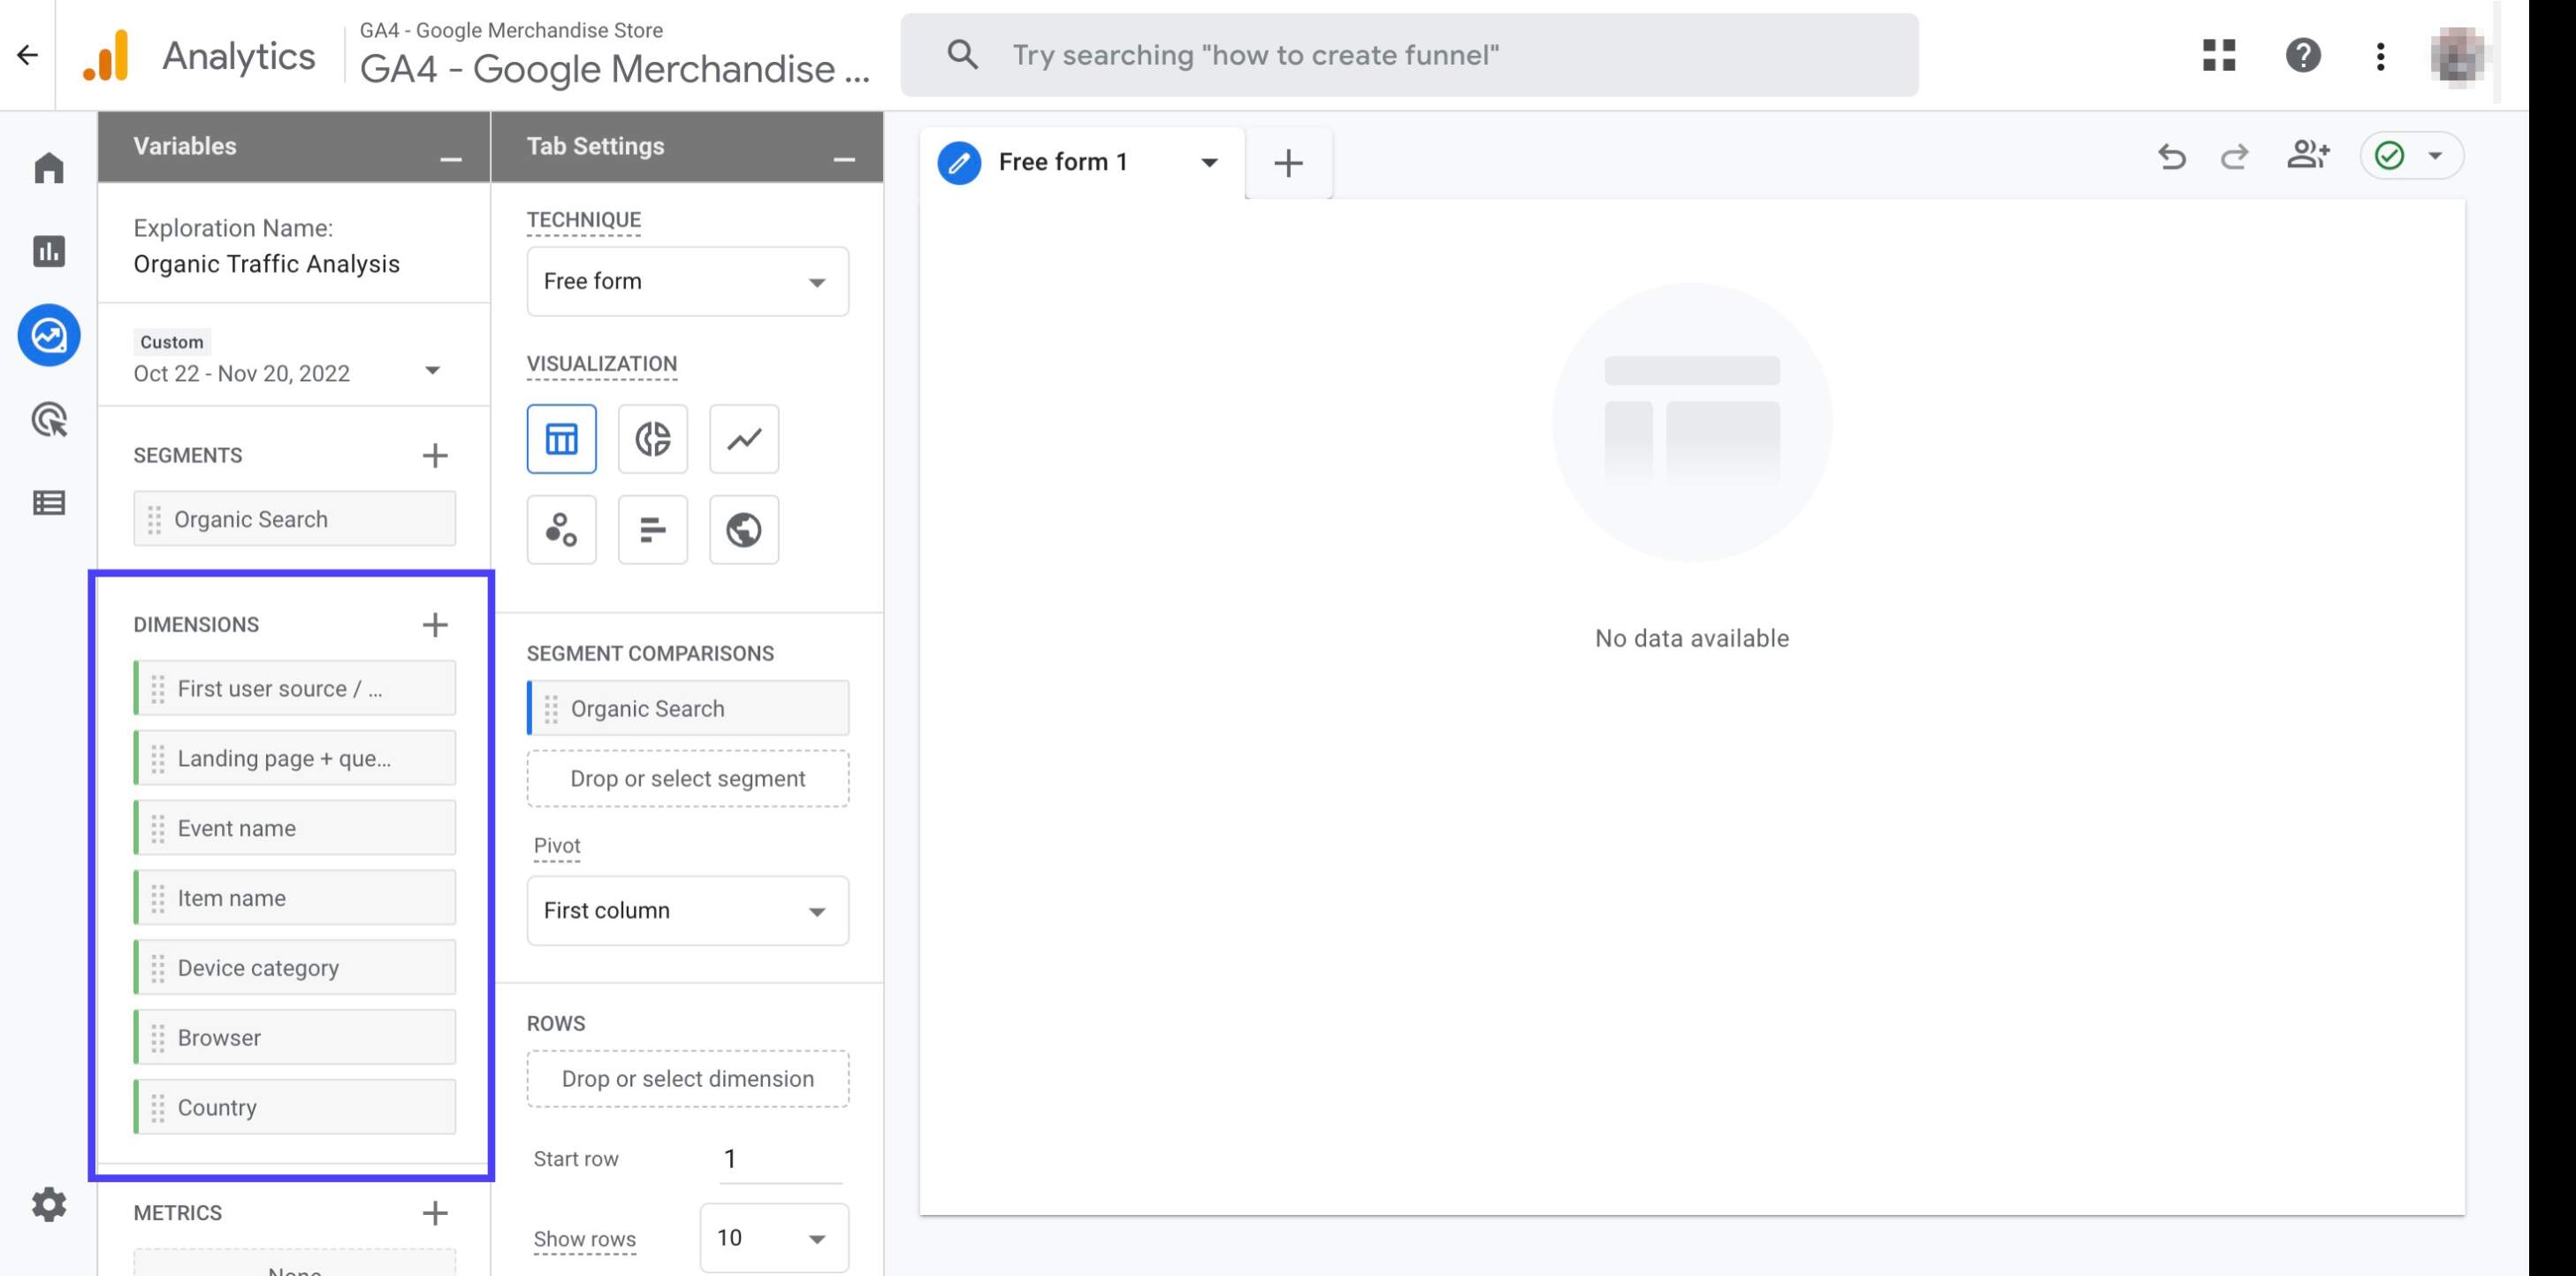
Now, you should be able to see all the imported dimensions as shown in the graphic
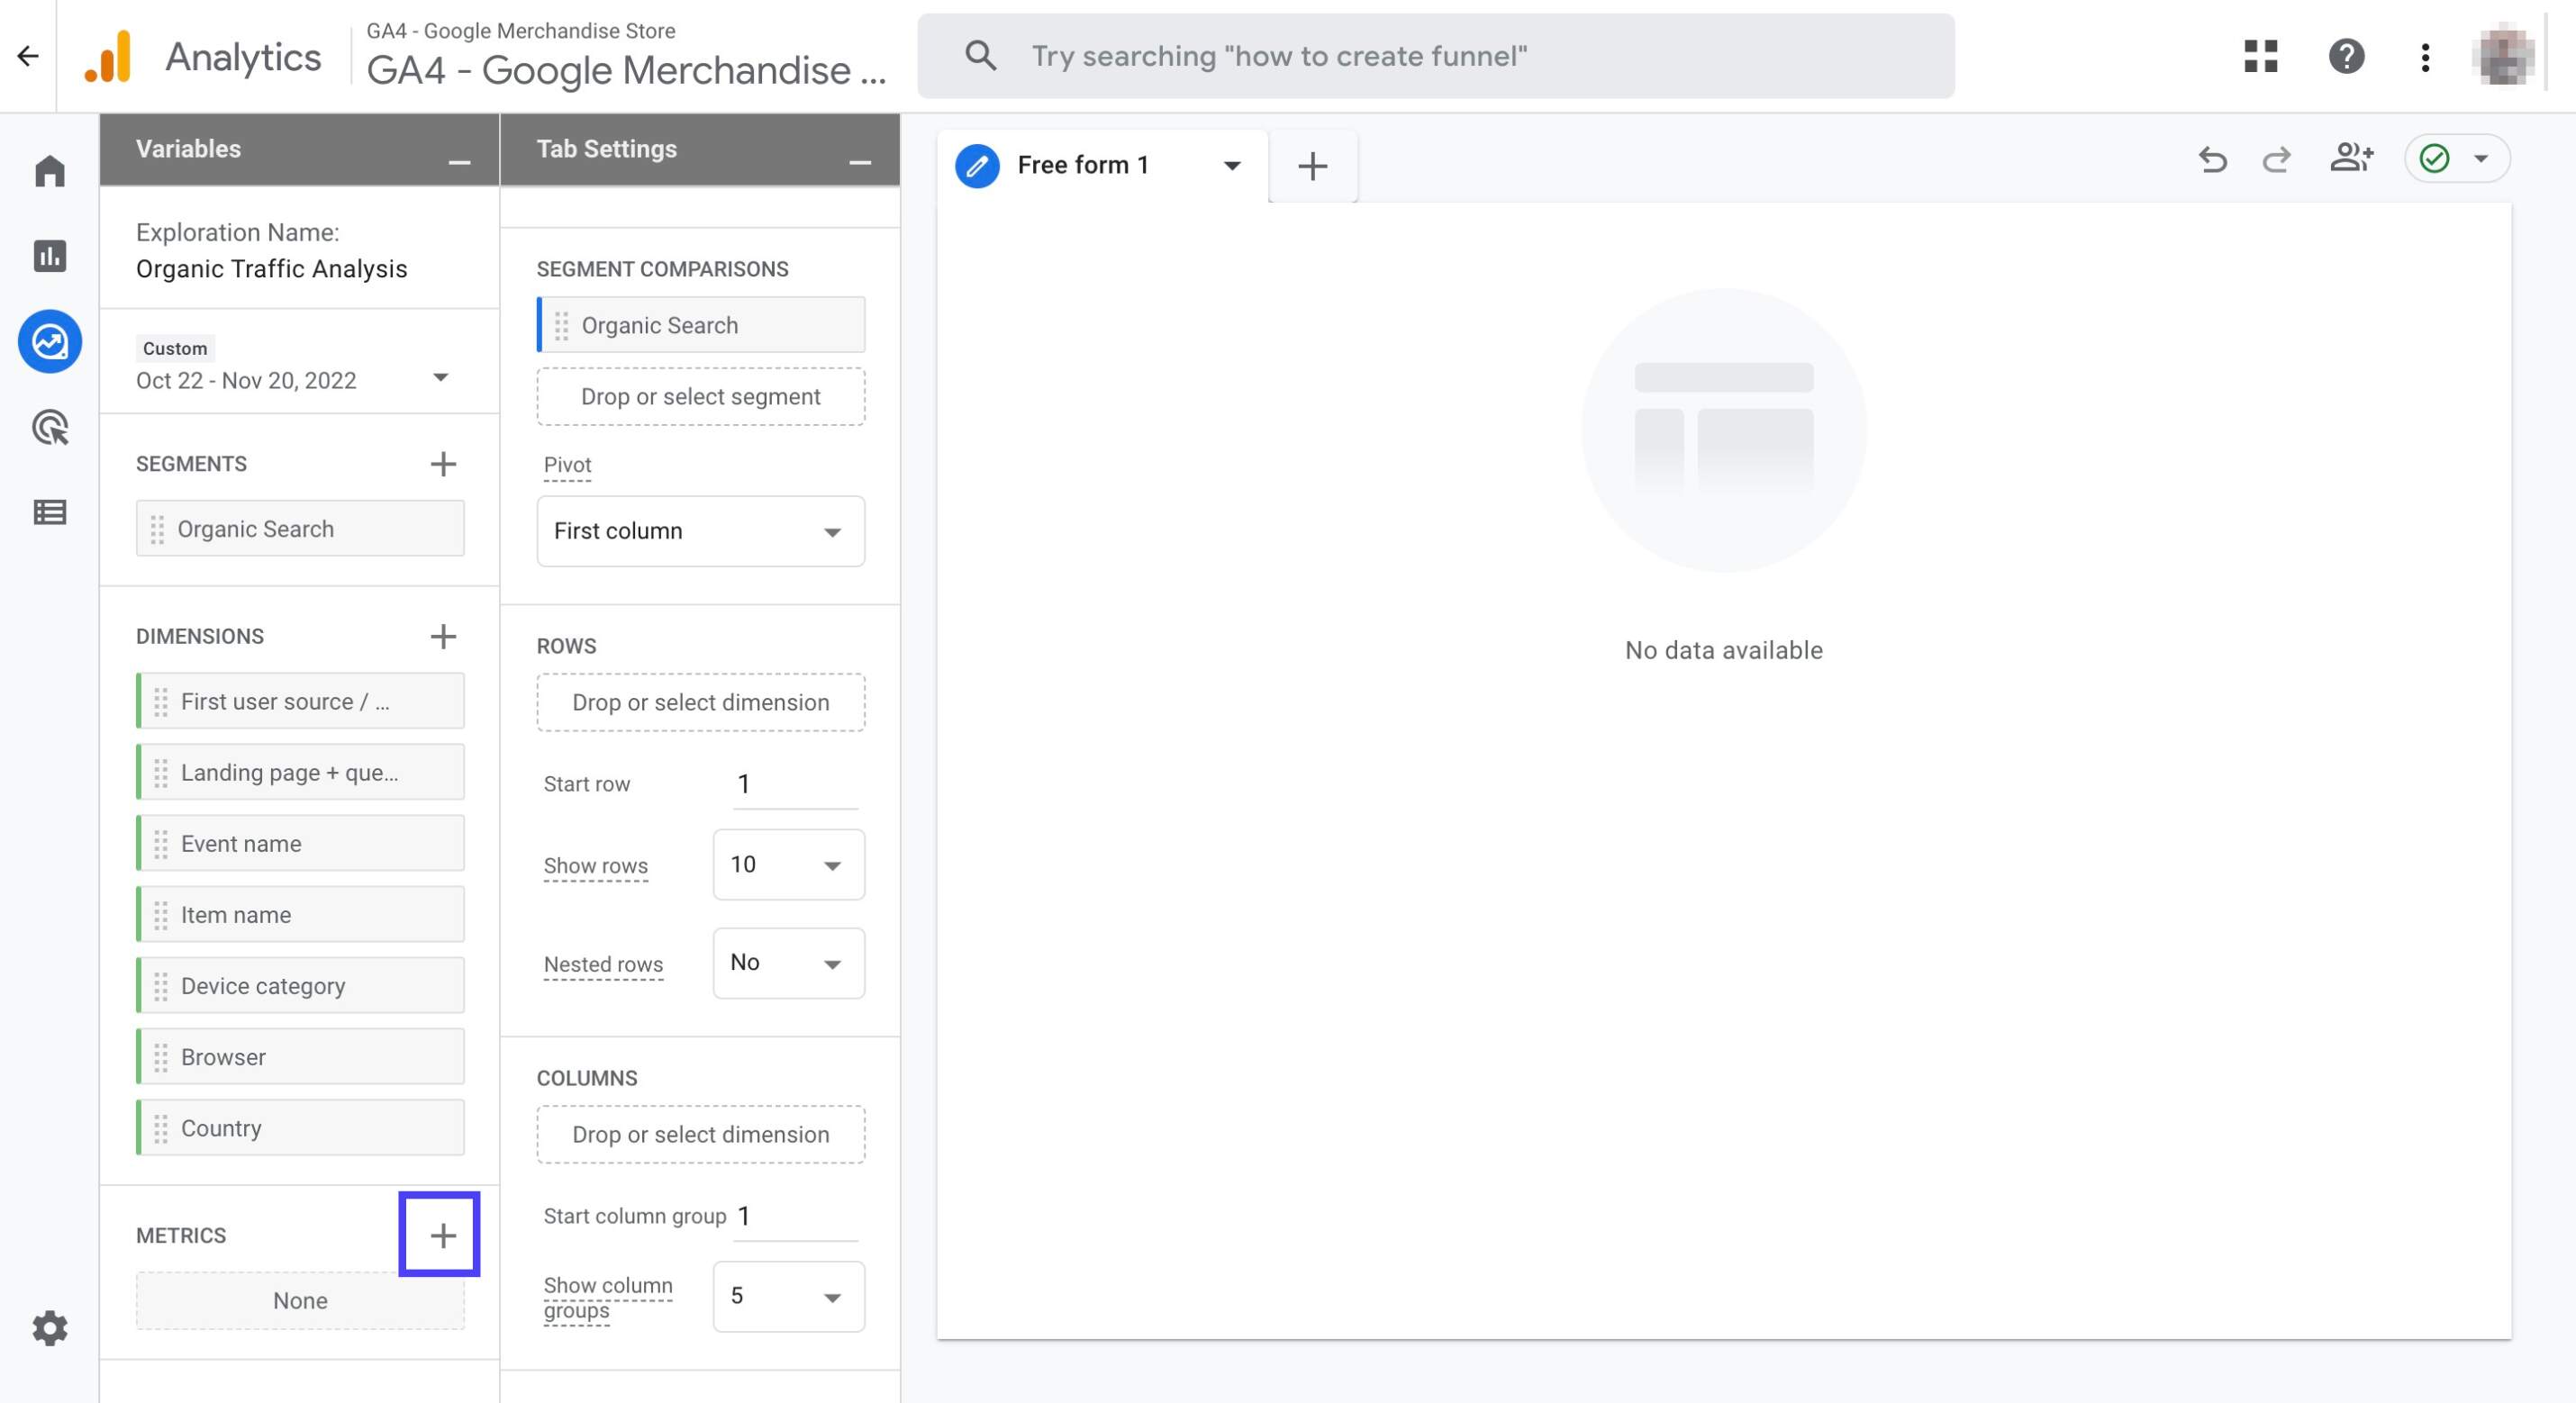
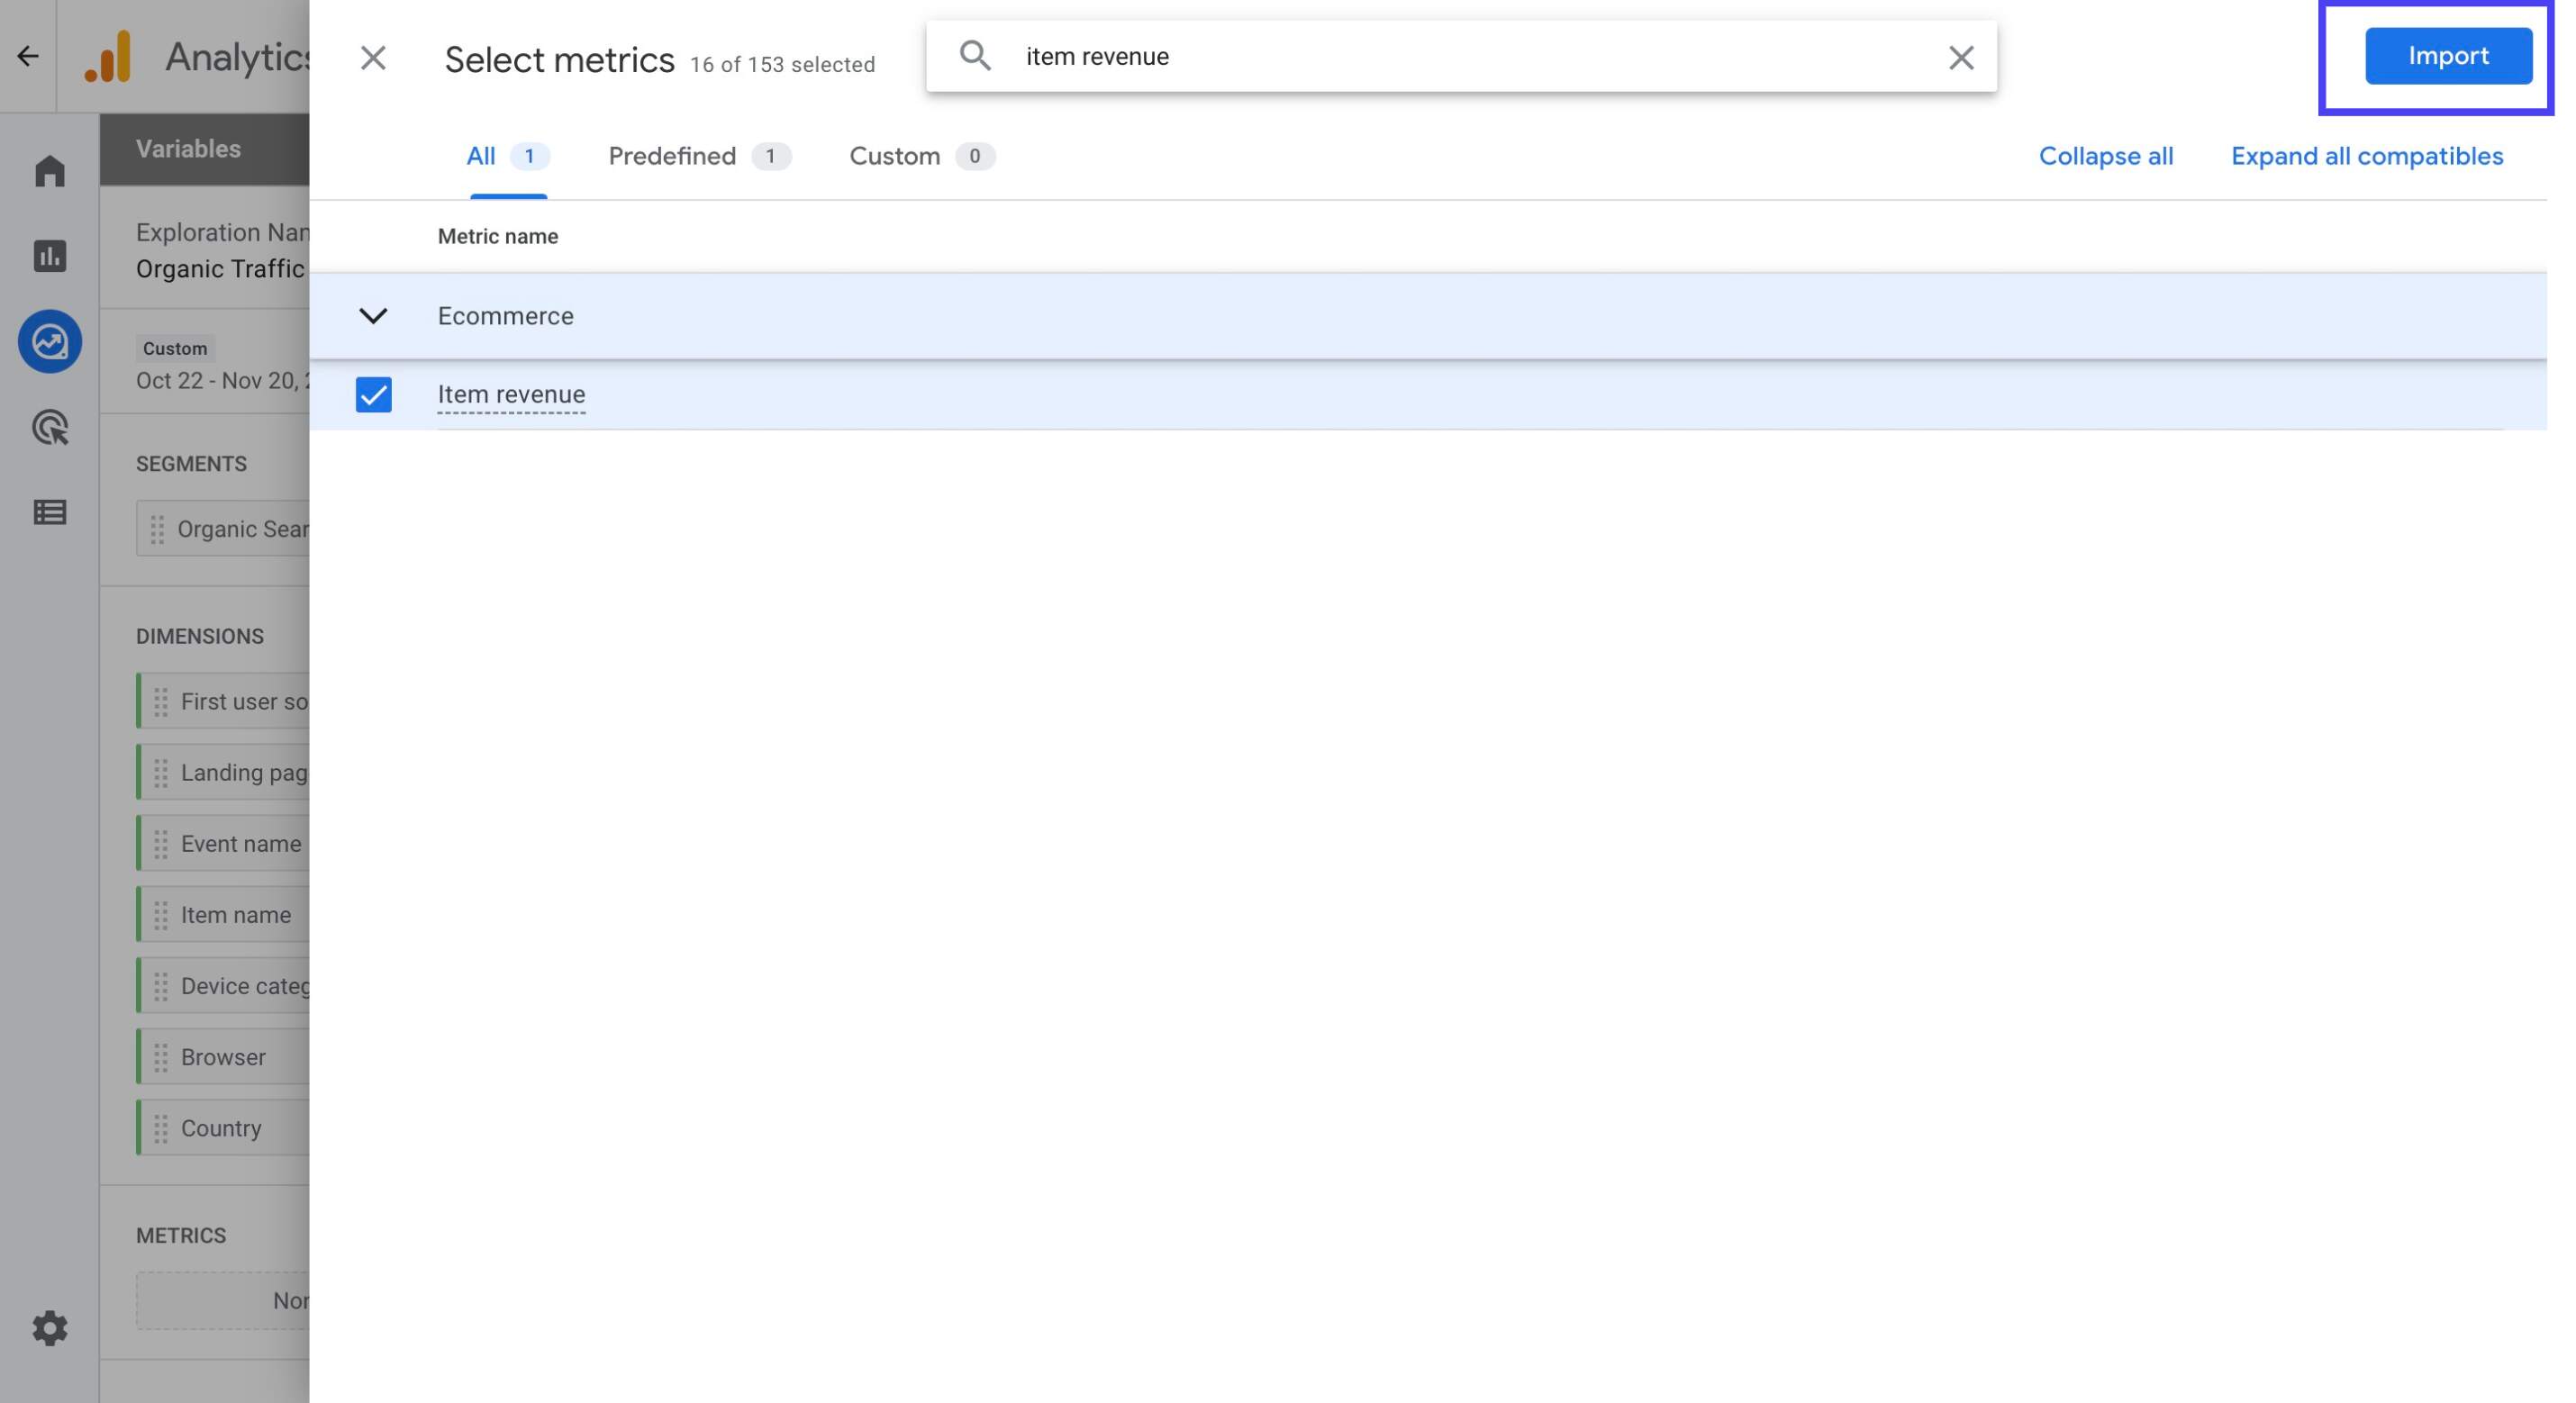
Click on the '+' button next to 'Metrics'
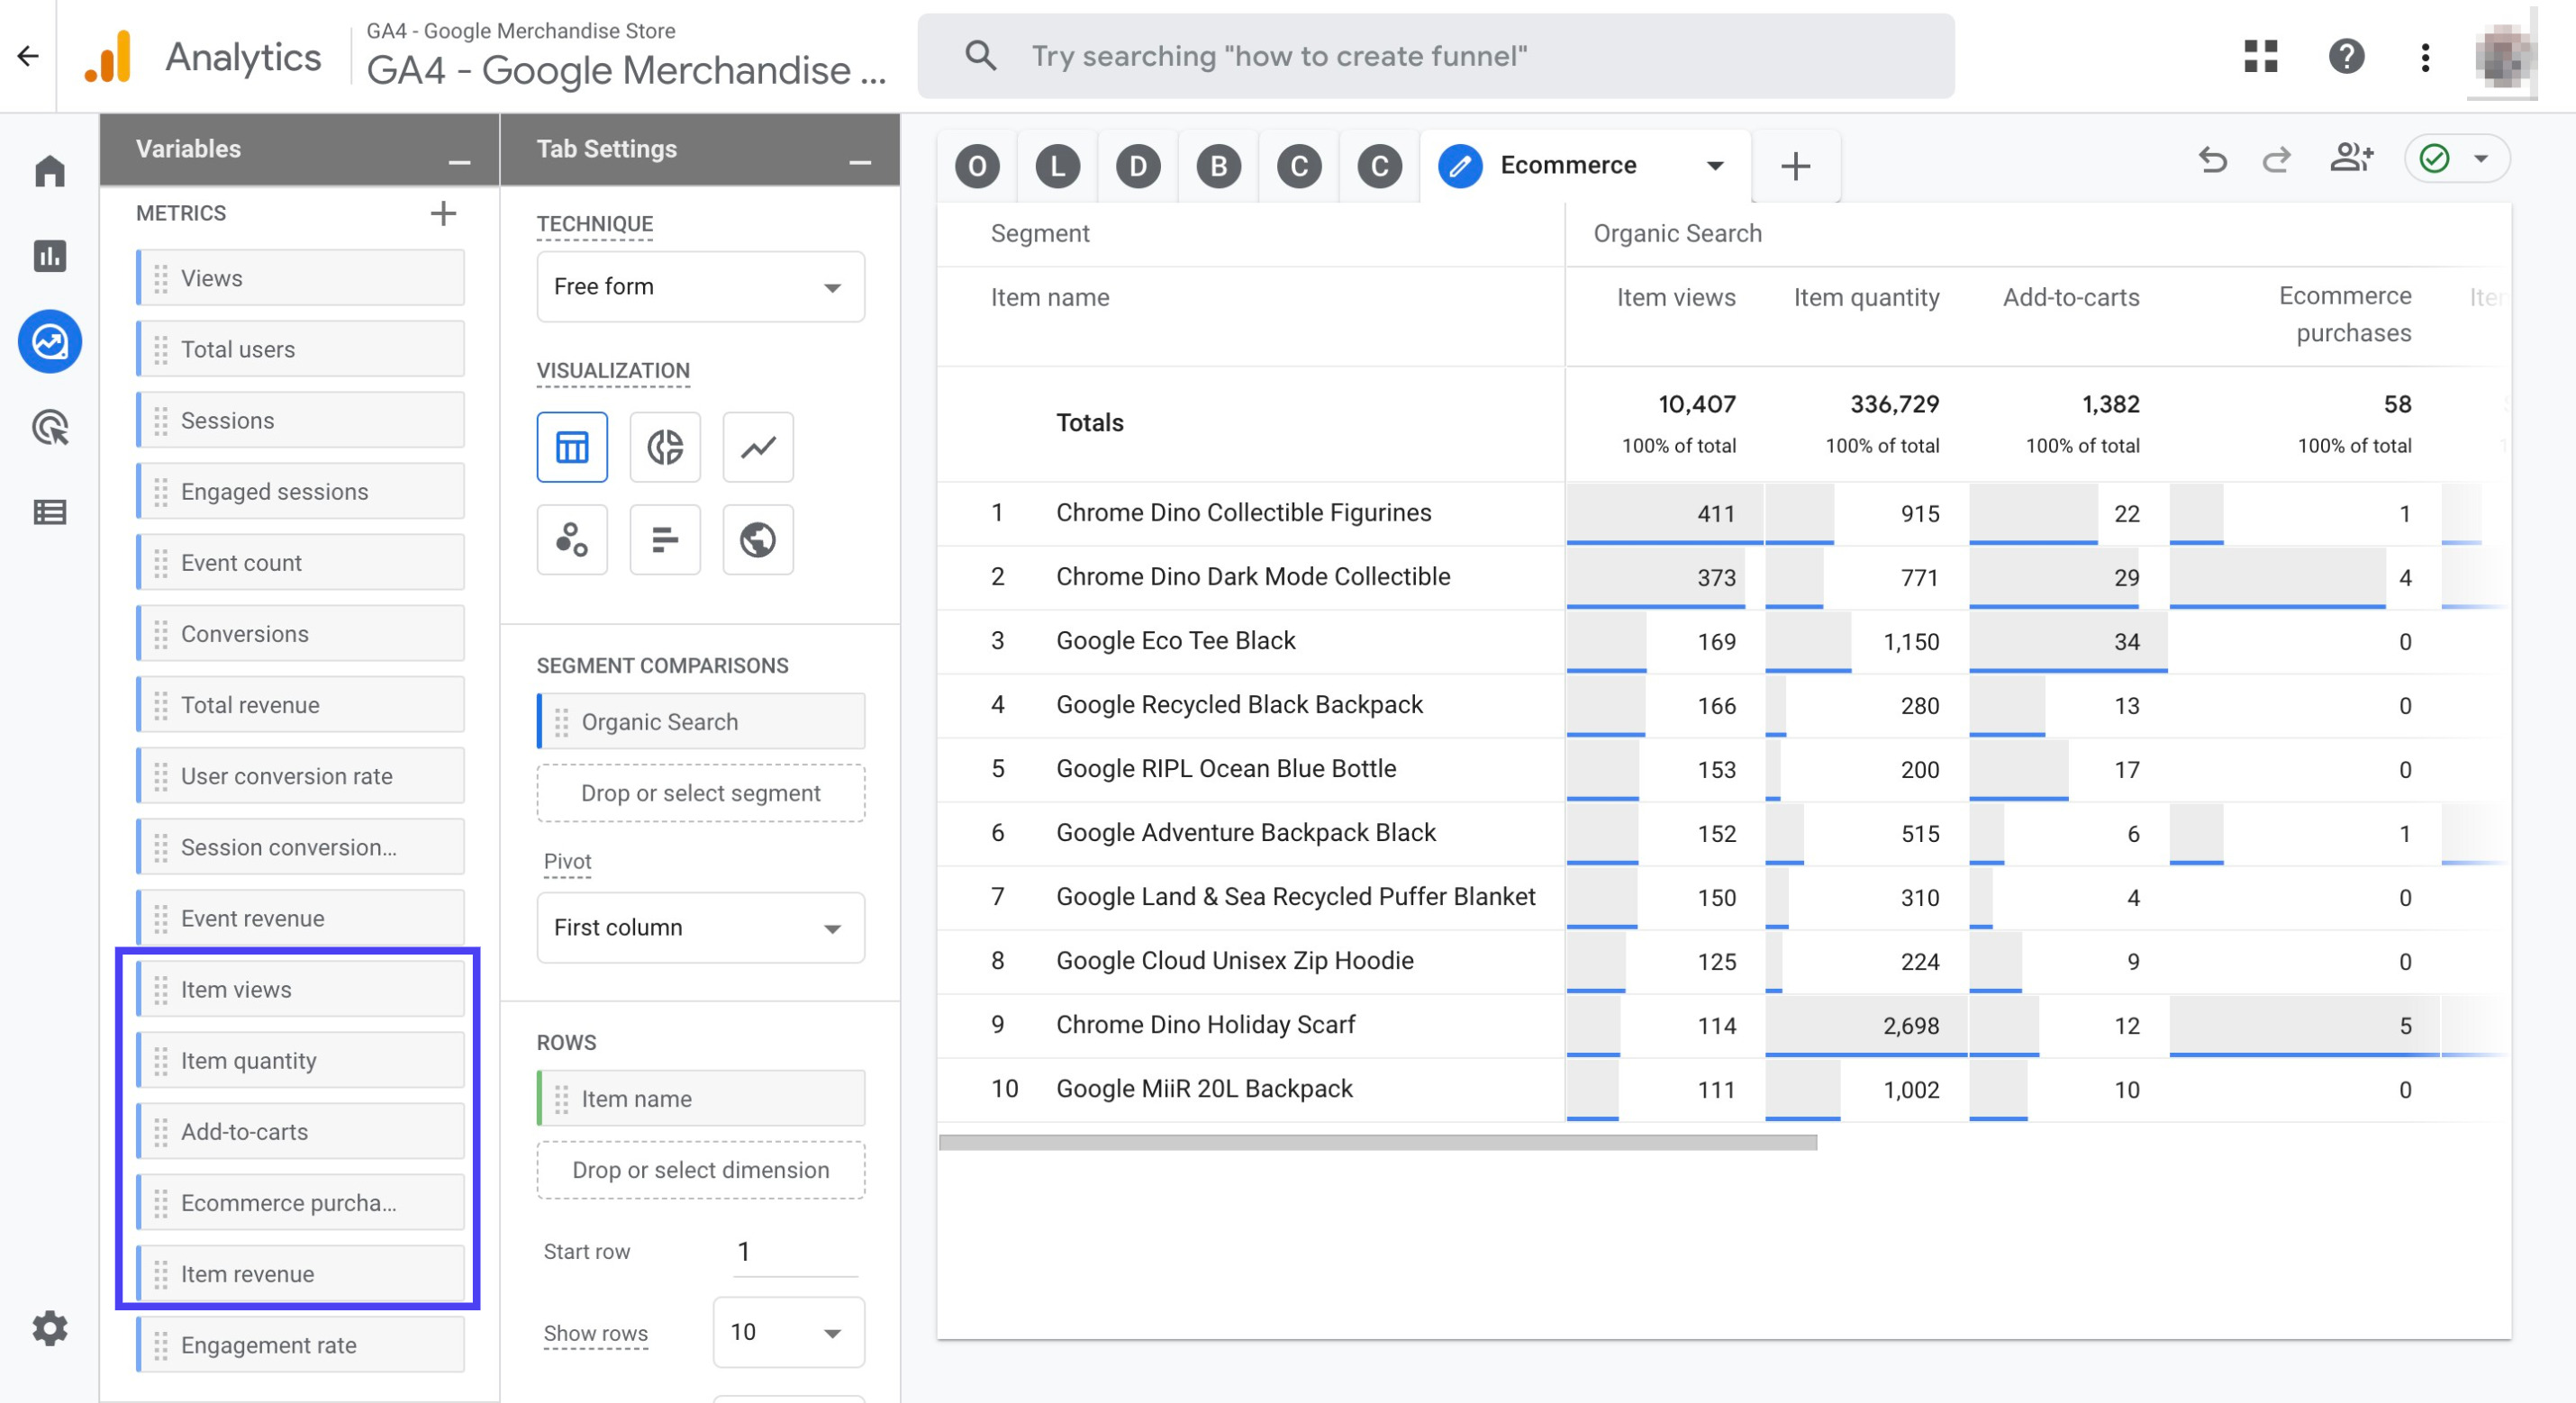
Search for the following metrics and select them by clicking the checkbox: 'Views', 'Total users', 'Sessions', 'Engaged sessions', 'Engagement rate', 'Event count', 'Conversions', 'Total revenue', 'User conversion rate', 'Session conversion rate', 'Event revenue', 'Item views', 'Item quantity', 'Add-to-carts', 'Ecommerce purchases', 'Item revenue'. Then, click 'Import' in the end Then click 'Import' in the end.
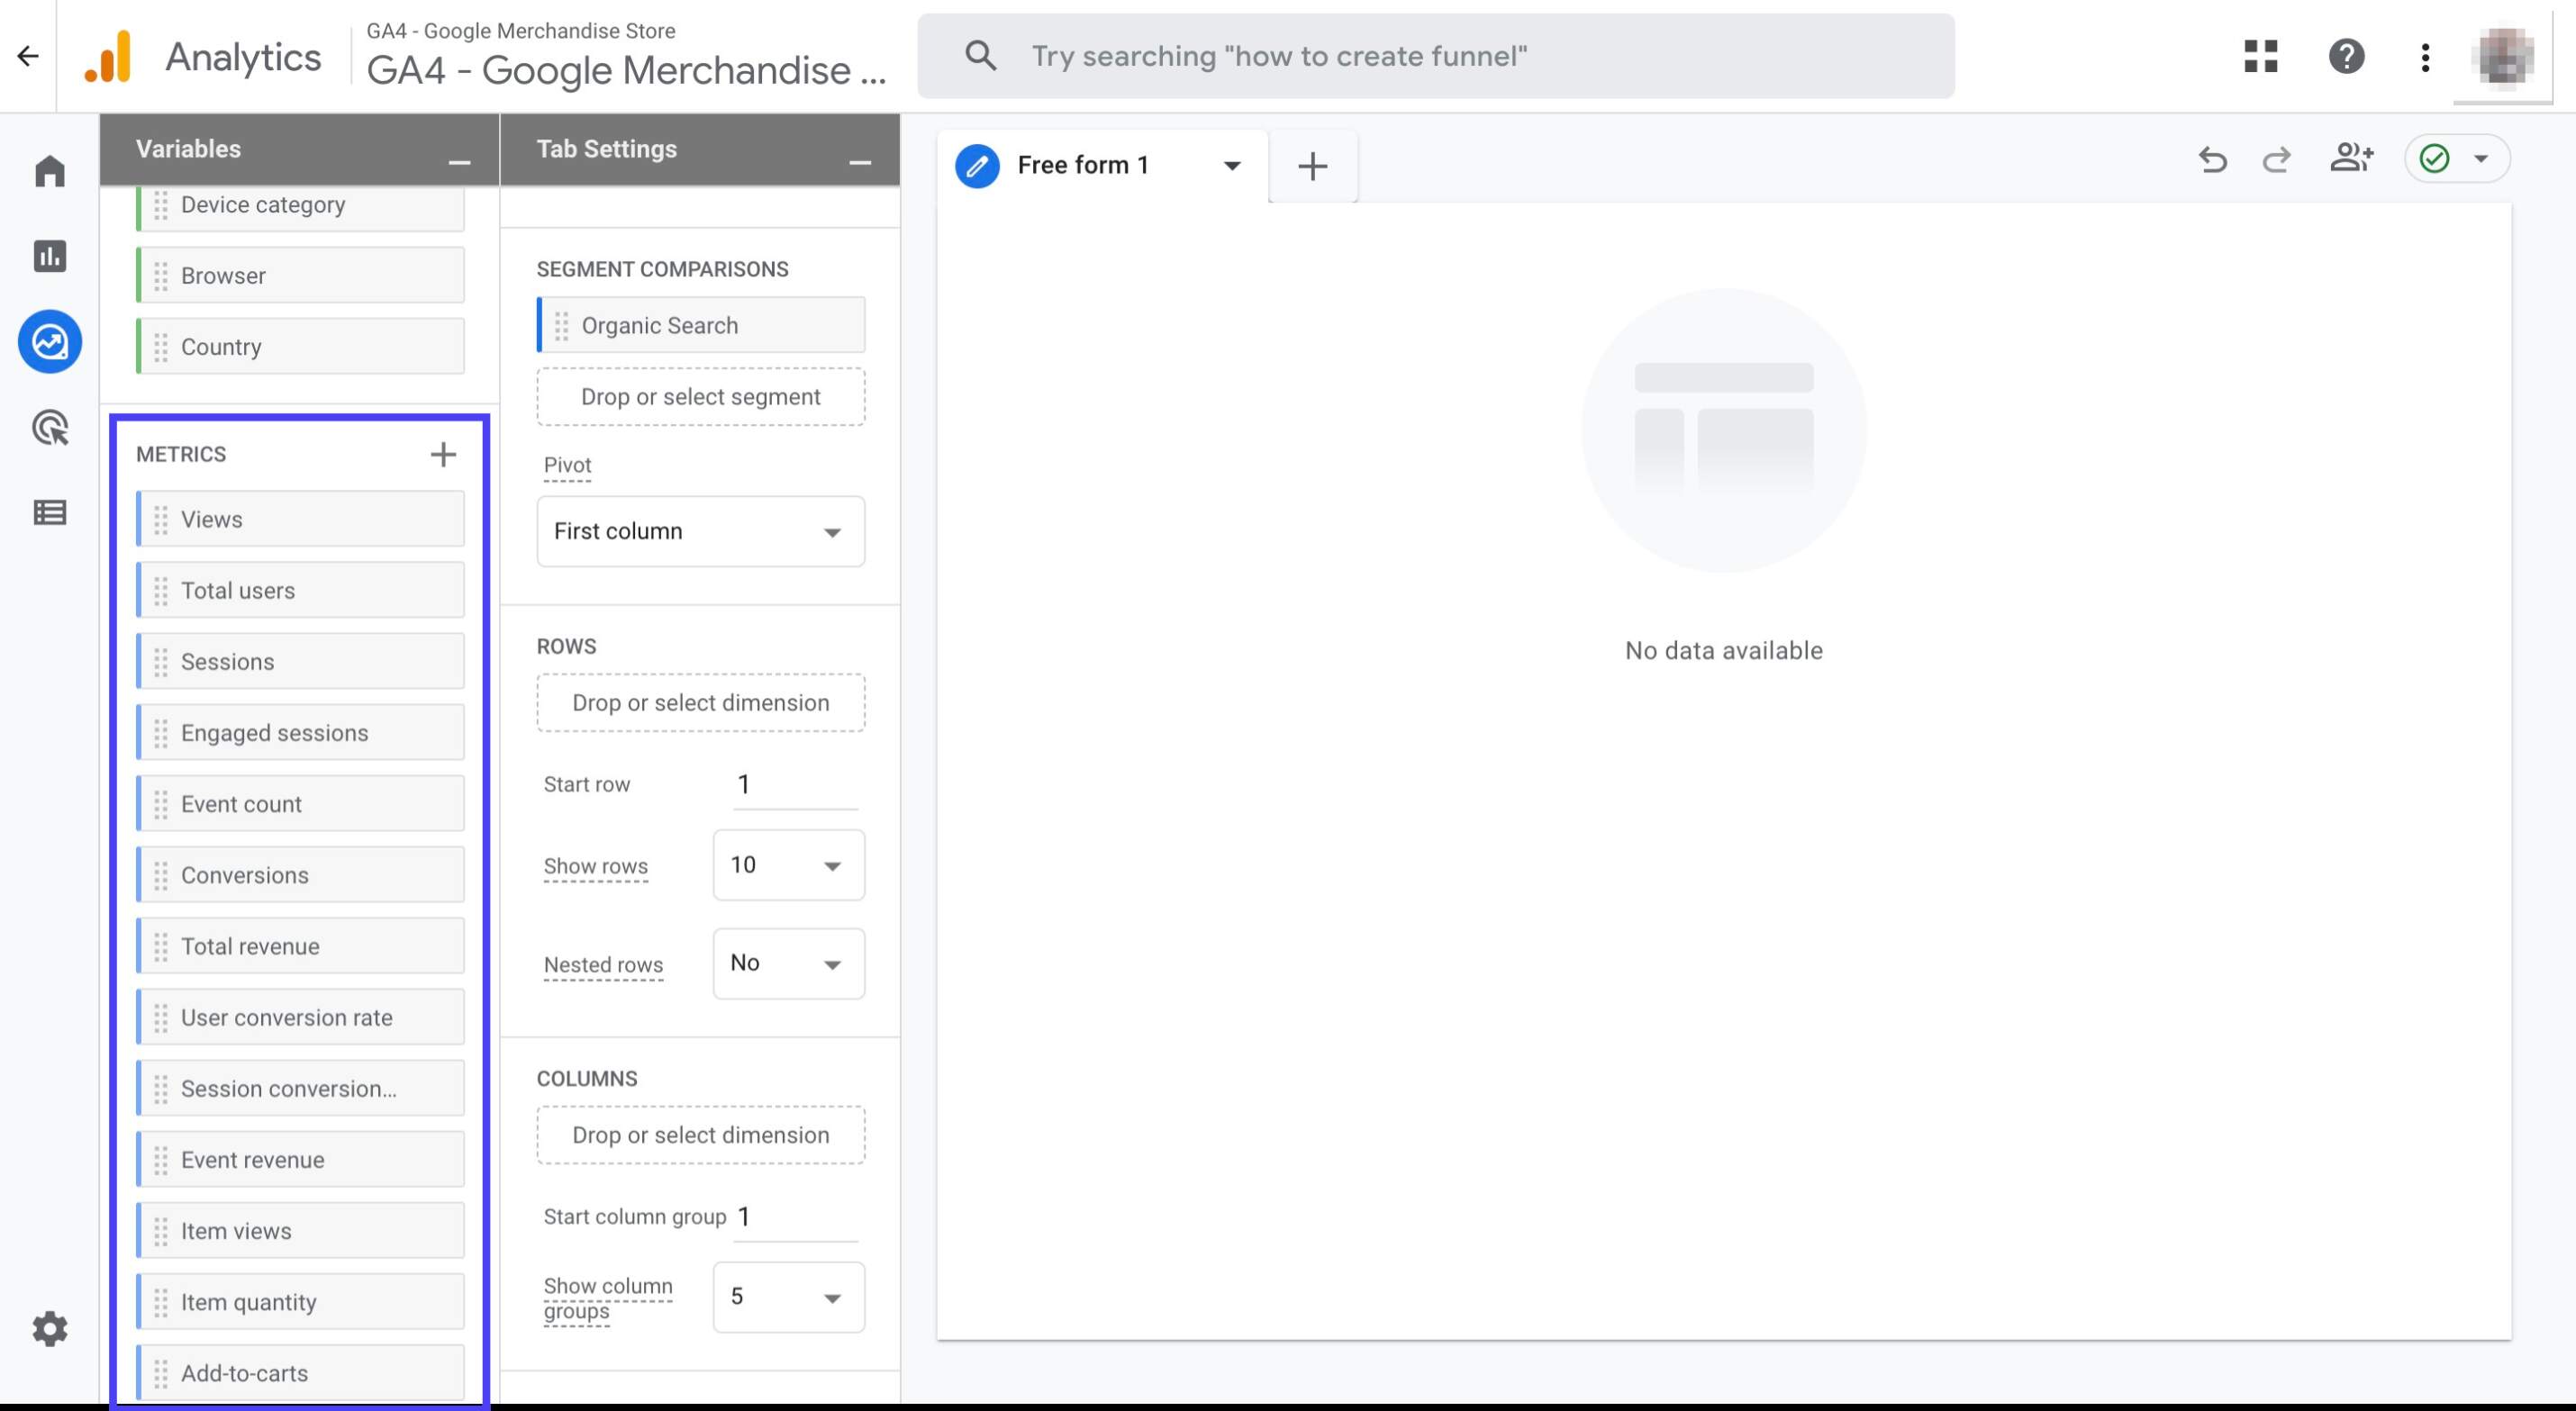
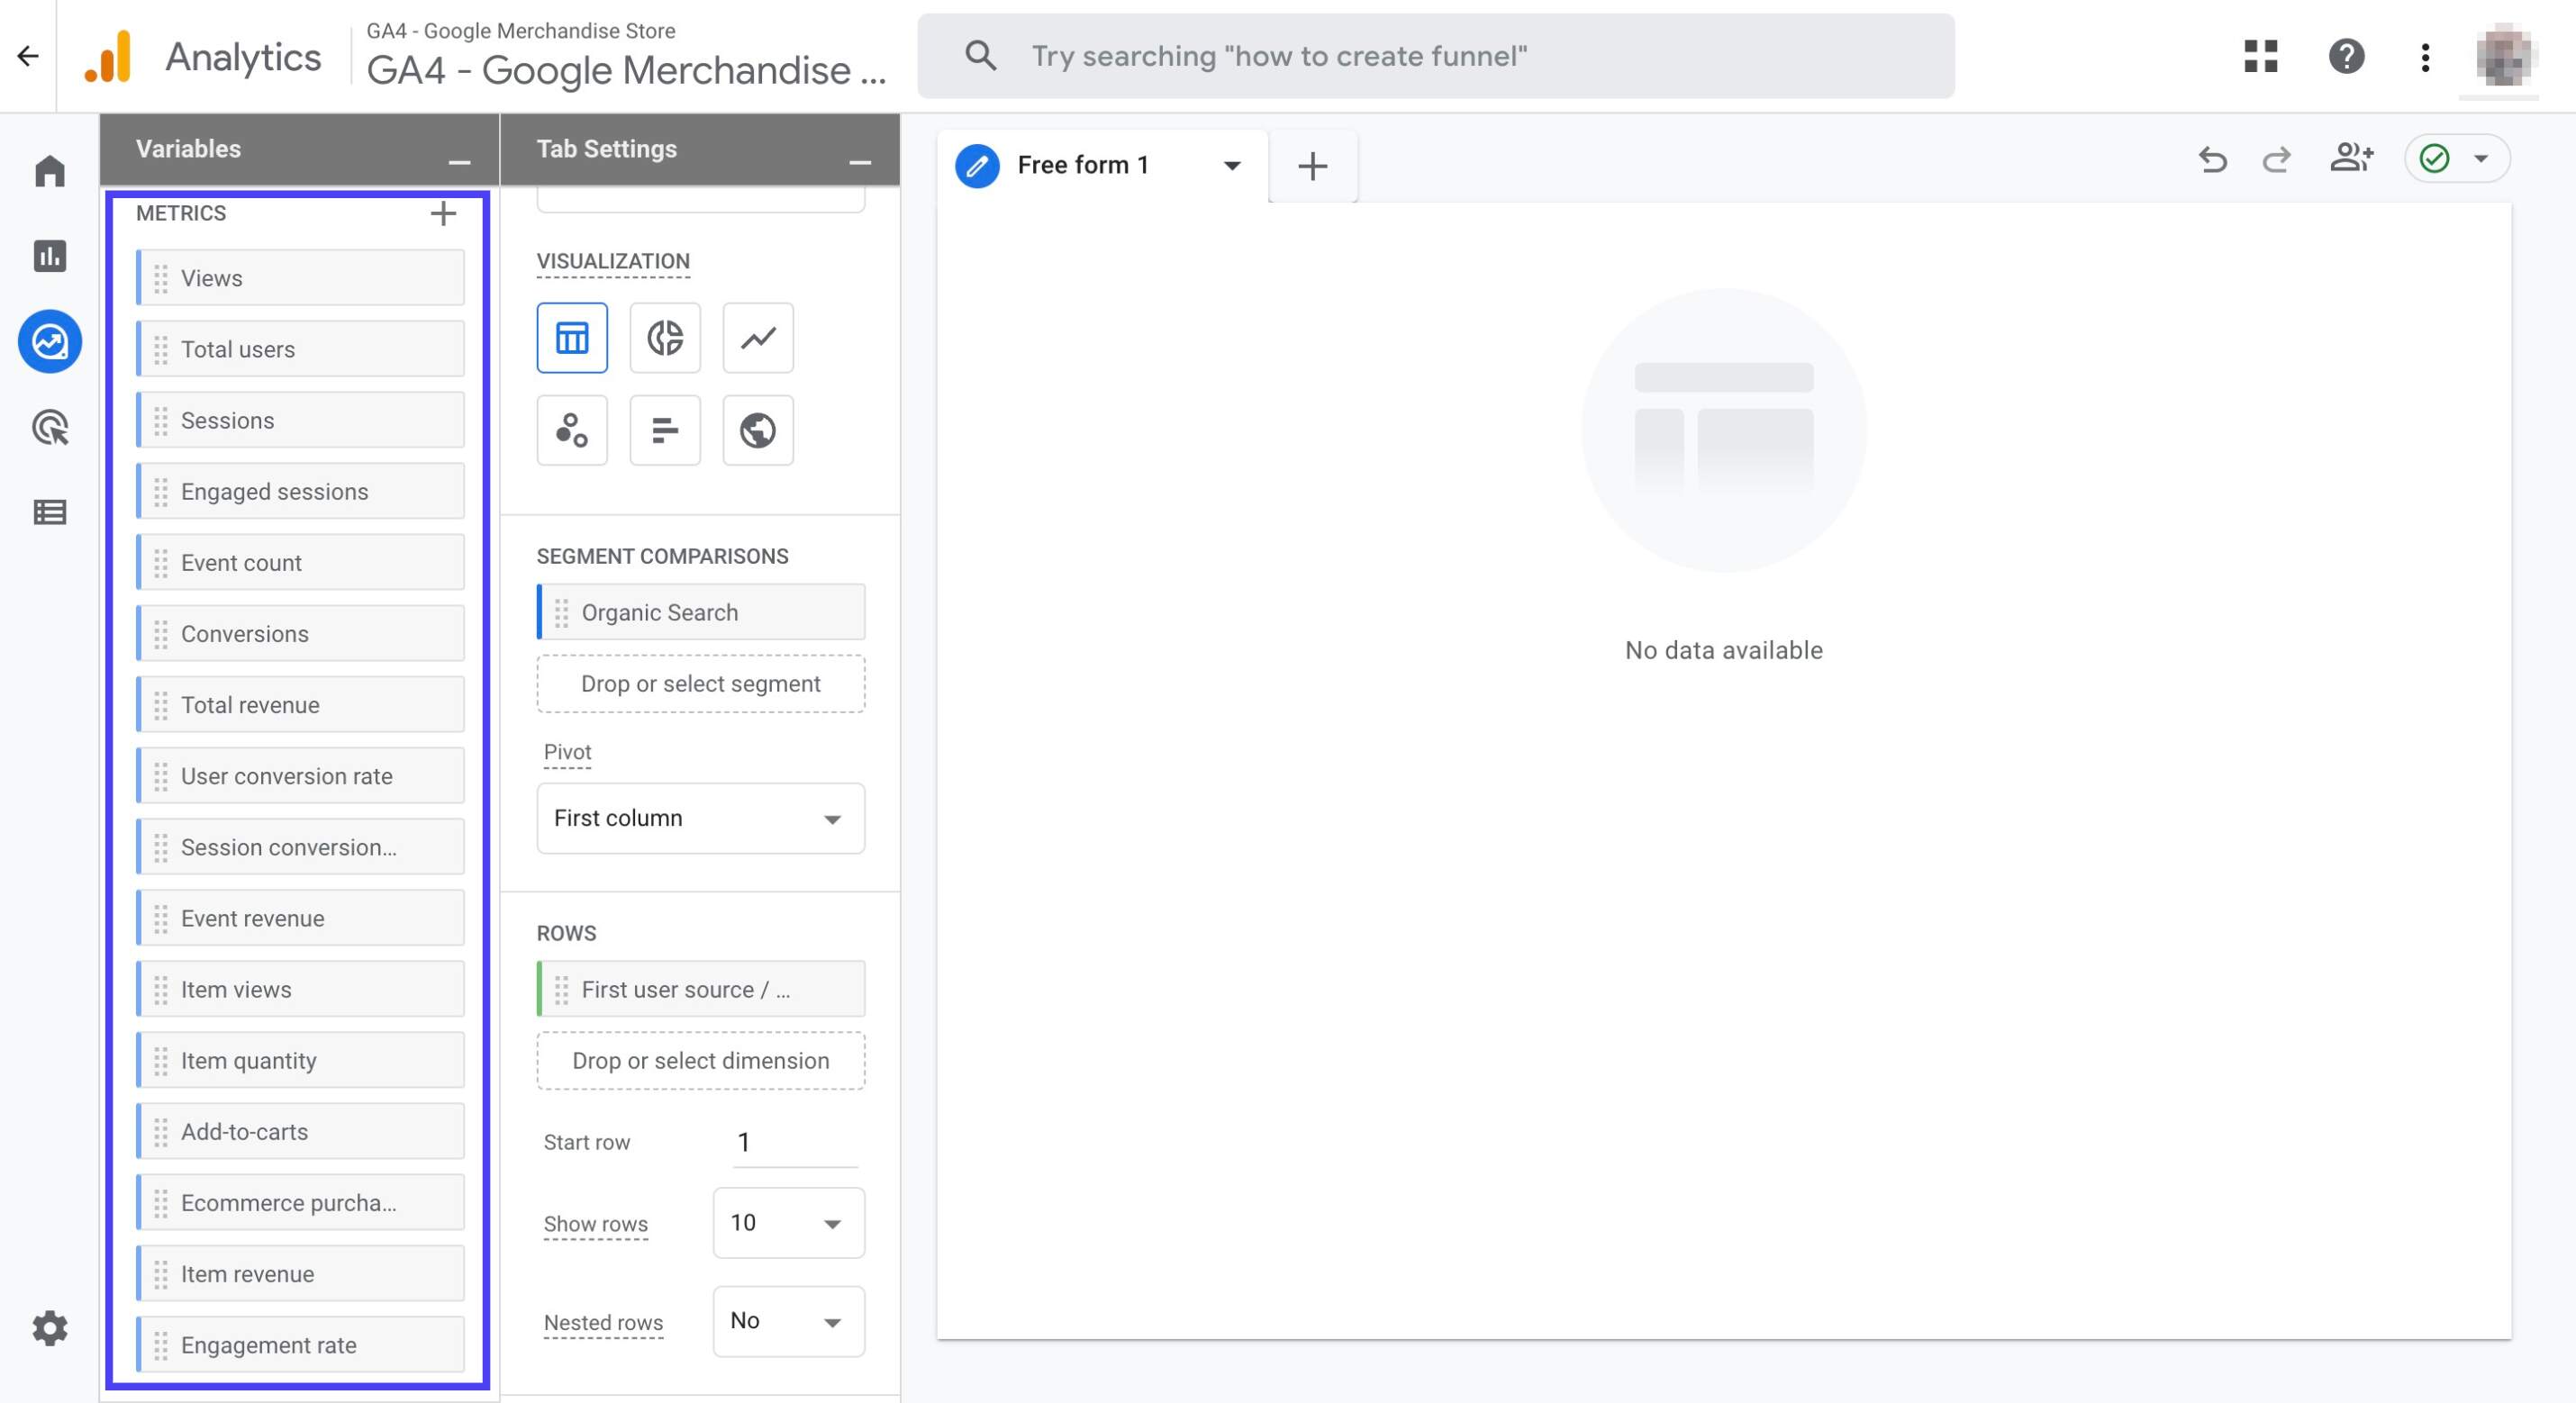
Now, you should be able to see all the imported metrics as shown in the graphic
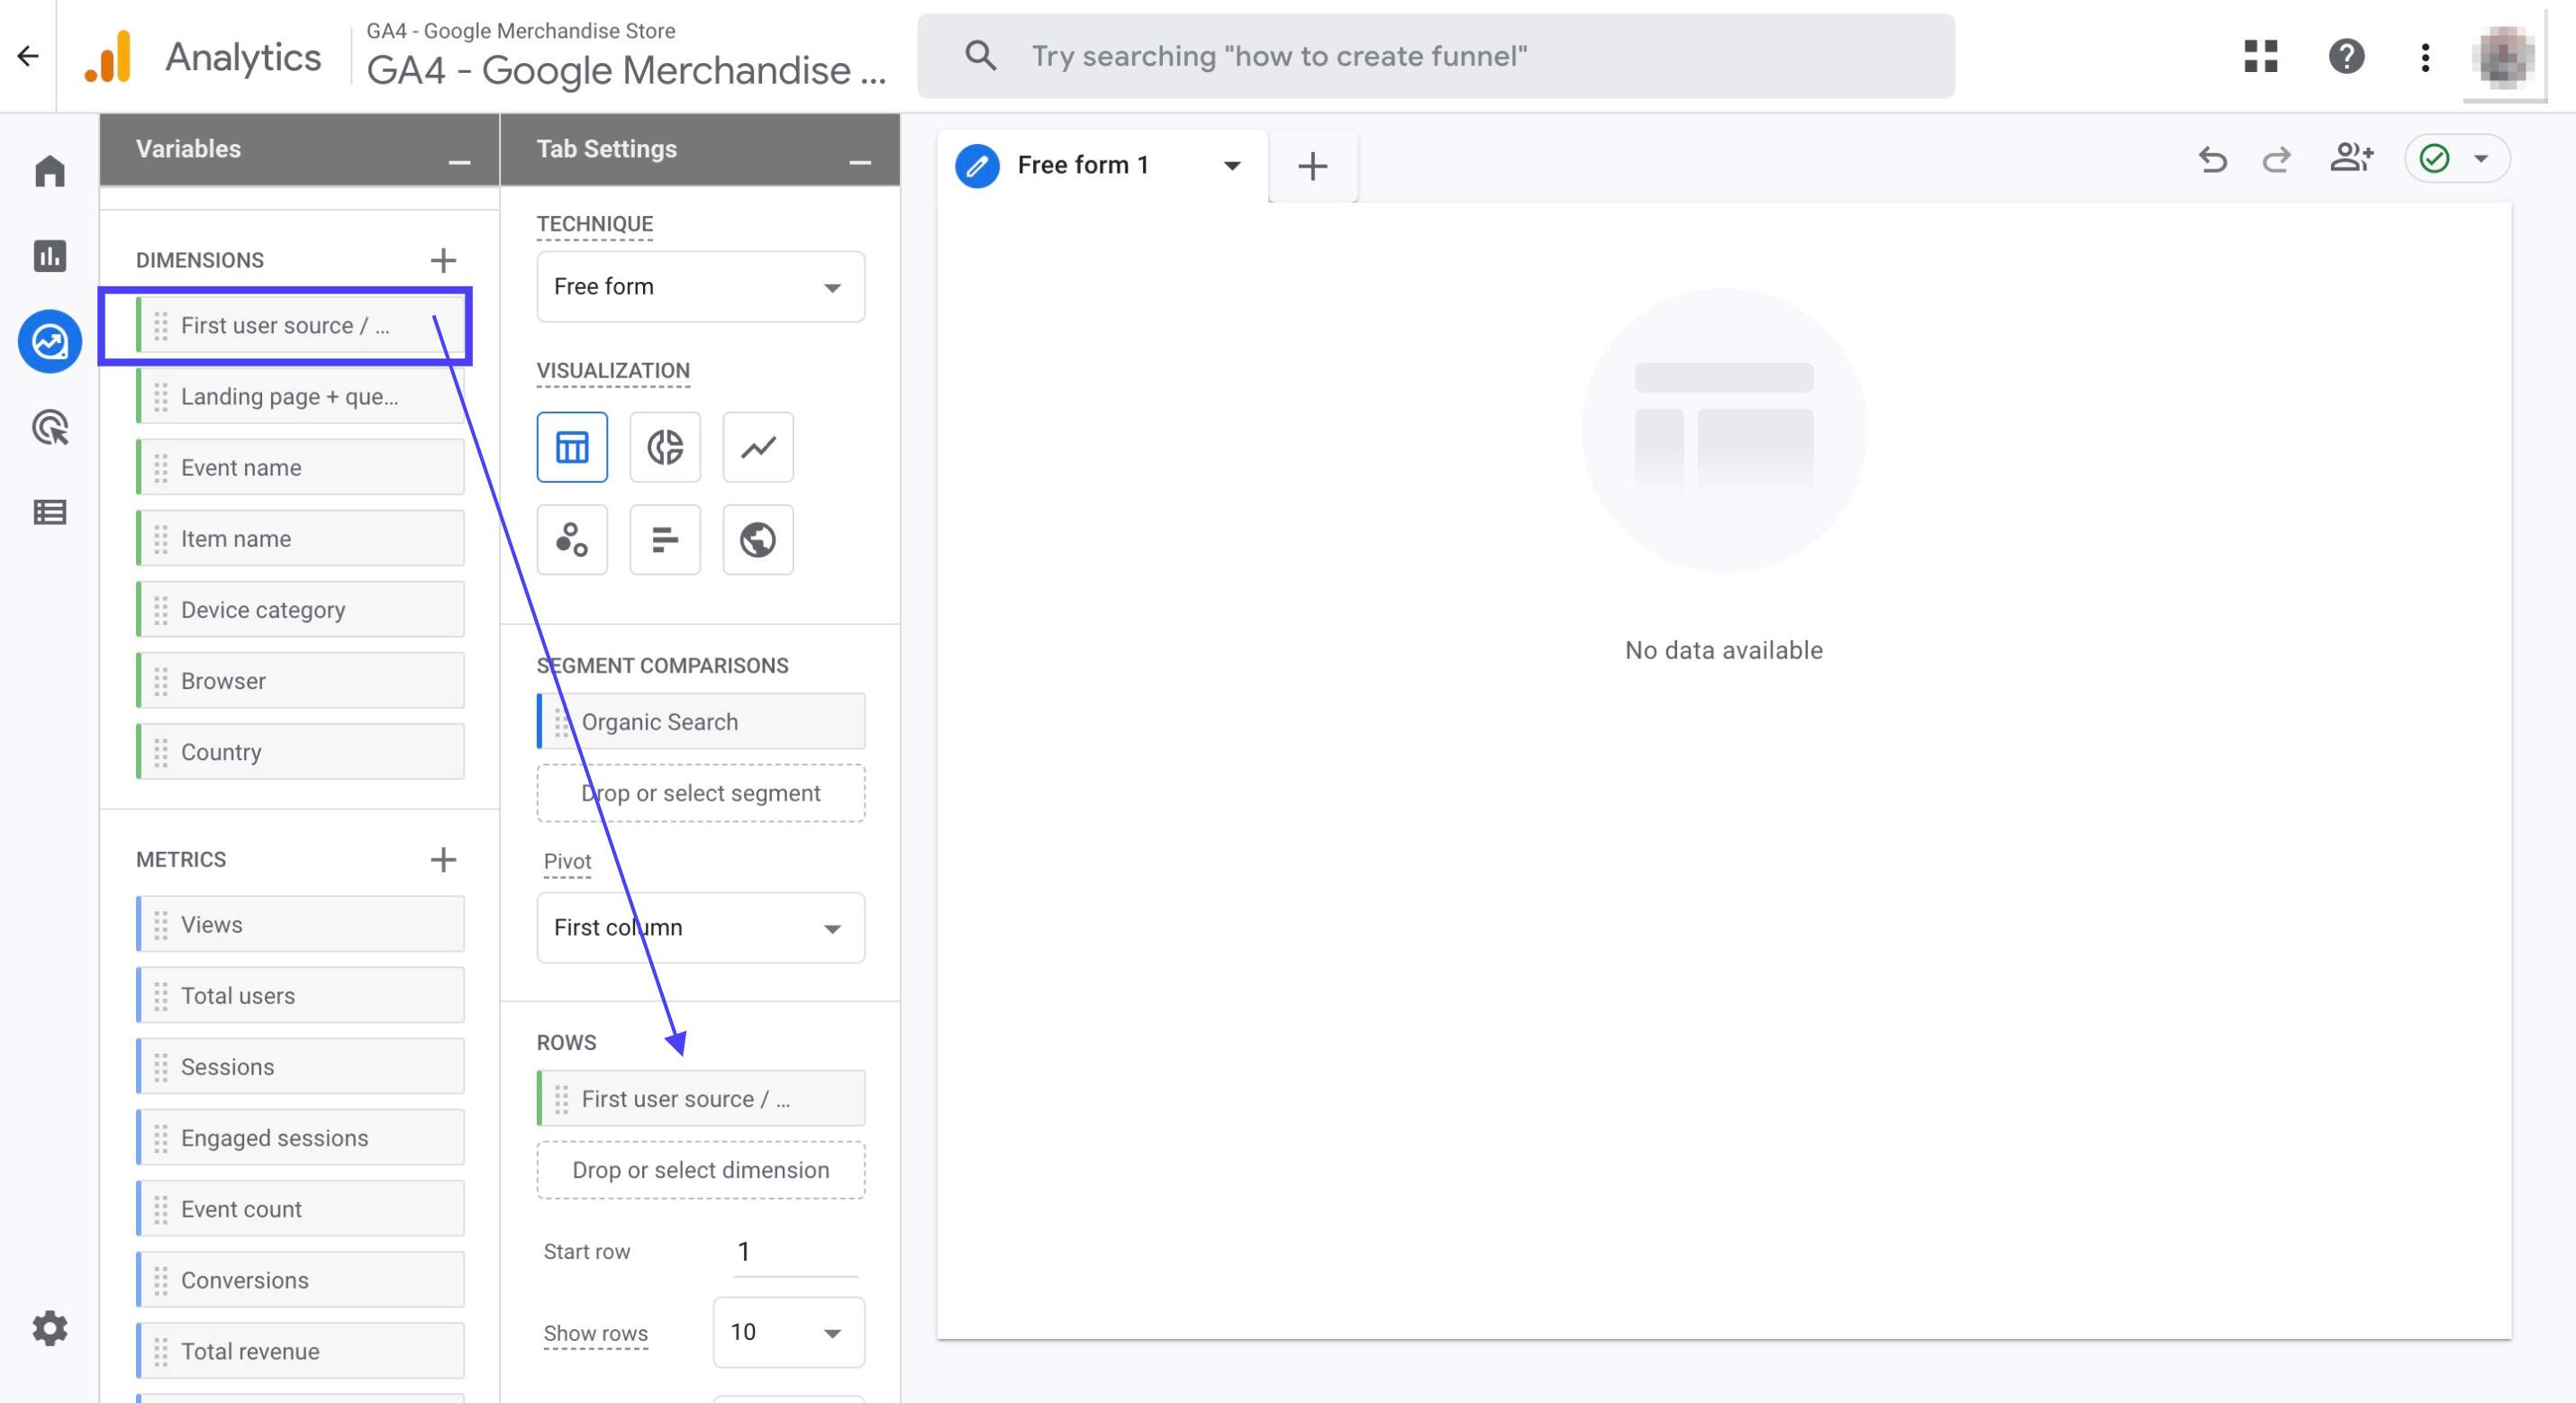
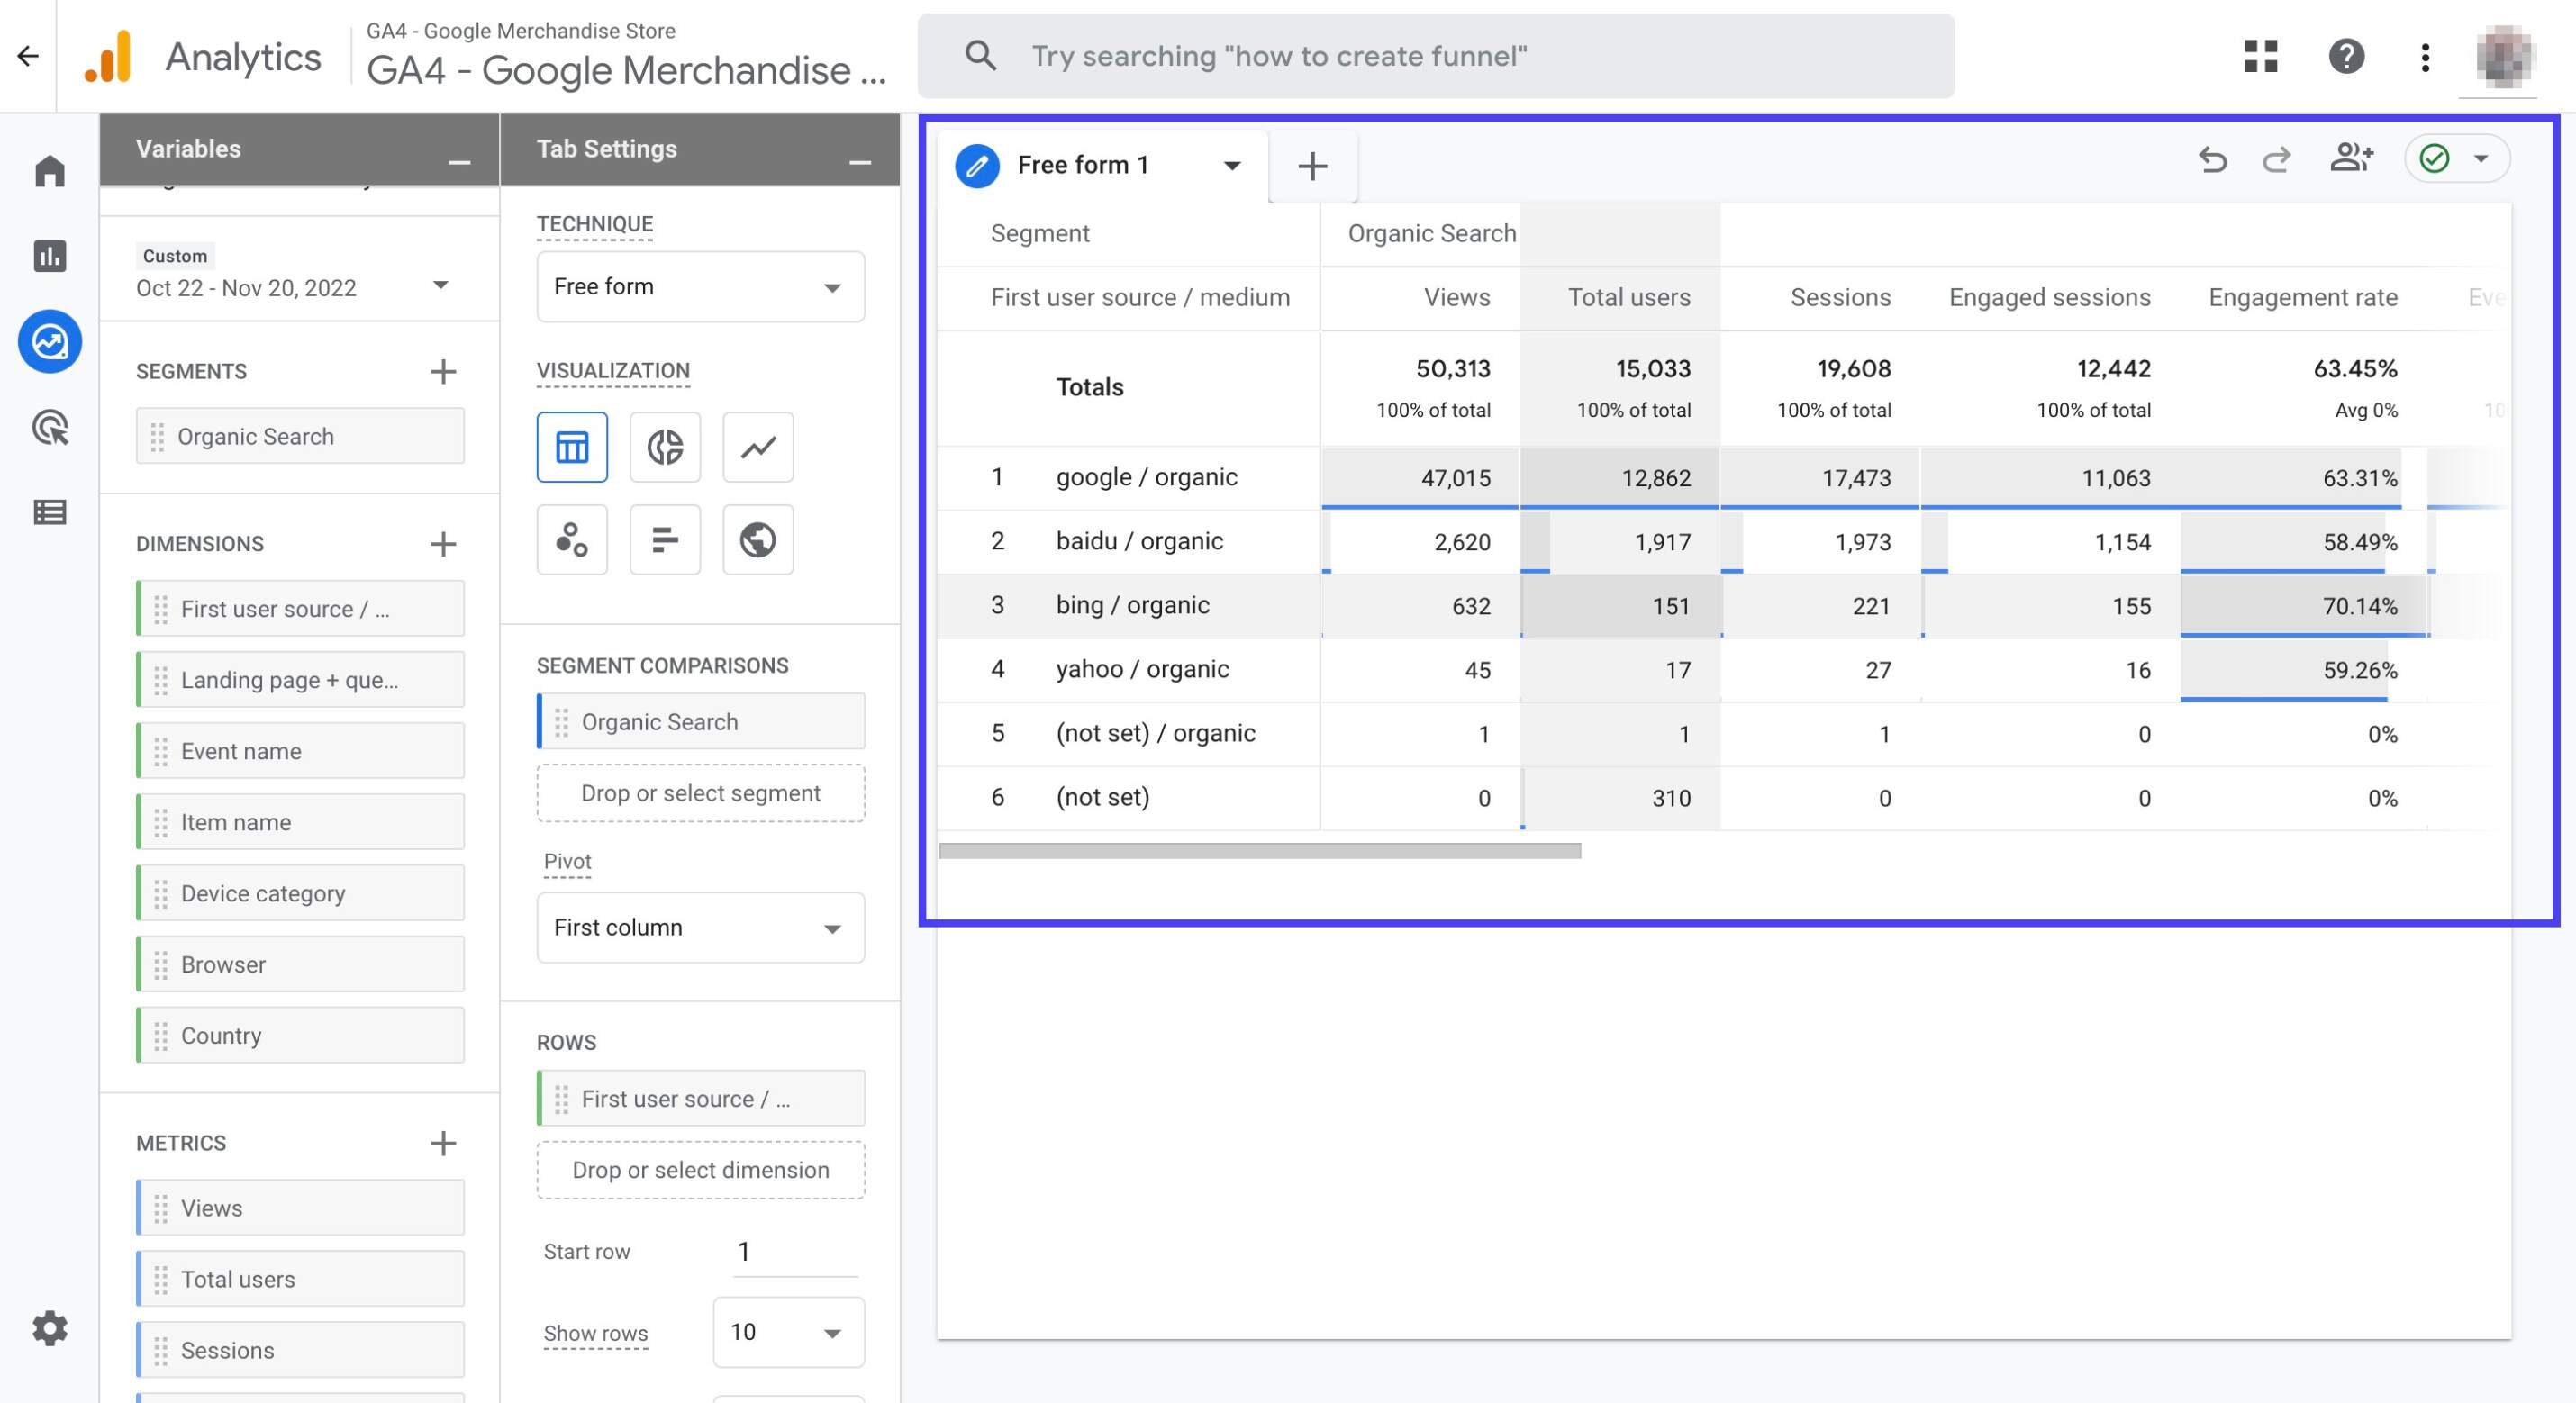
Now, double click on the 'First user source / medium' dimension to add it to the 'Rows' secion
Double click the following metrics to add them to your blank canvas on the right: 'Views', 'Total users', 'Sessions', 'Engaged sessions', 'Engagement rate', 'Event count', 'Conversions', 'Total revenue'
You should be able to see the dimensions and metrics that you've added to your report now
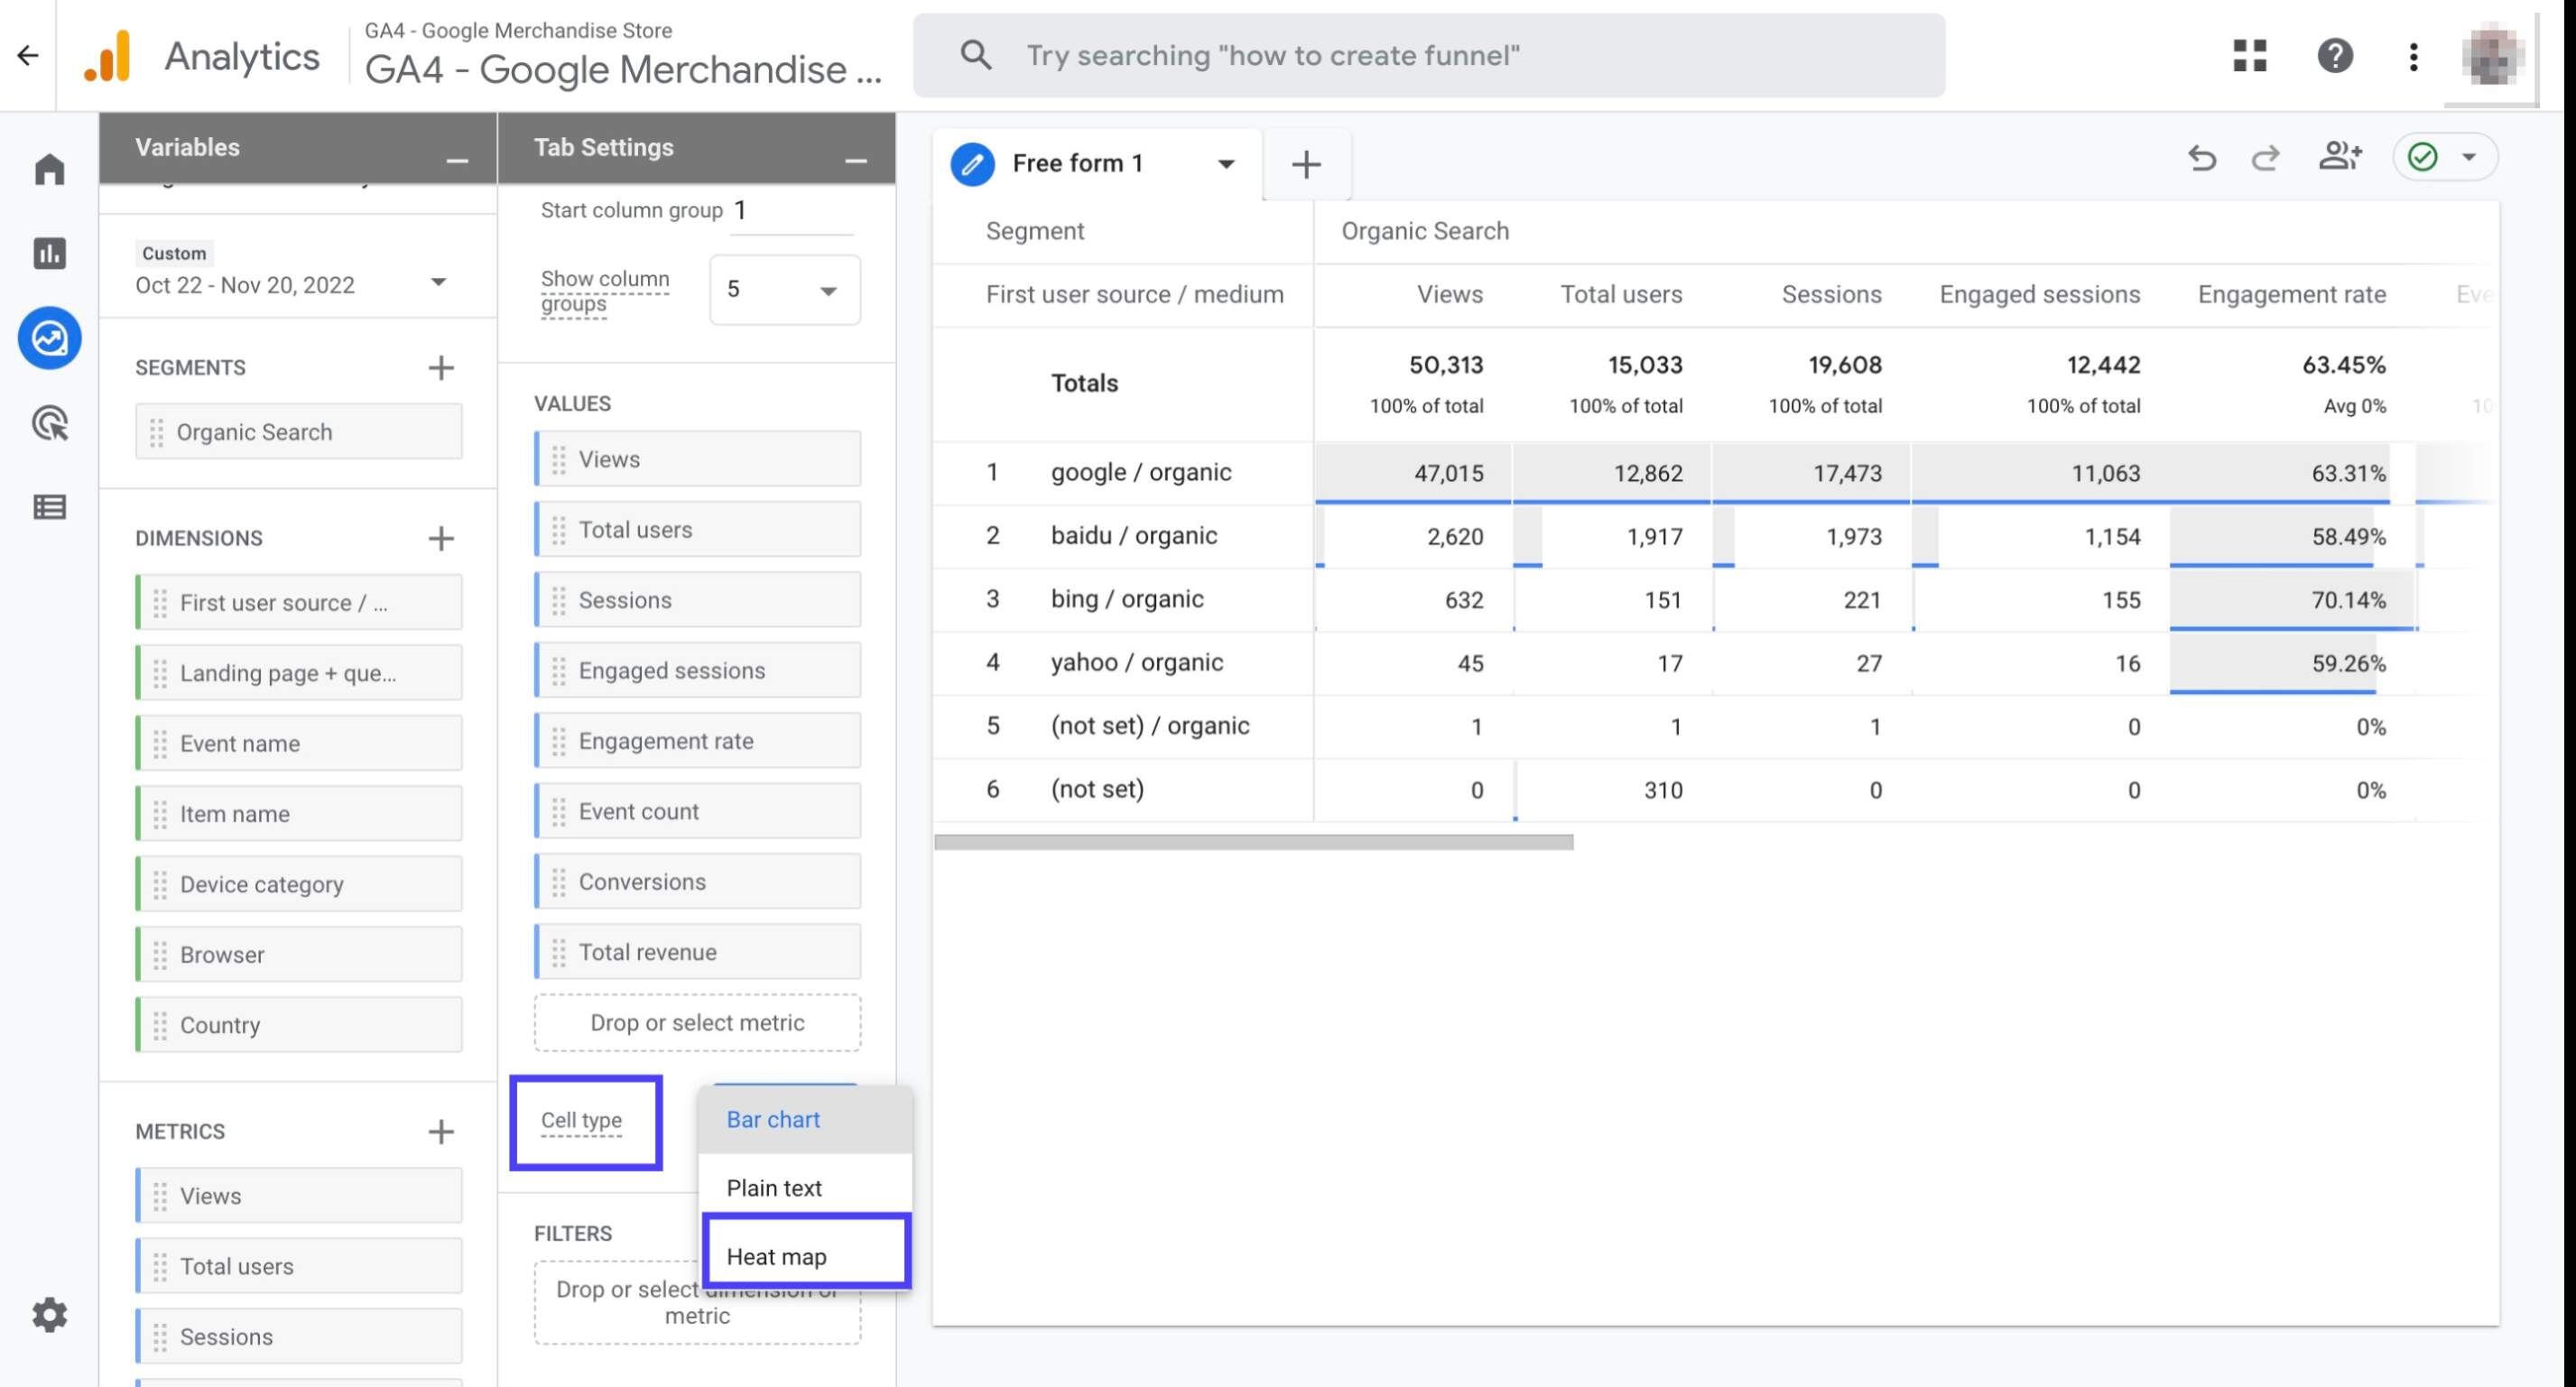
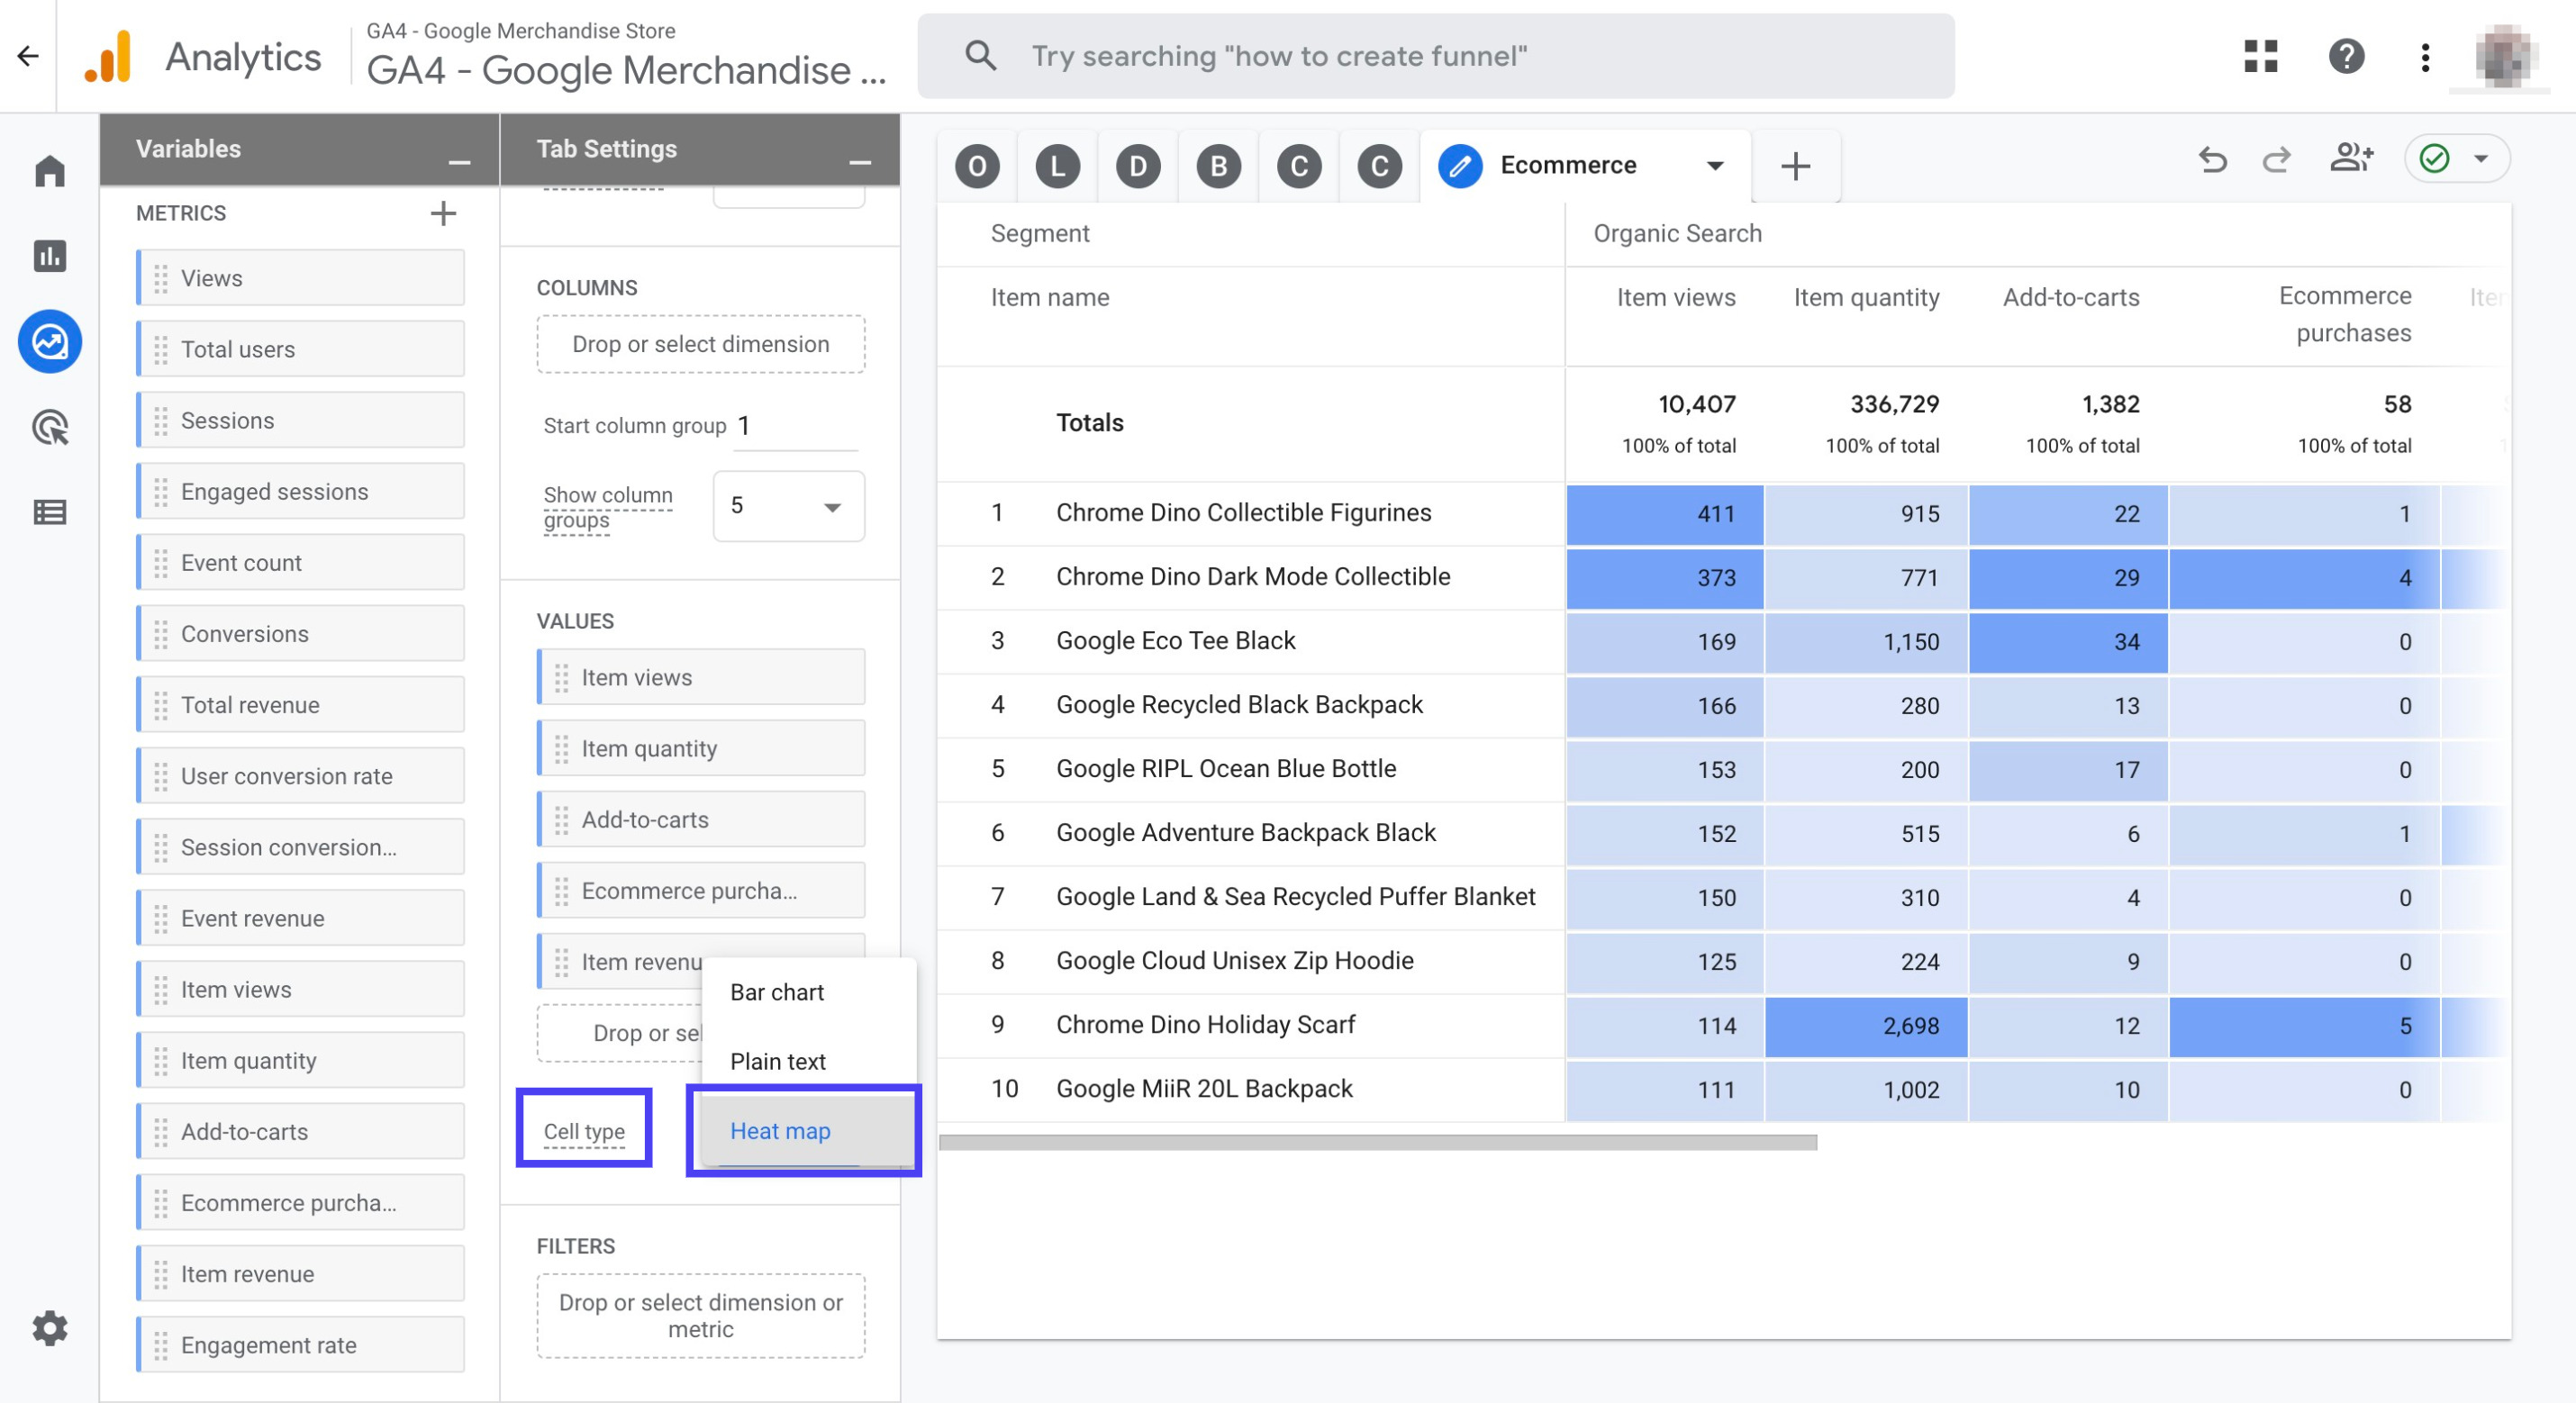
Scroll down to find 'Cell type'. Click on the drop-down menu and choose 'Heat Map'
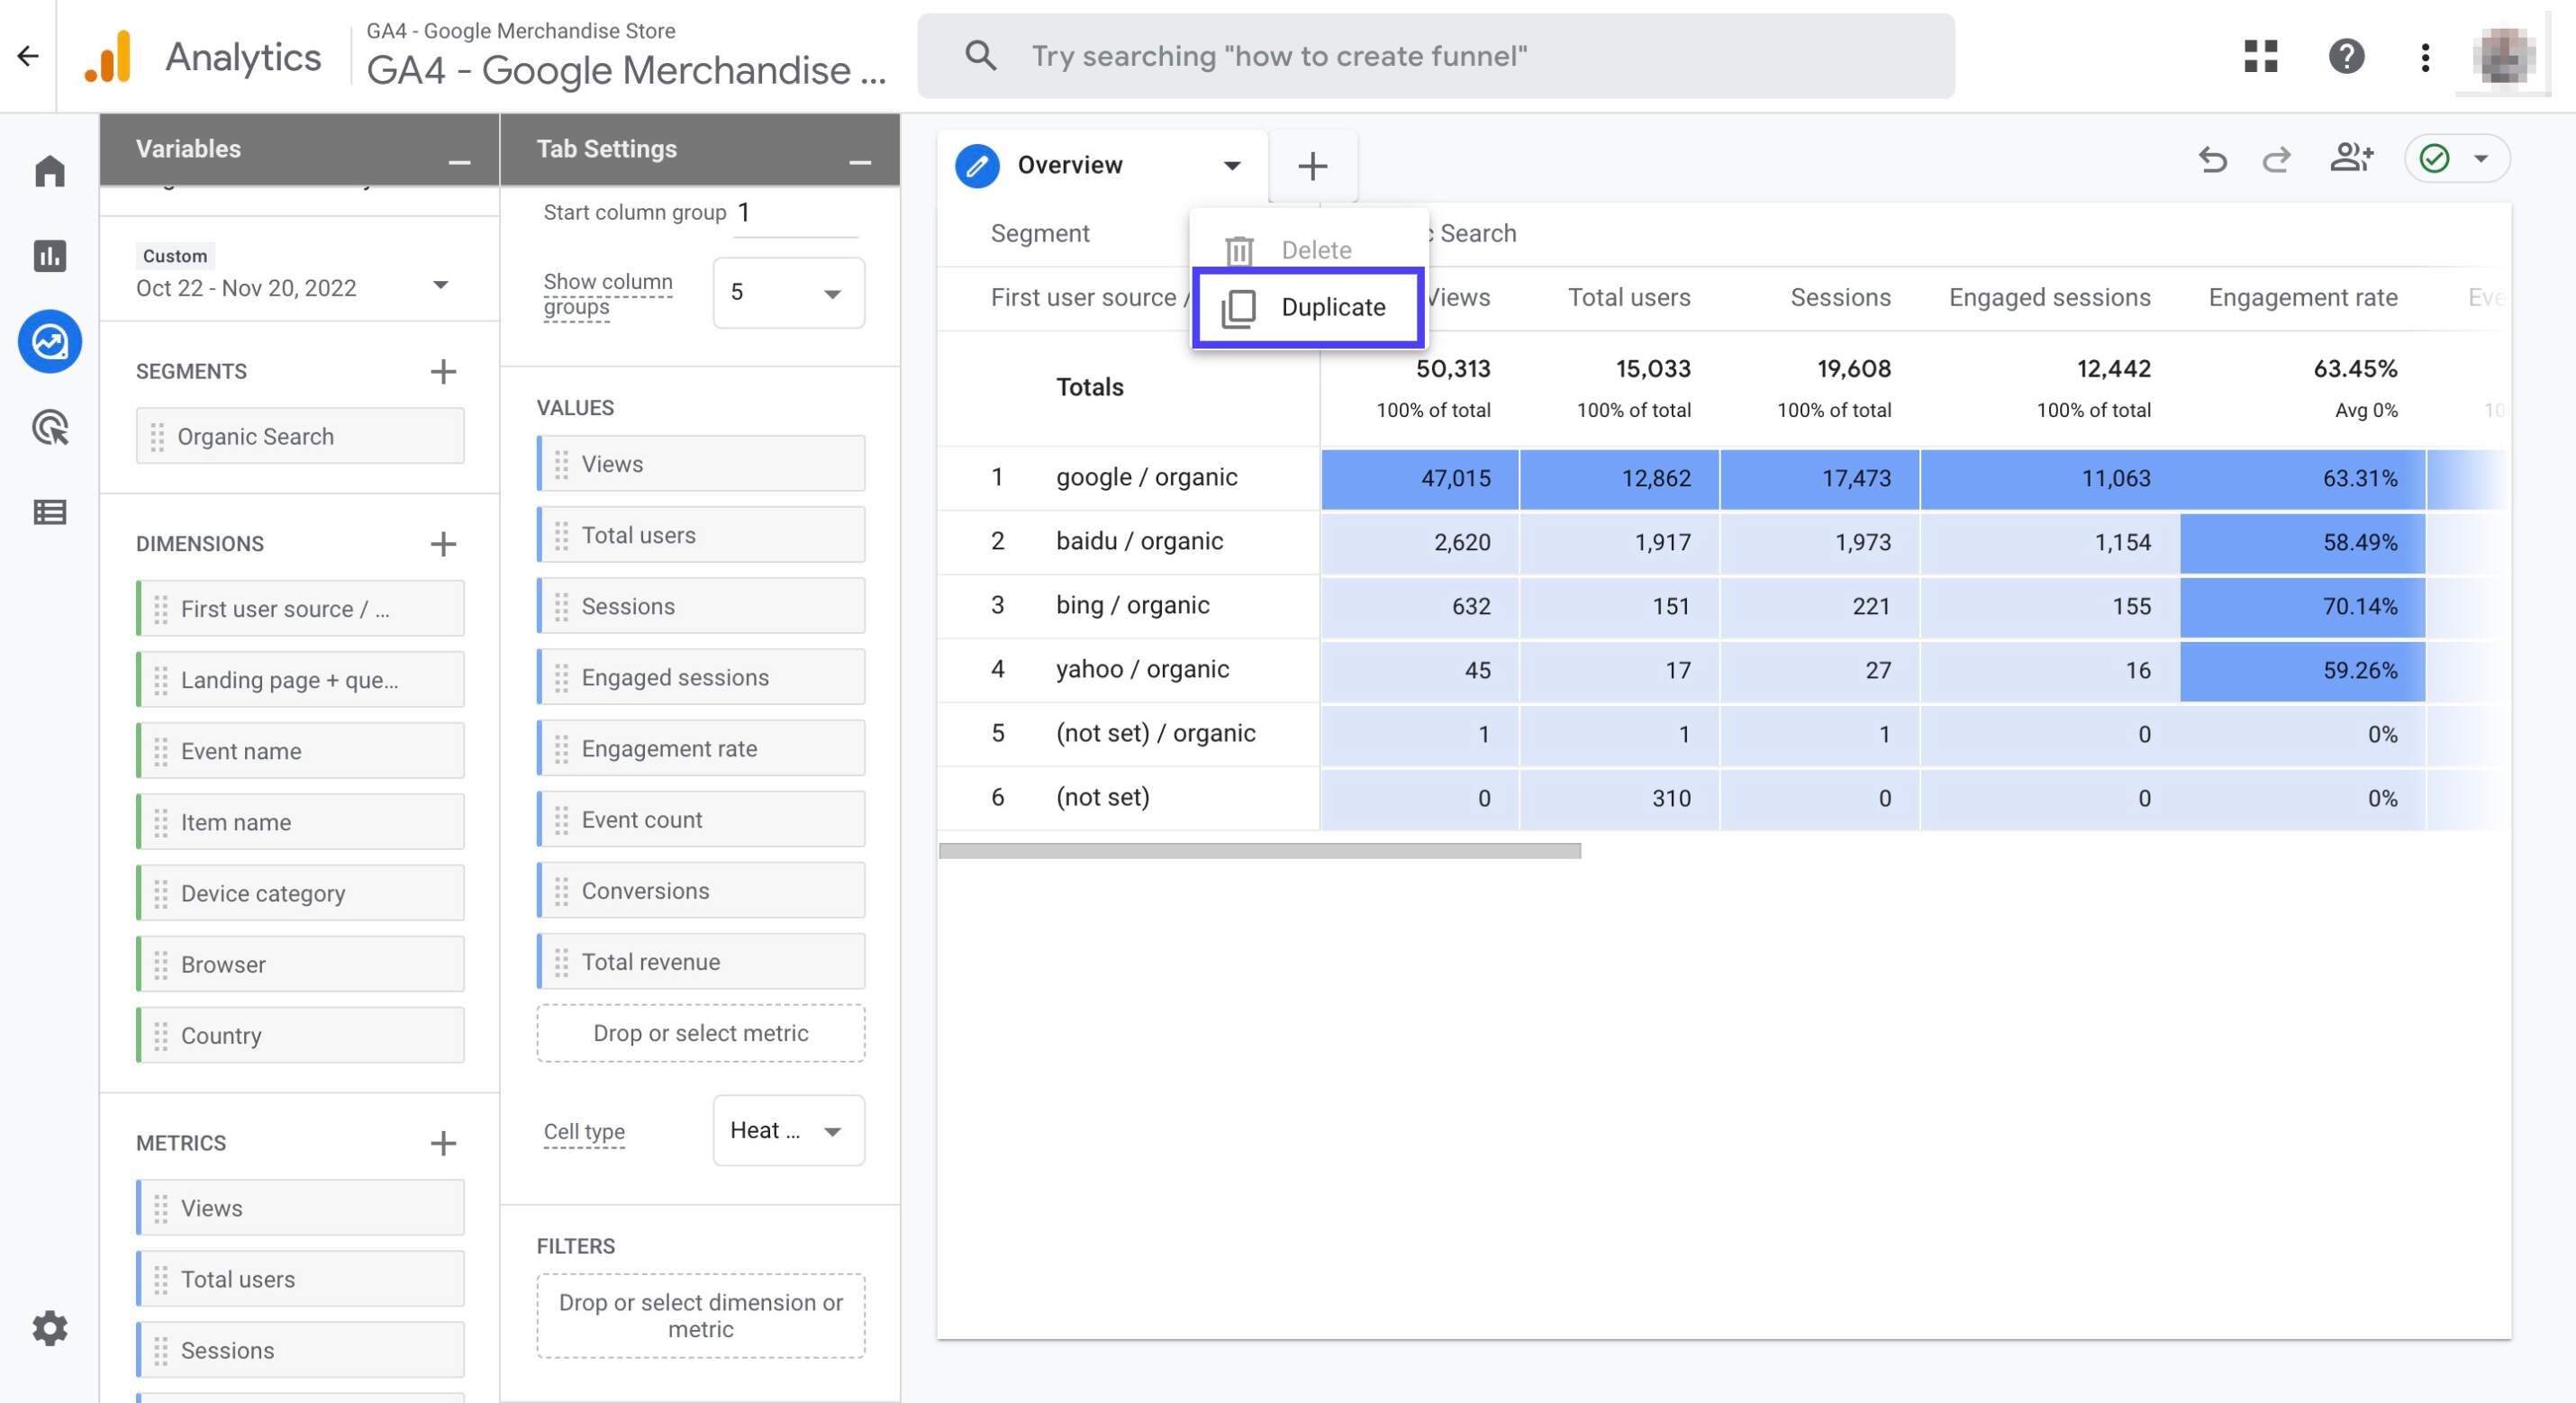
Double click on the 'Free form 1' and then rename it as 'Overview'

Click on the little arrow sign right next to 'Overview'. Then, click 'Duplicate'
Name the new tab as 'Landing Pages'
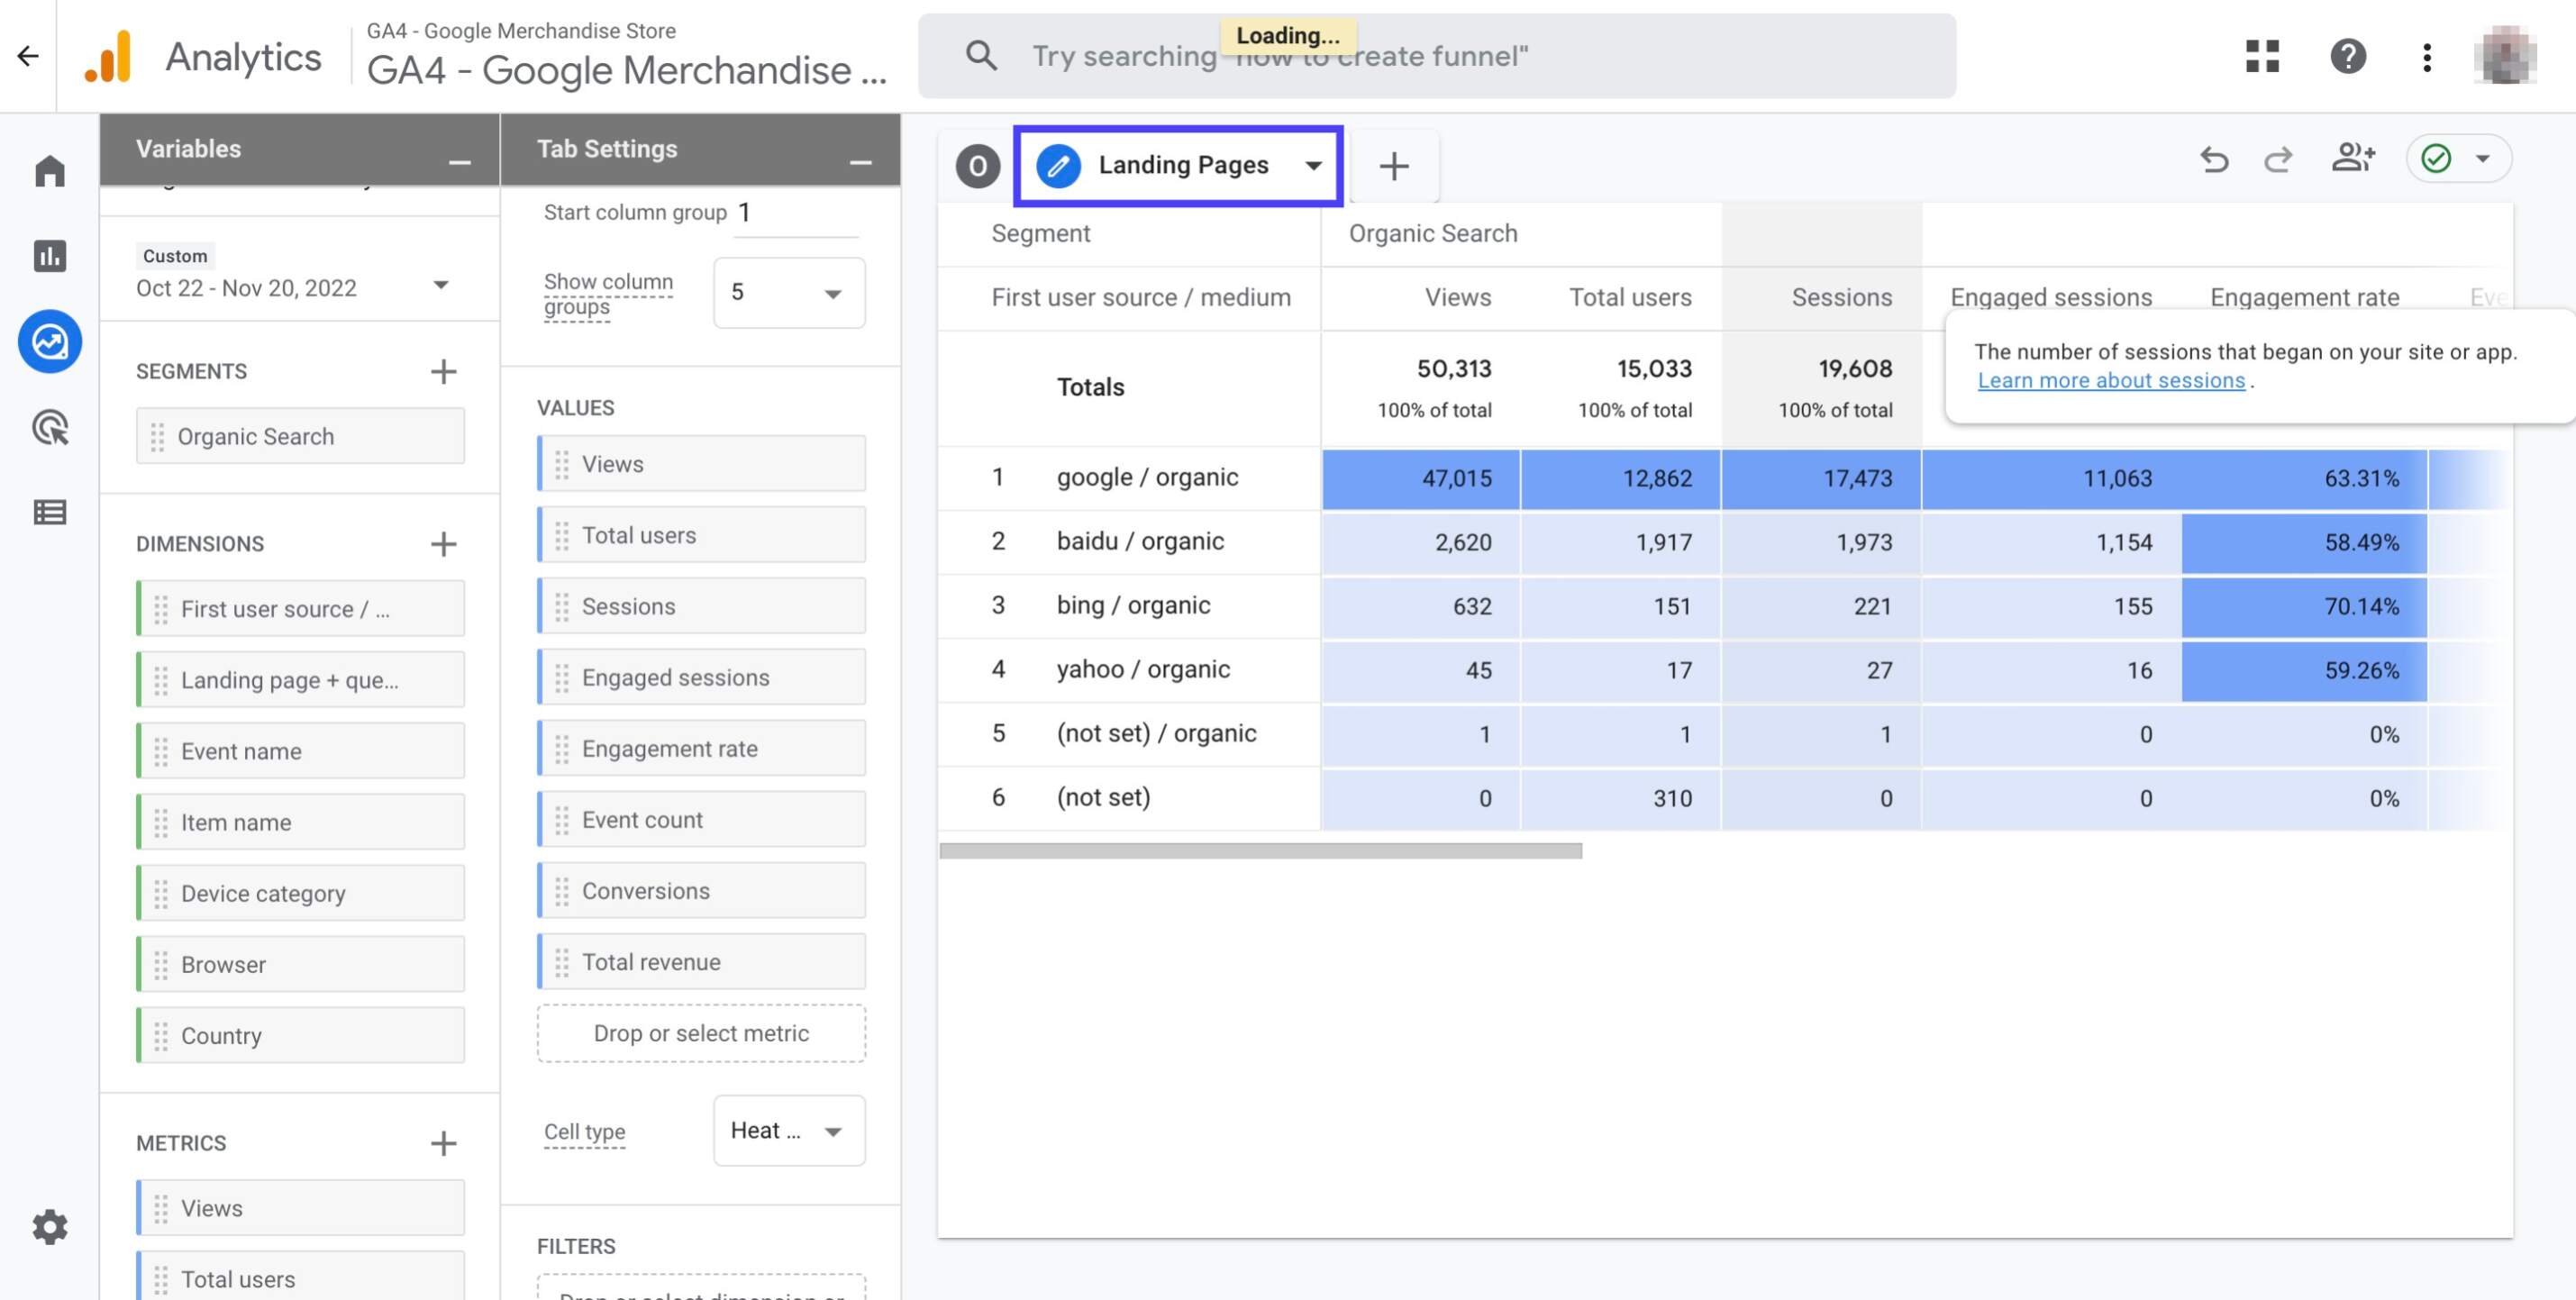
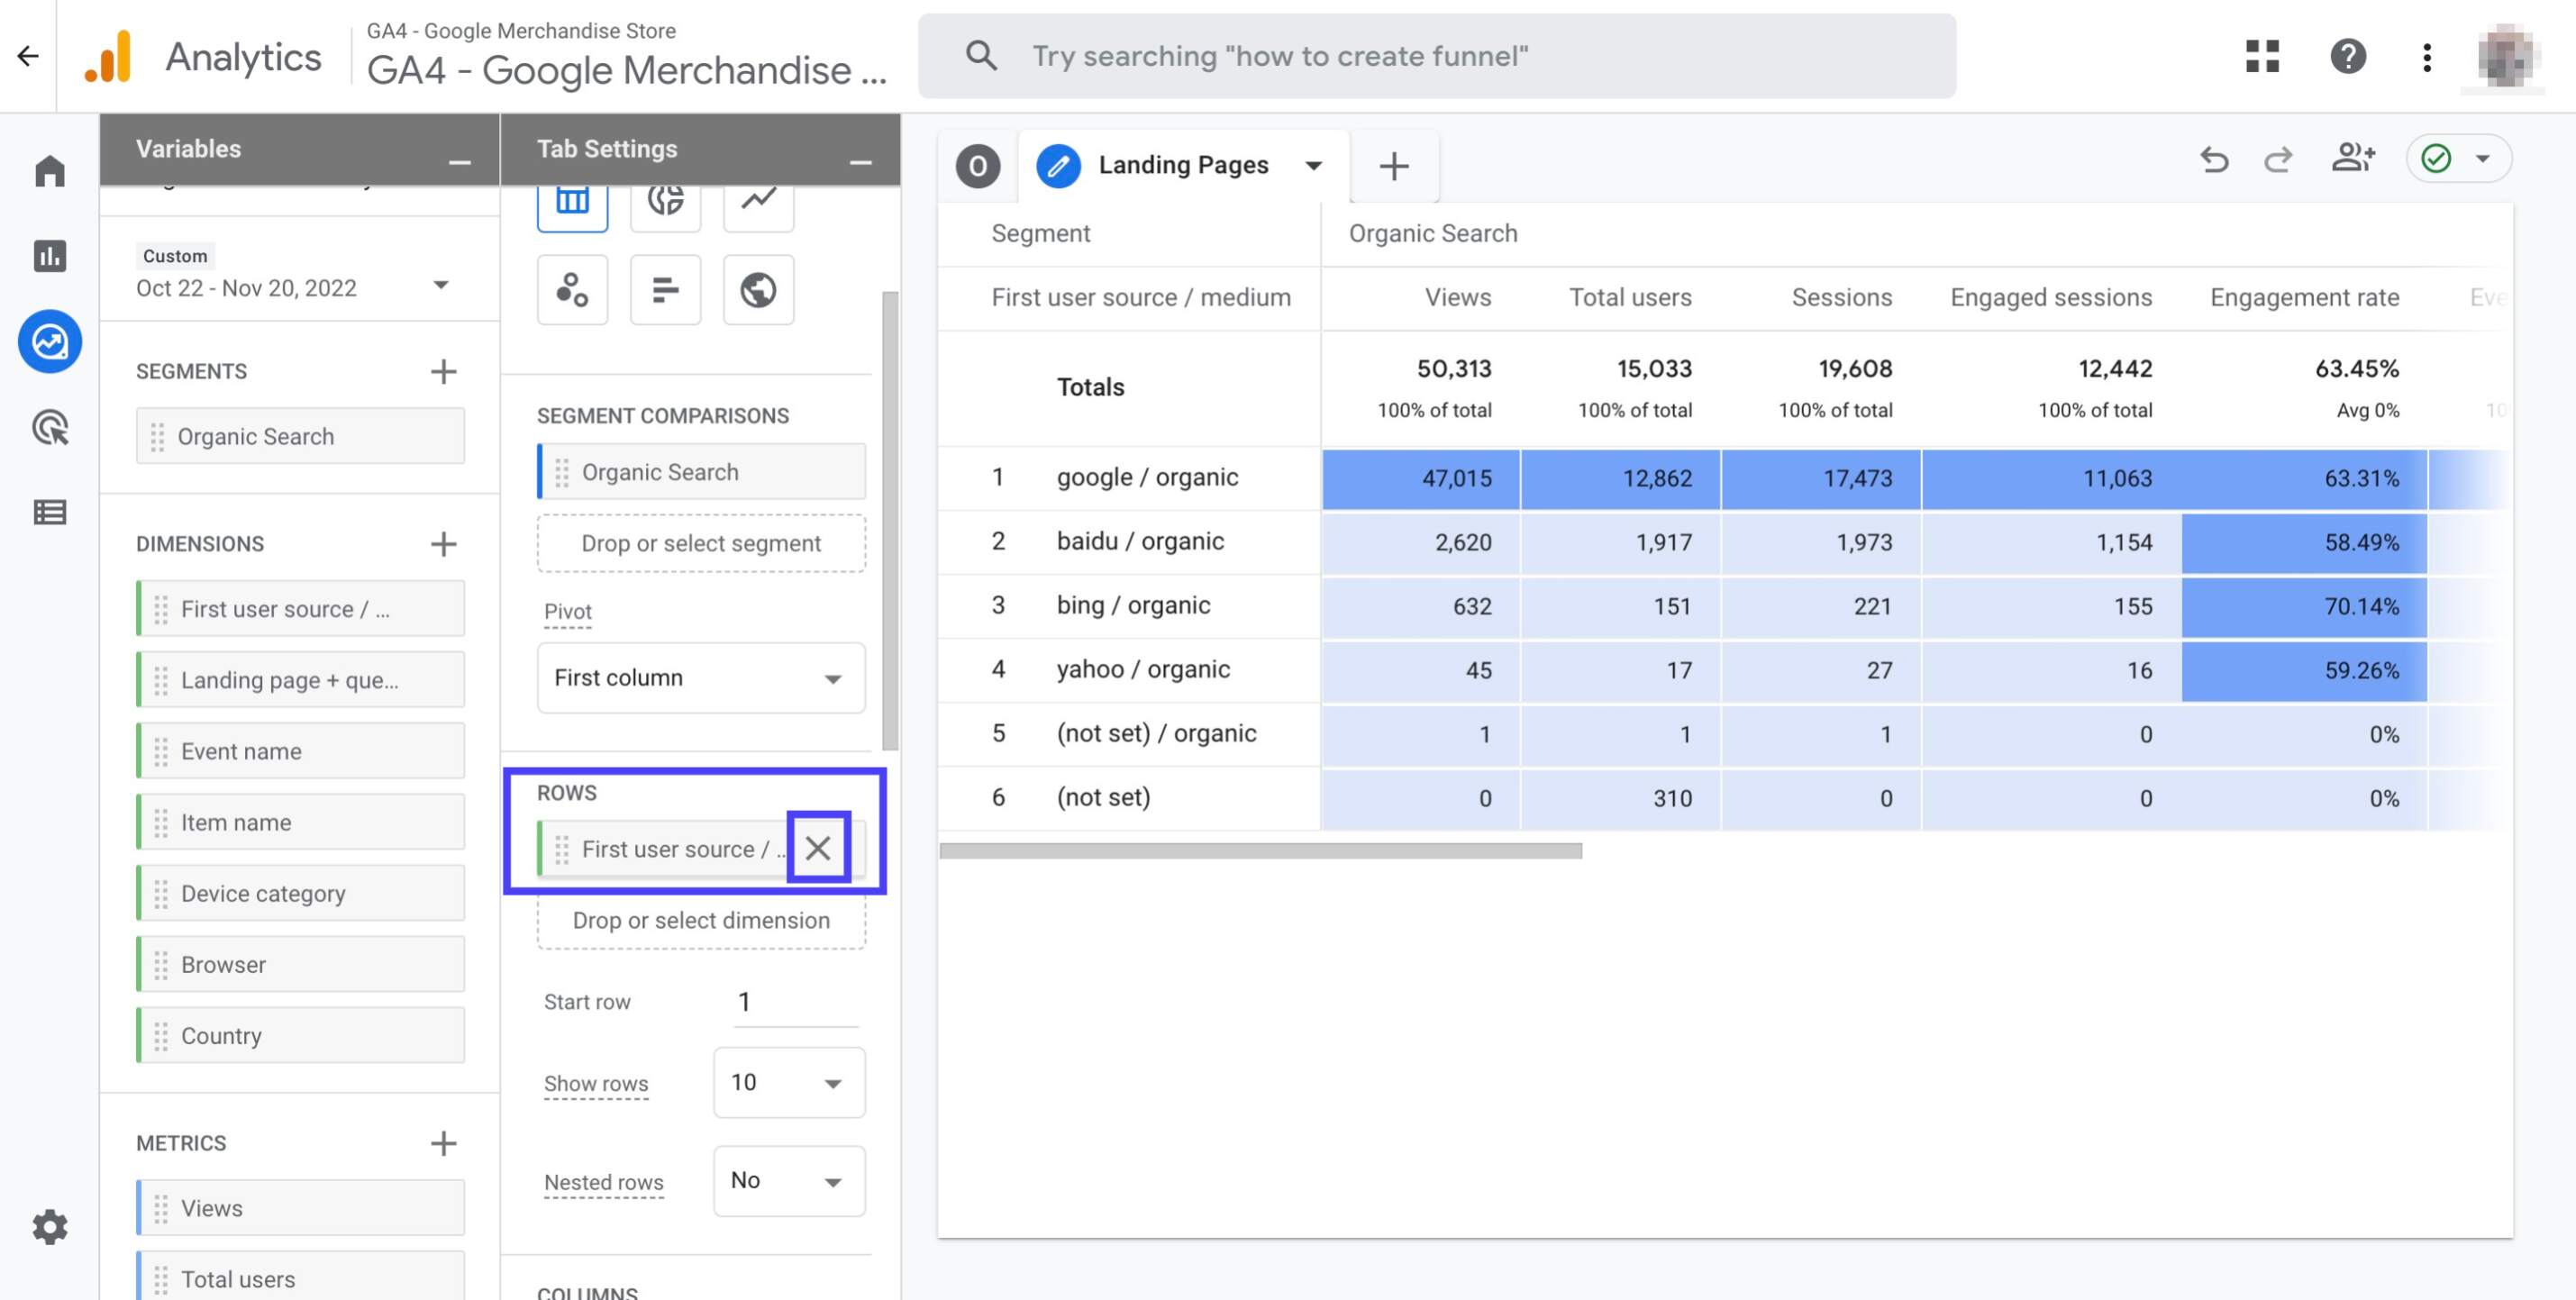
Click the cross sign next to the 'First user source / medium' dimension to remove it from the report
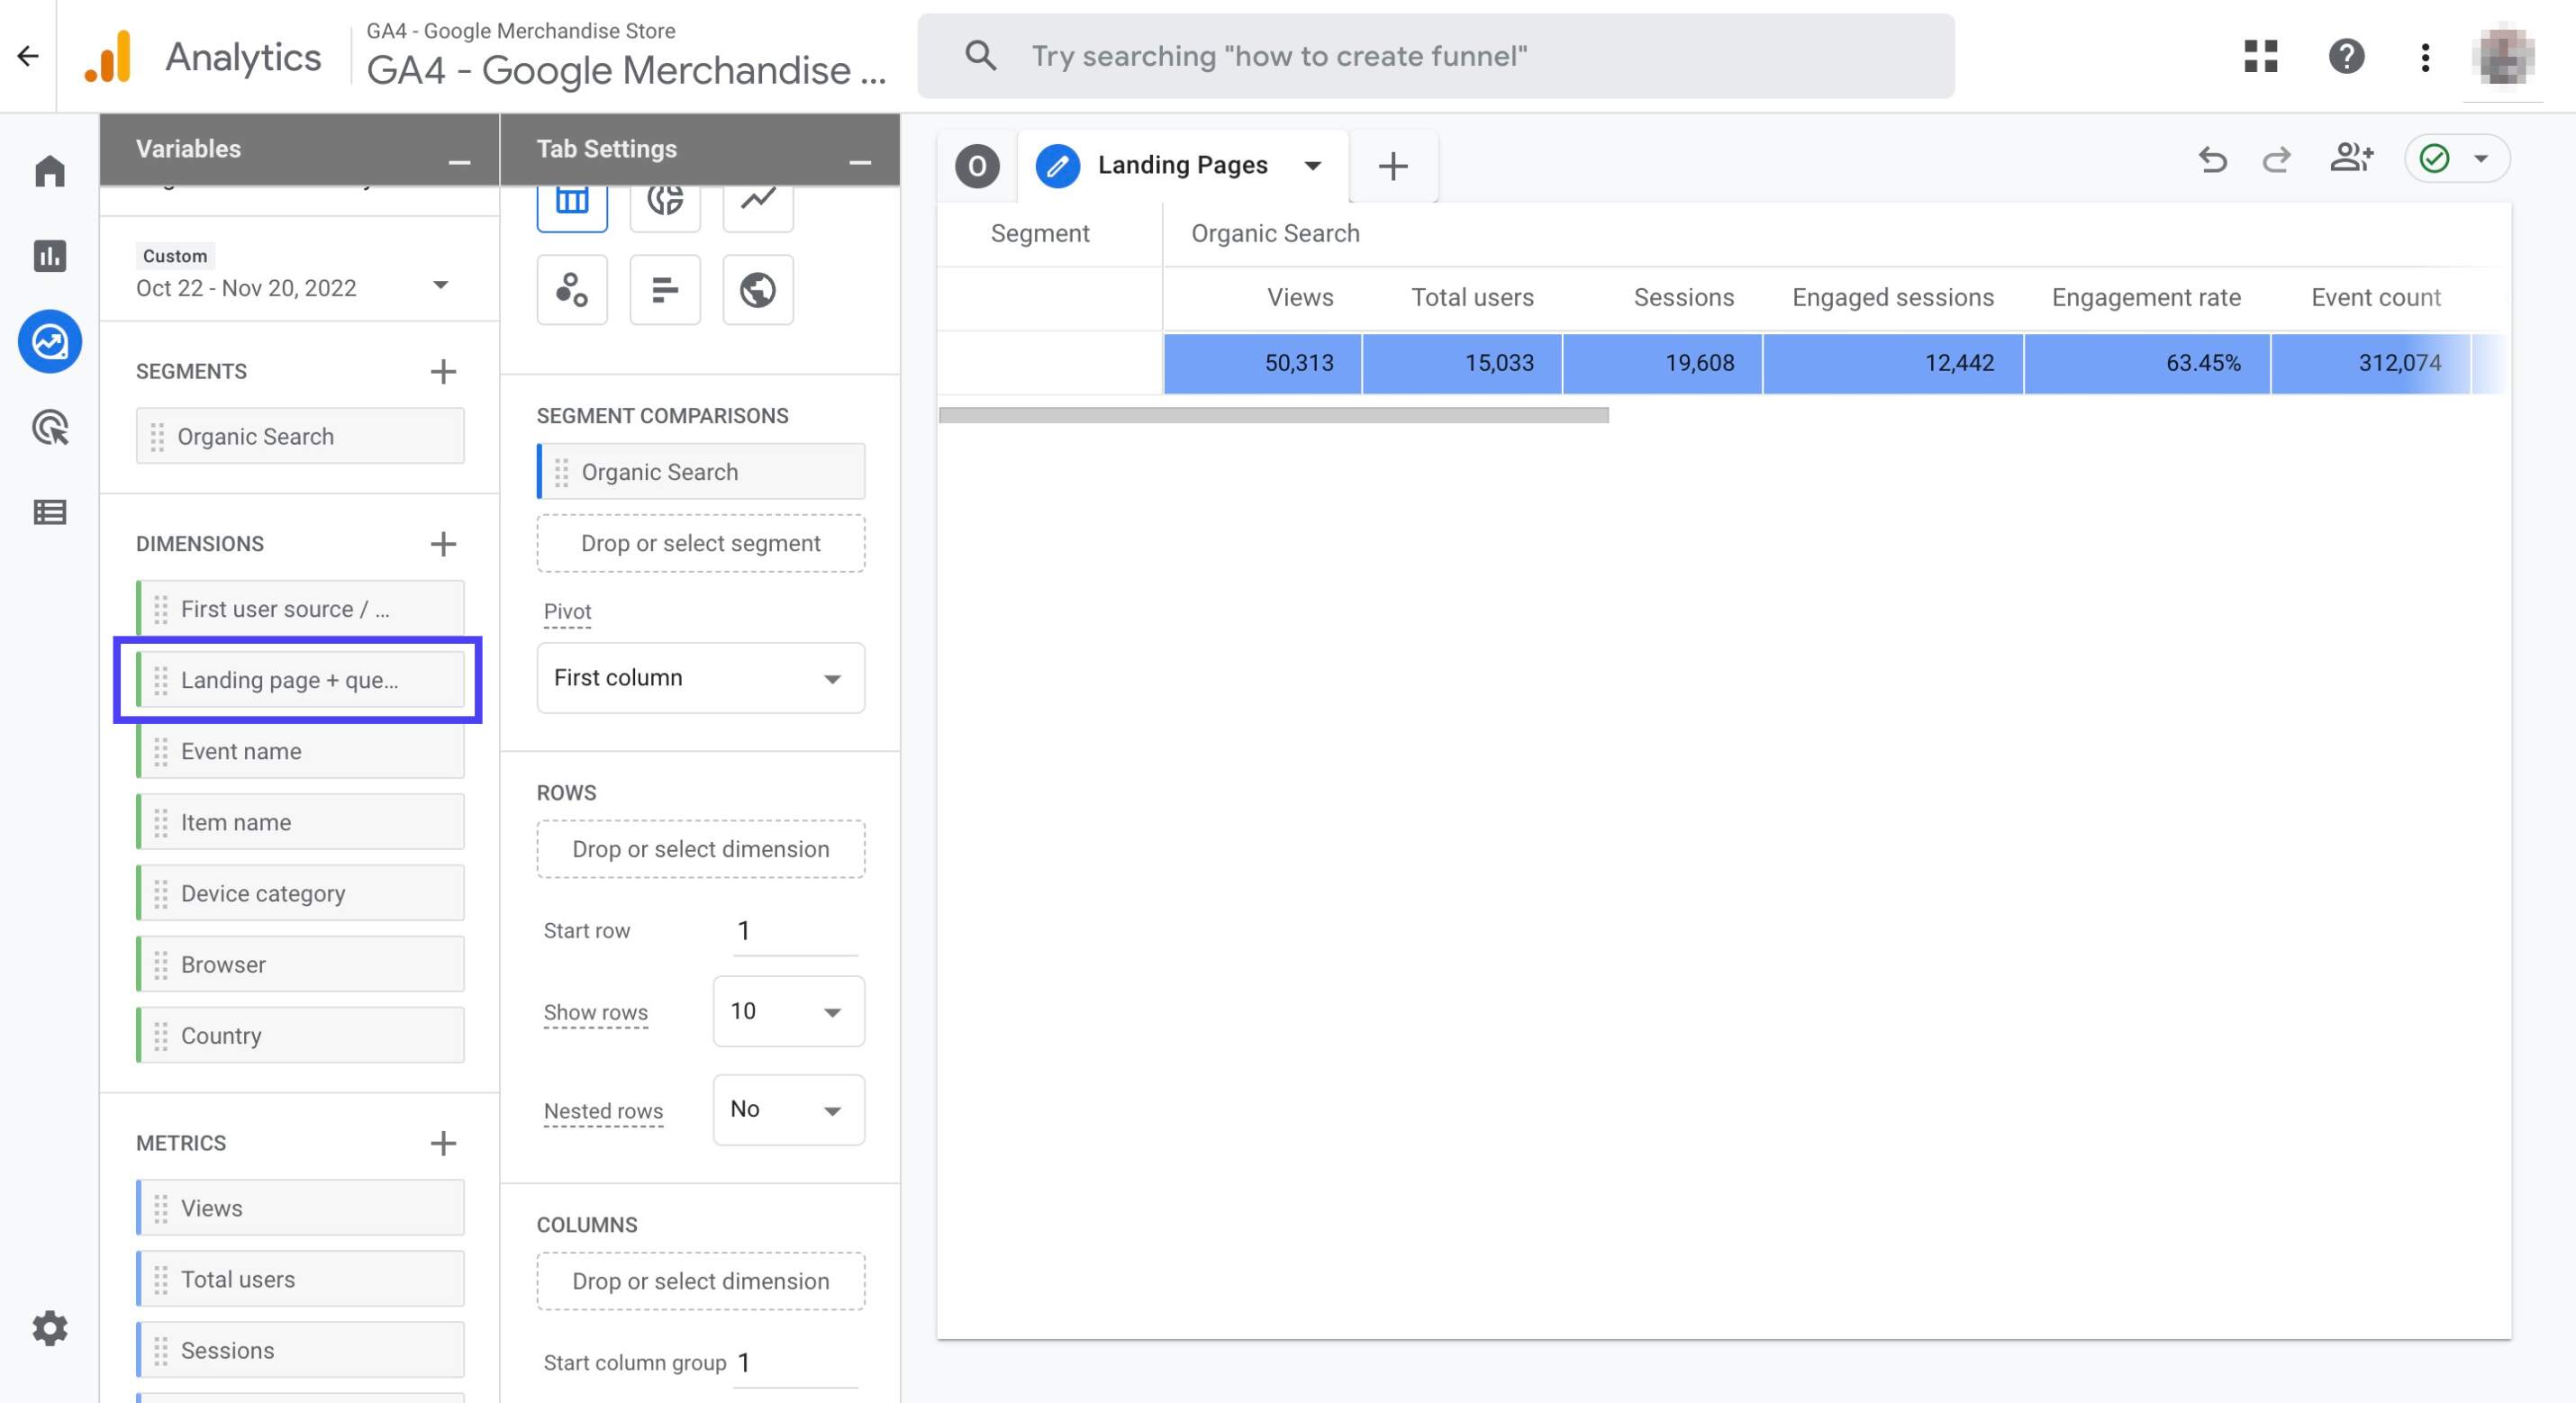
Double click the 'Landing Page + query string' dimension to add it to your report on the right
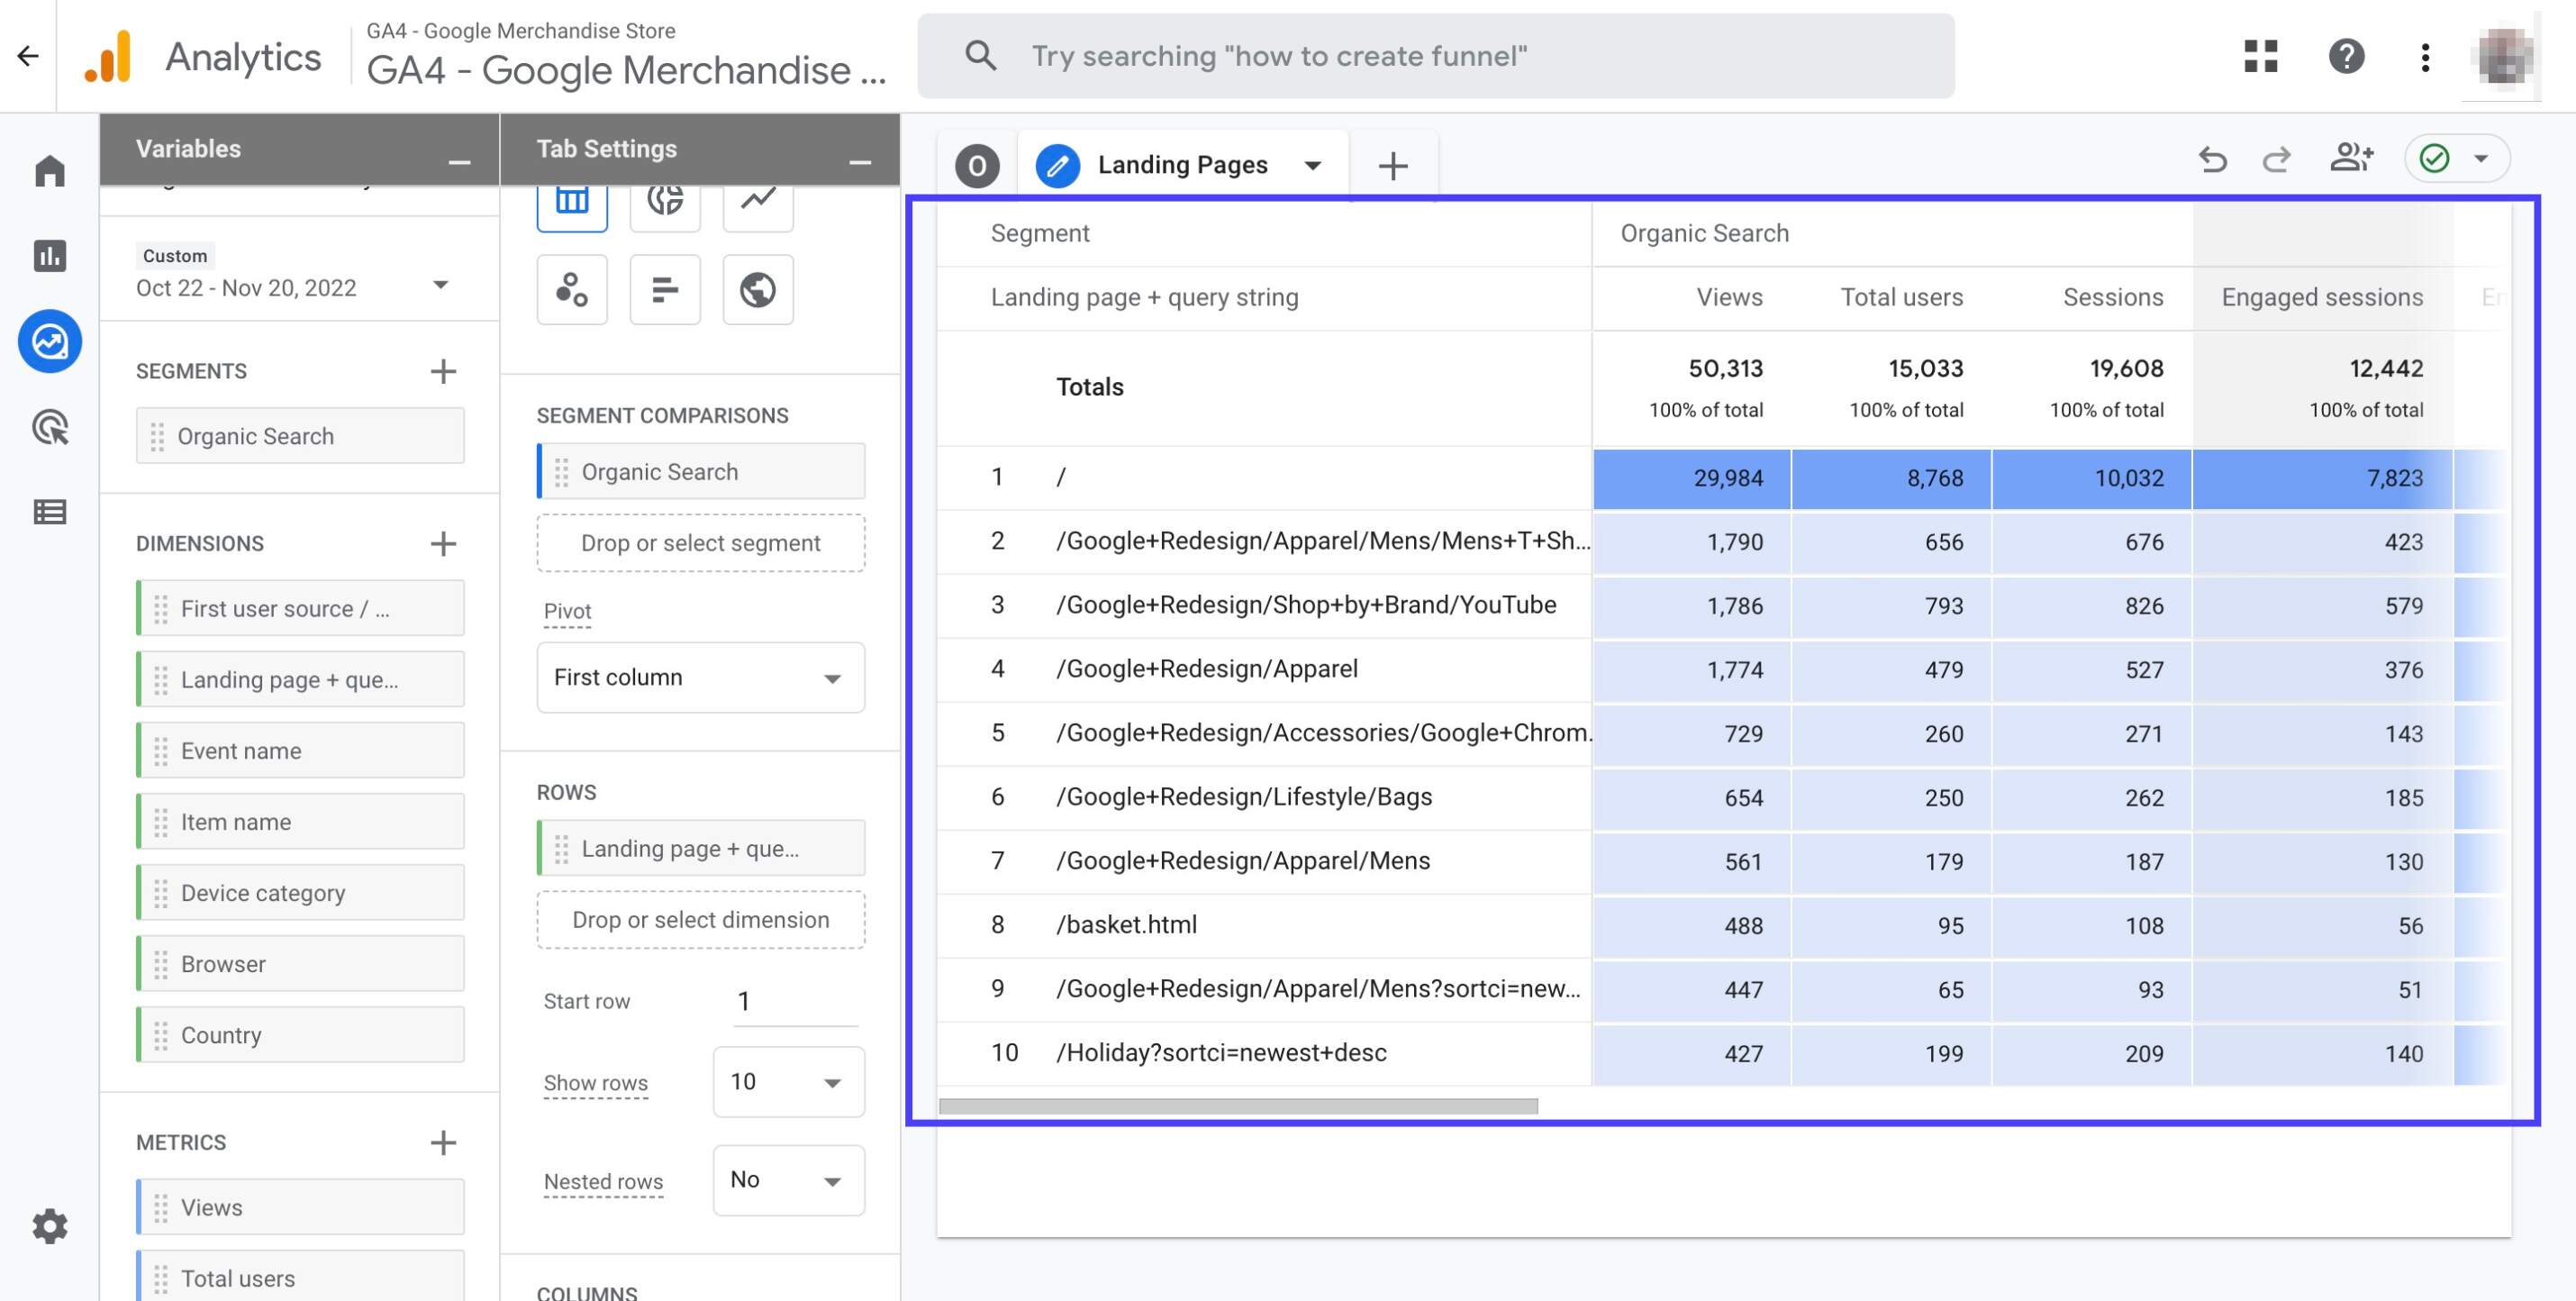
Now, your report should look like the graphic seen below
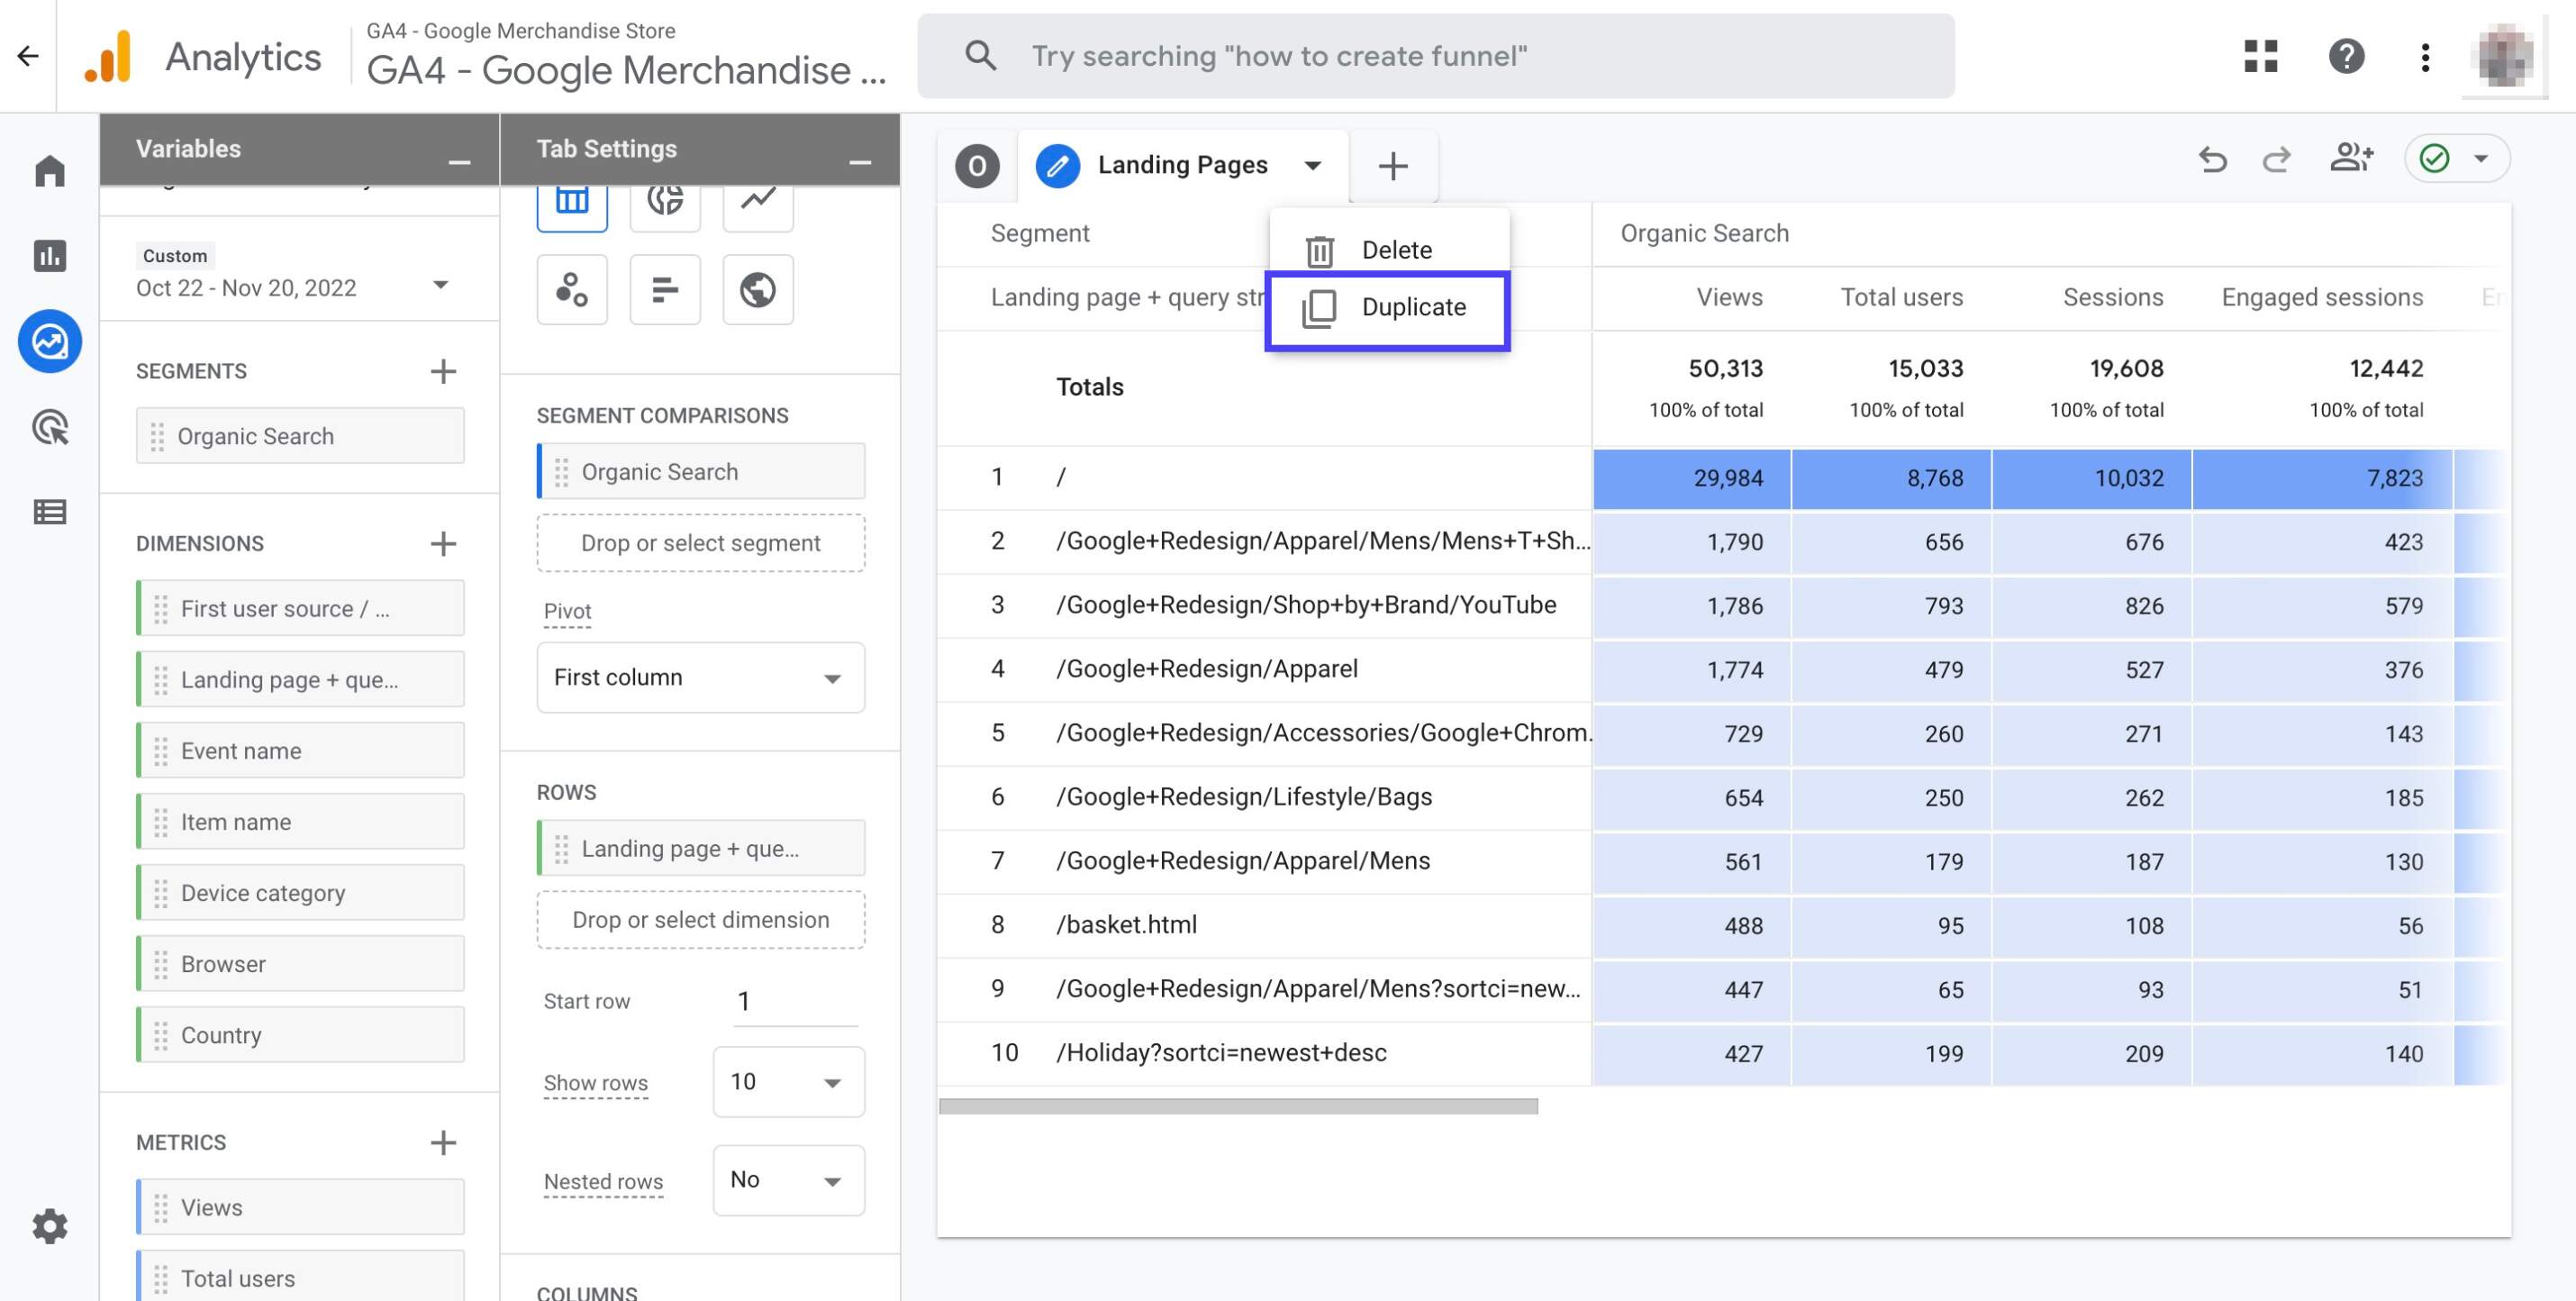
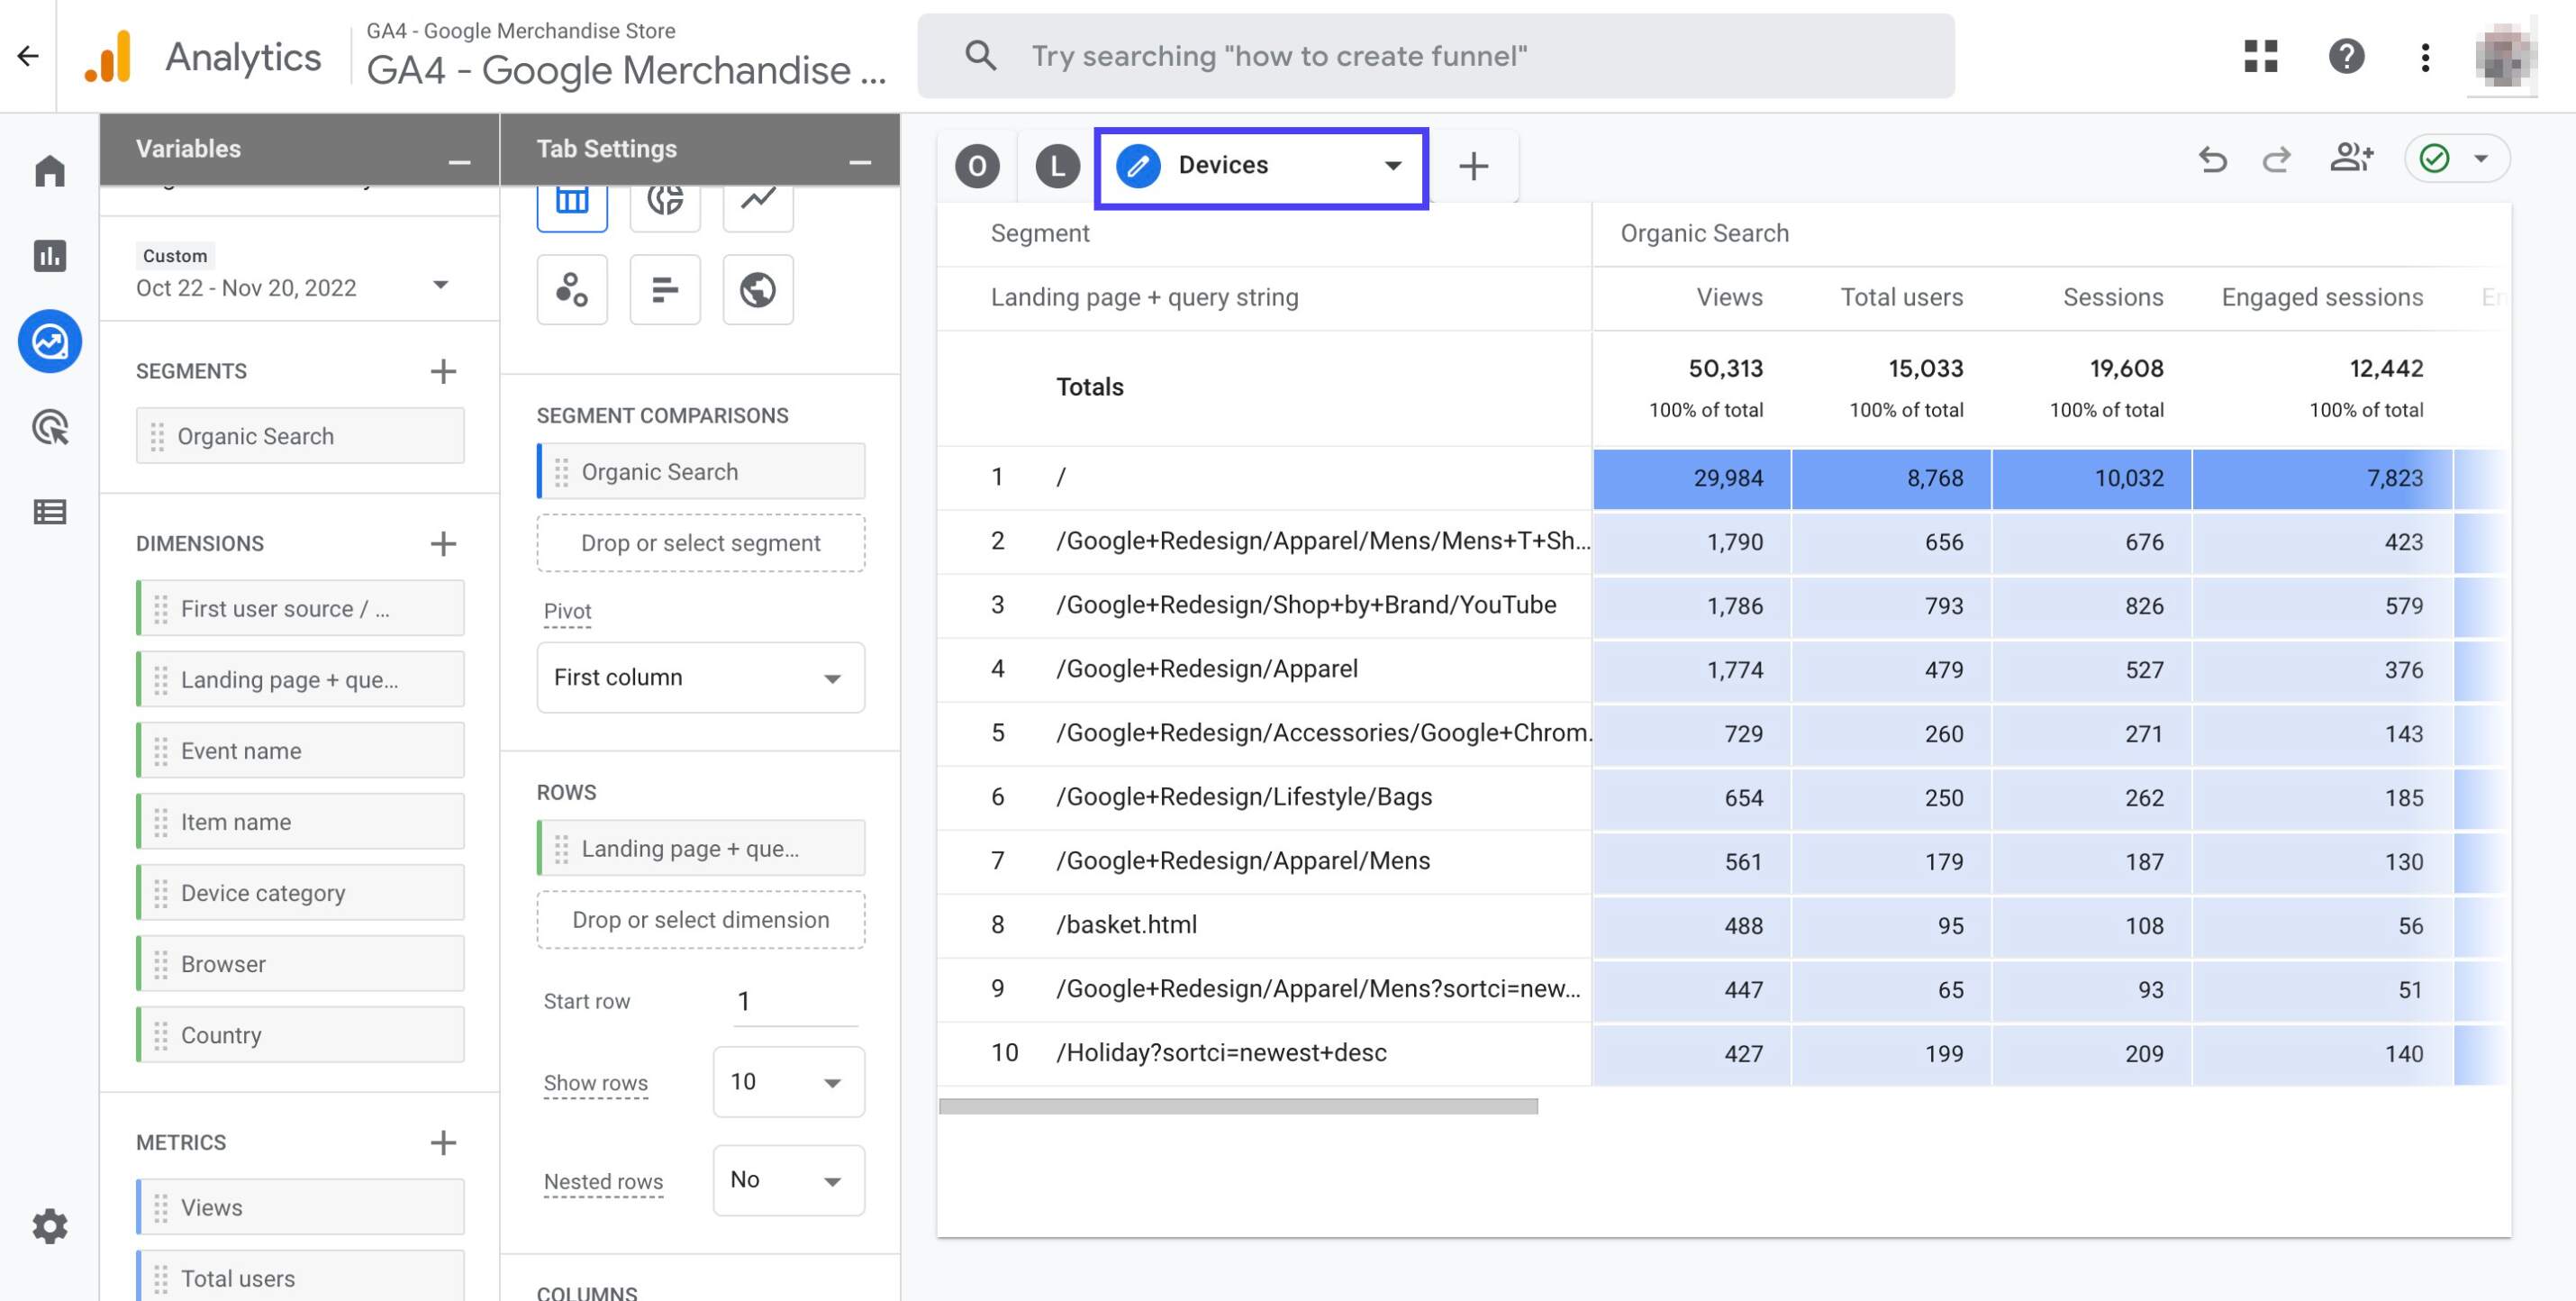
Click on the little arrow sign right next to 'Landing Pages'. Then, click 'Duplicate'
Name the new tab as 'Devices'
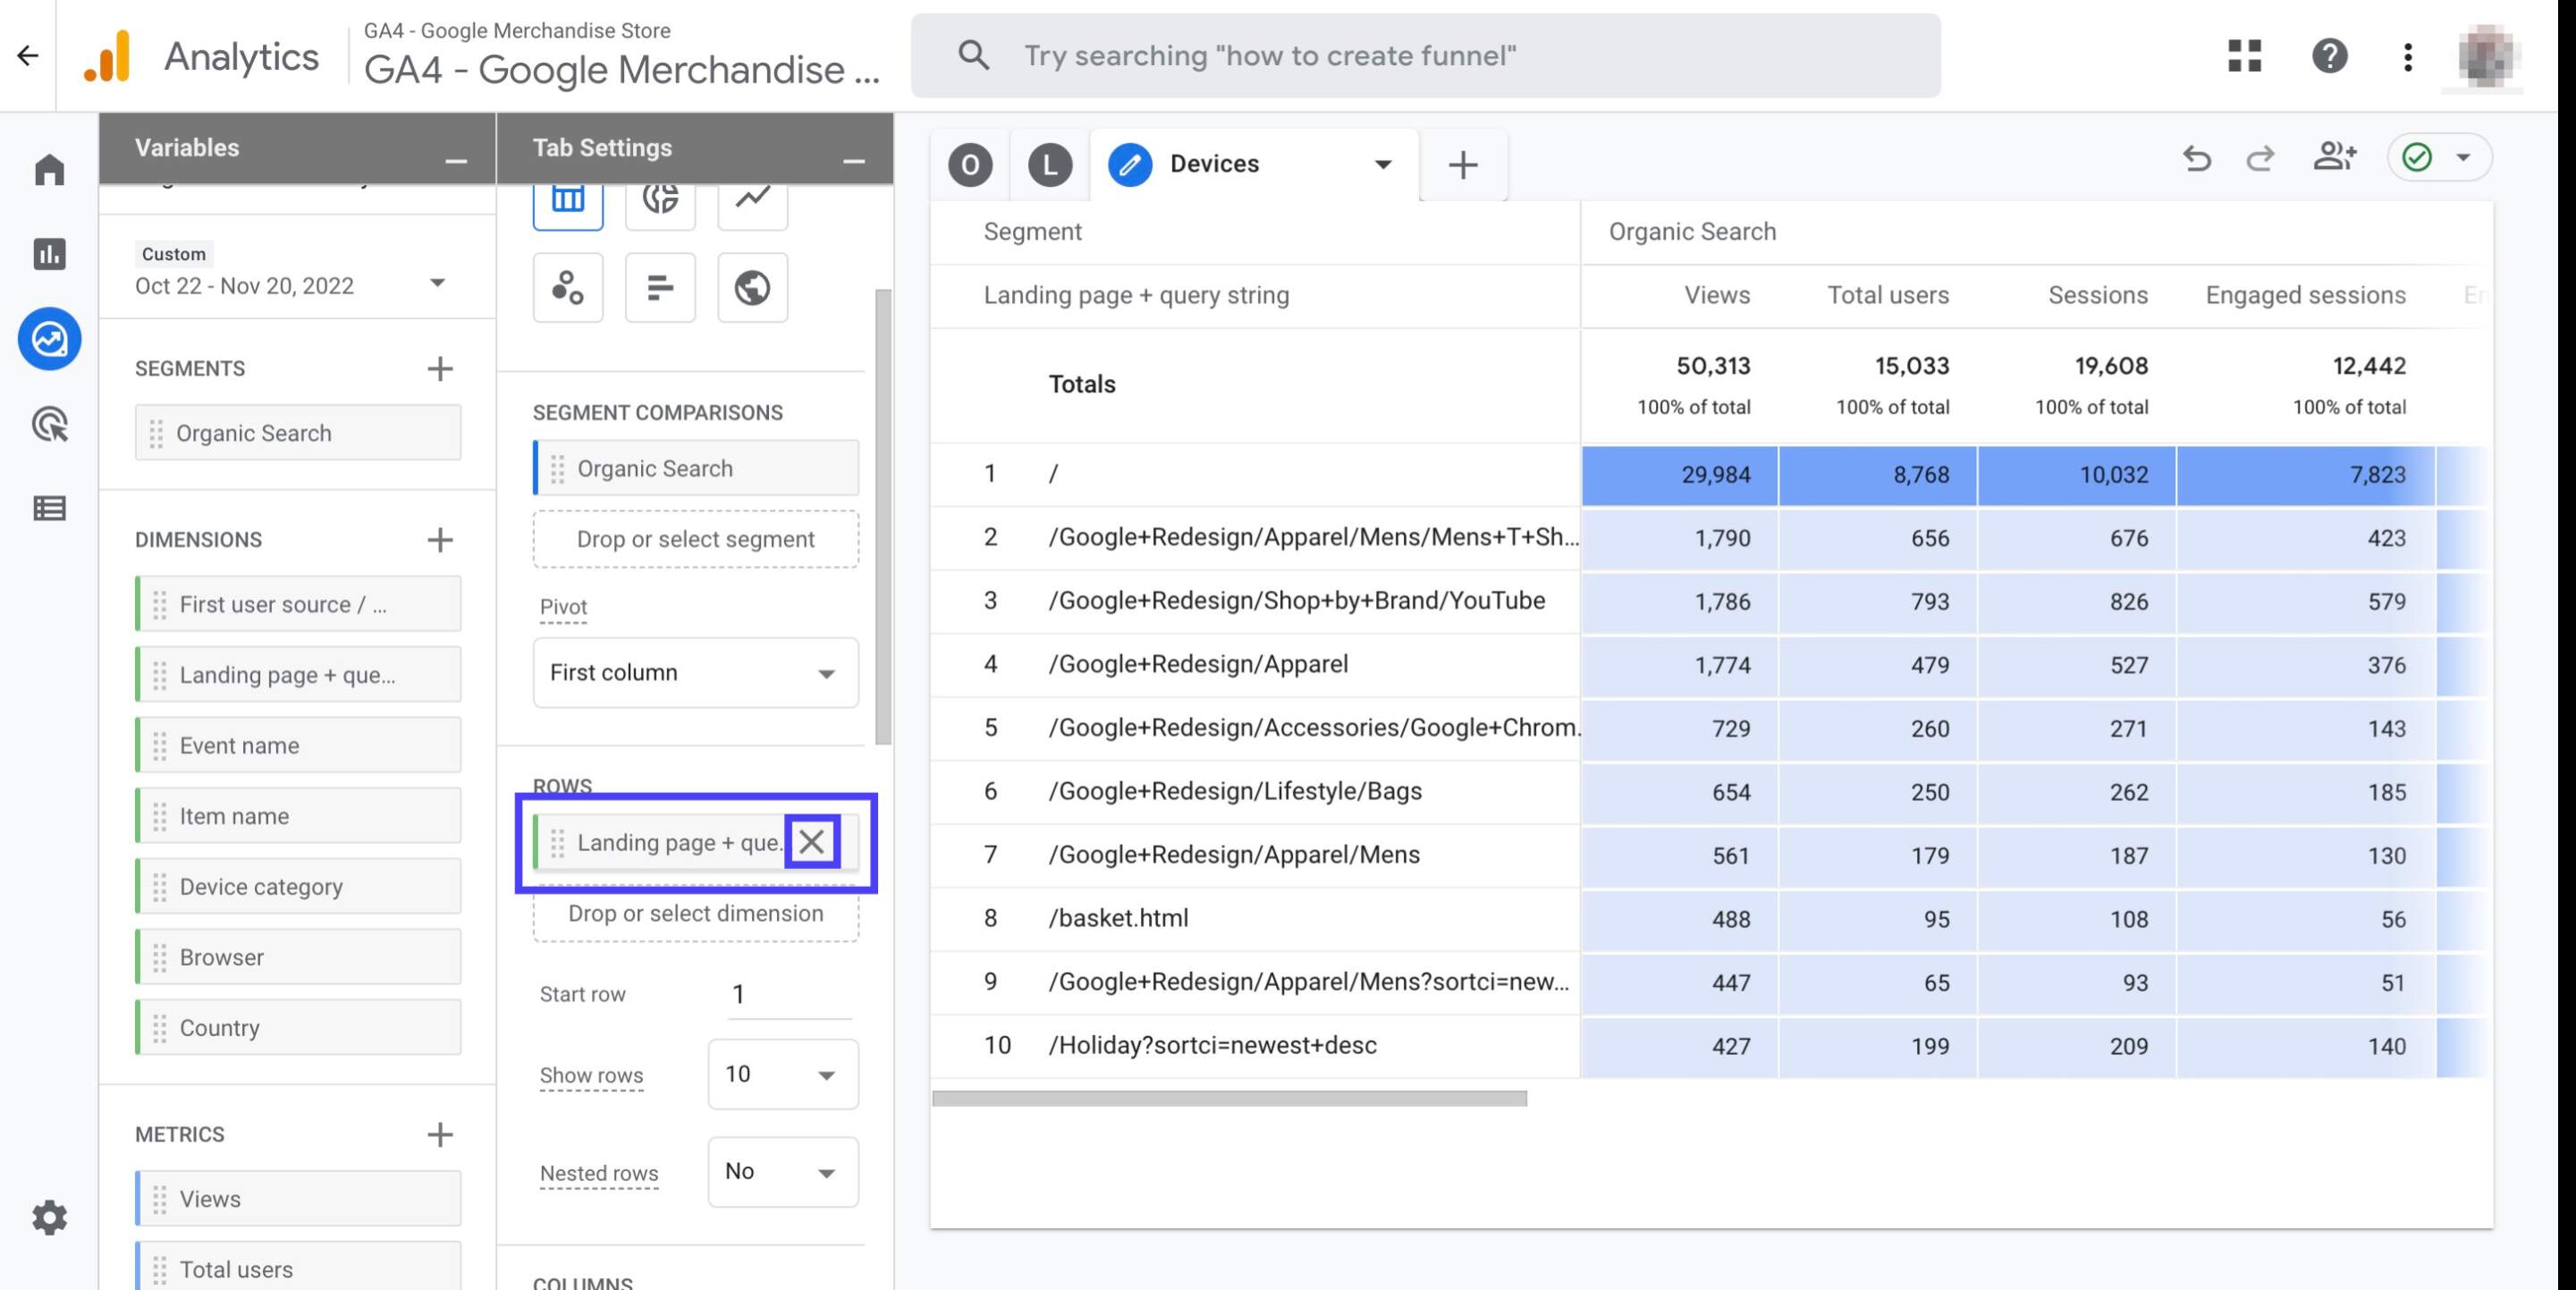
Click the cross sign next to the 'Landing page + query string' dimension to remove it from the report
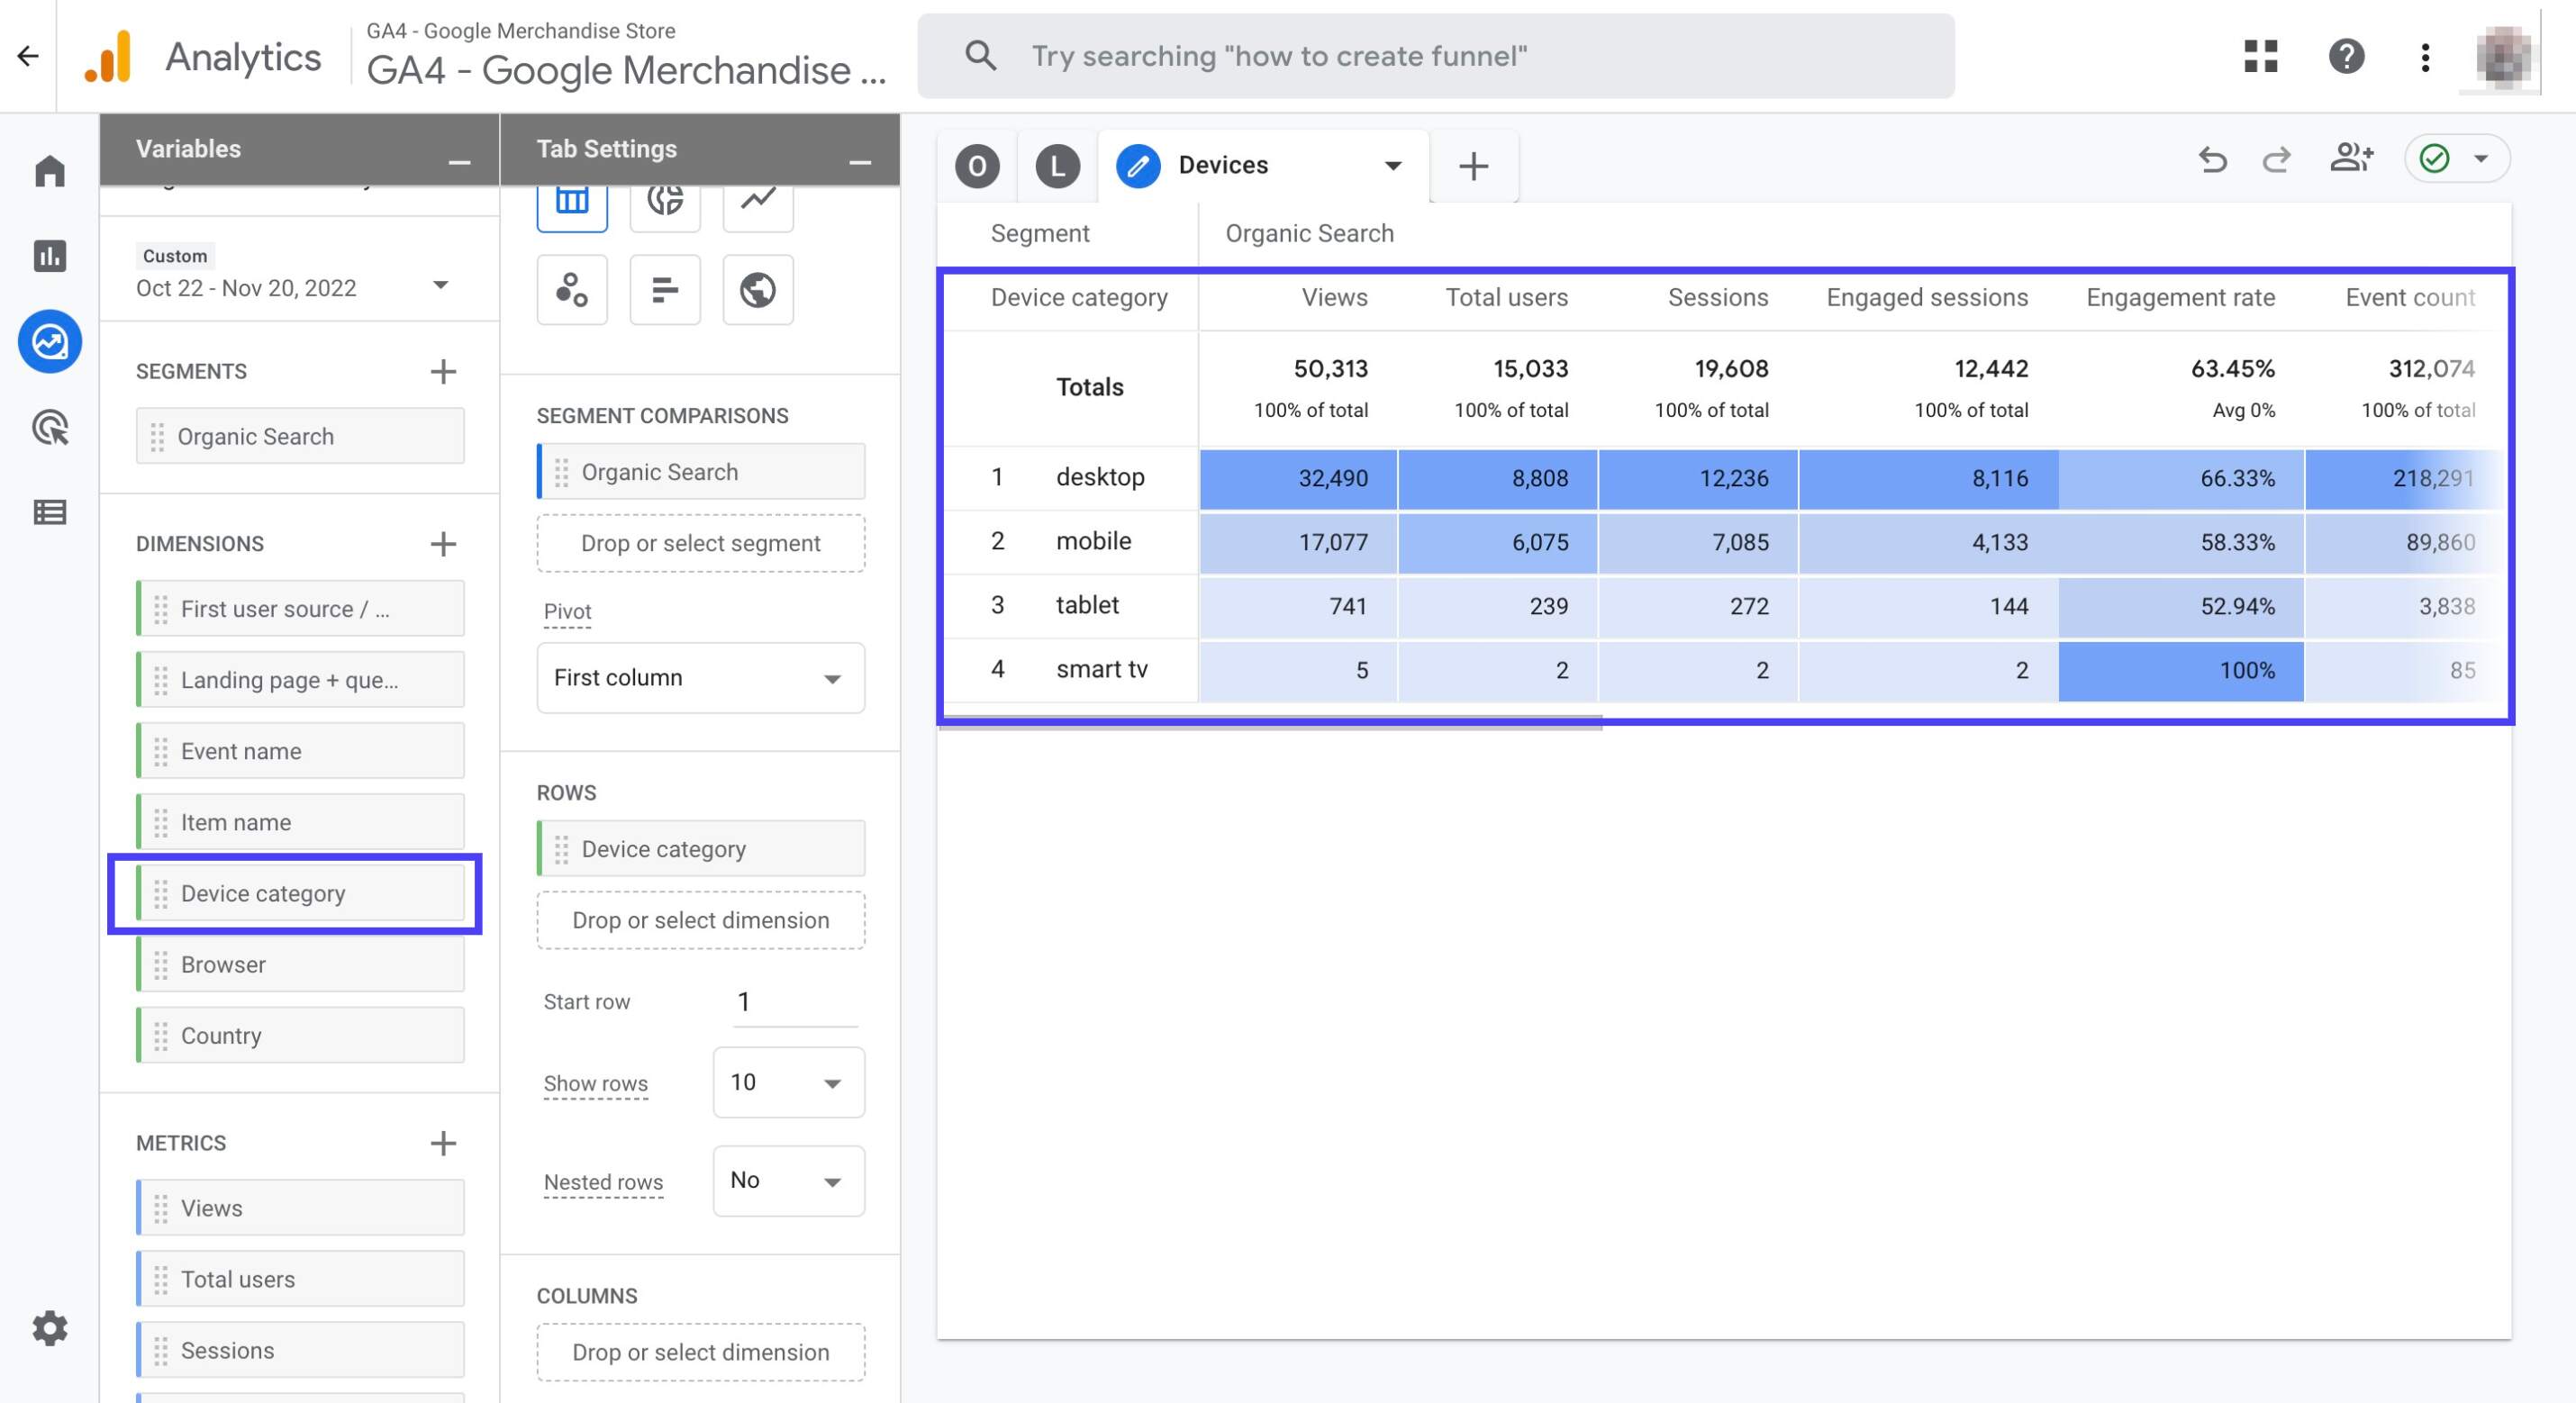
Double click the 'Device category' dimension to add it to your report
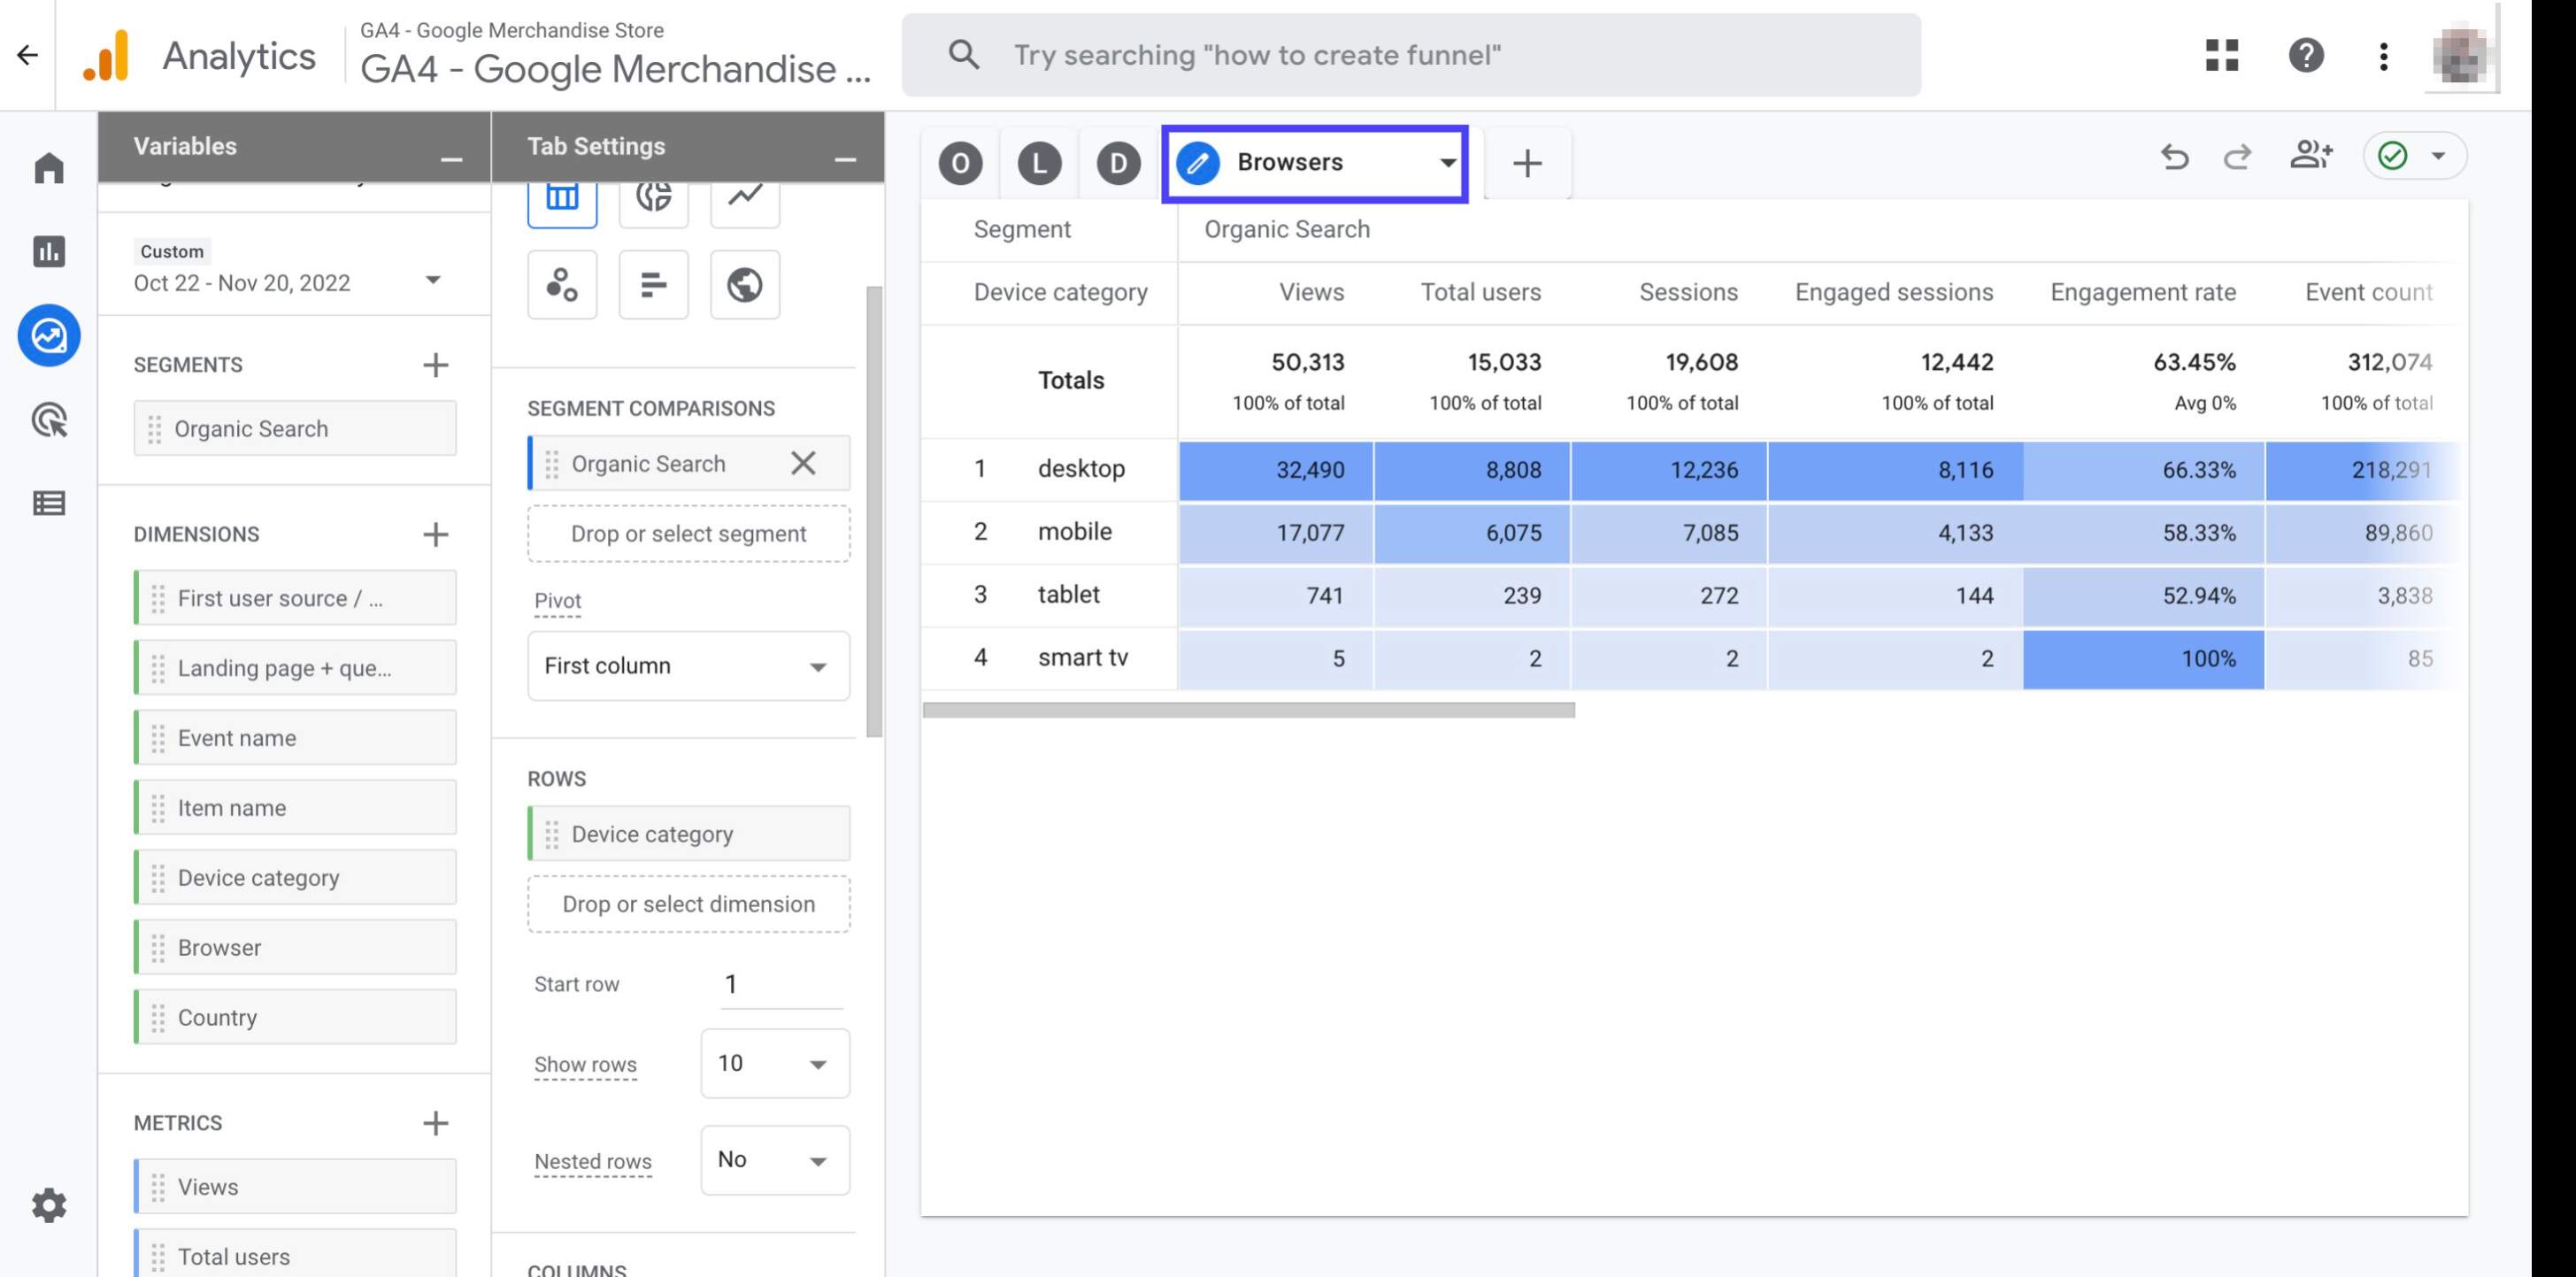
Click on the little arrow sign right next to 'Devices'. Then, click 'Duplicate'
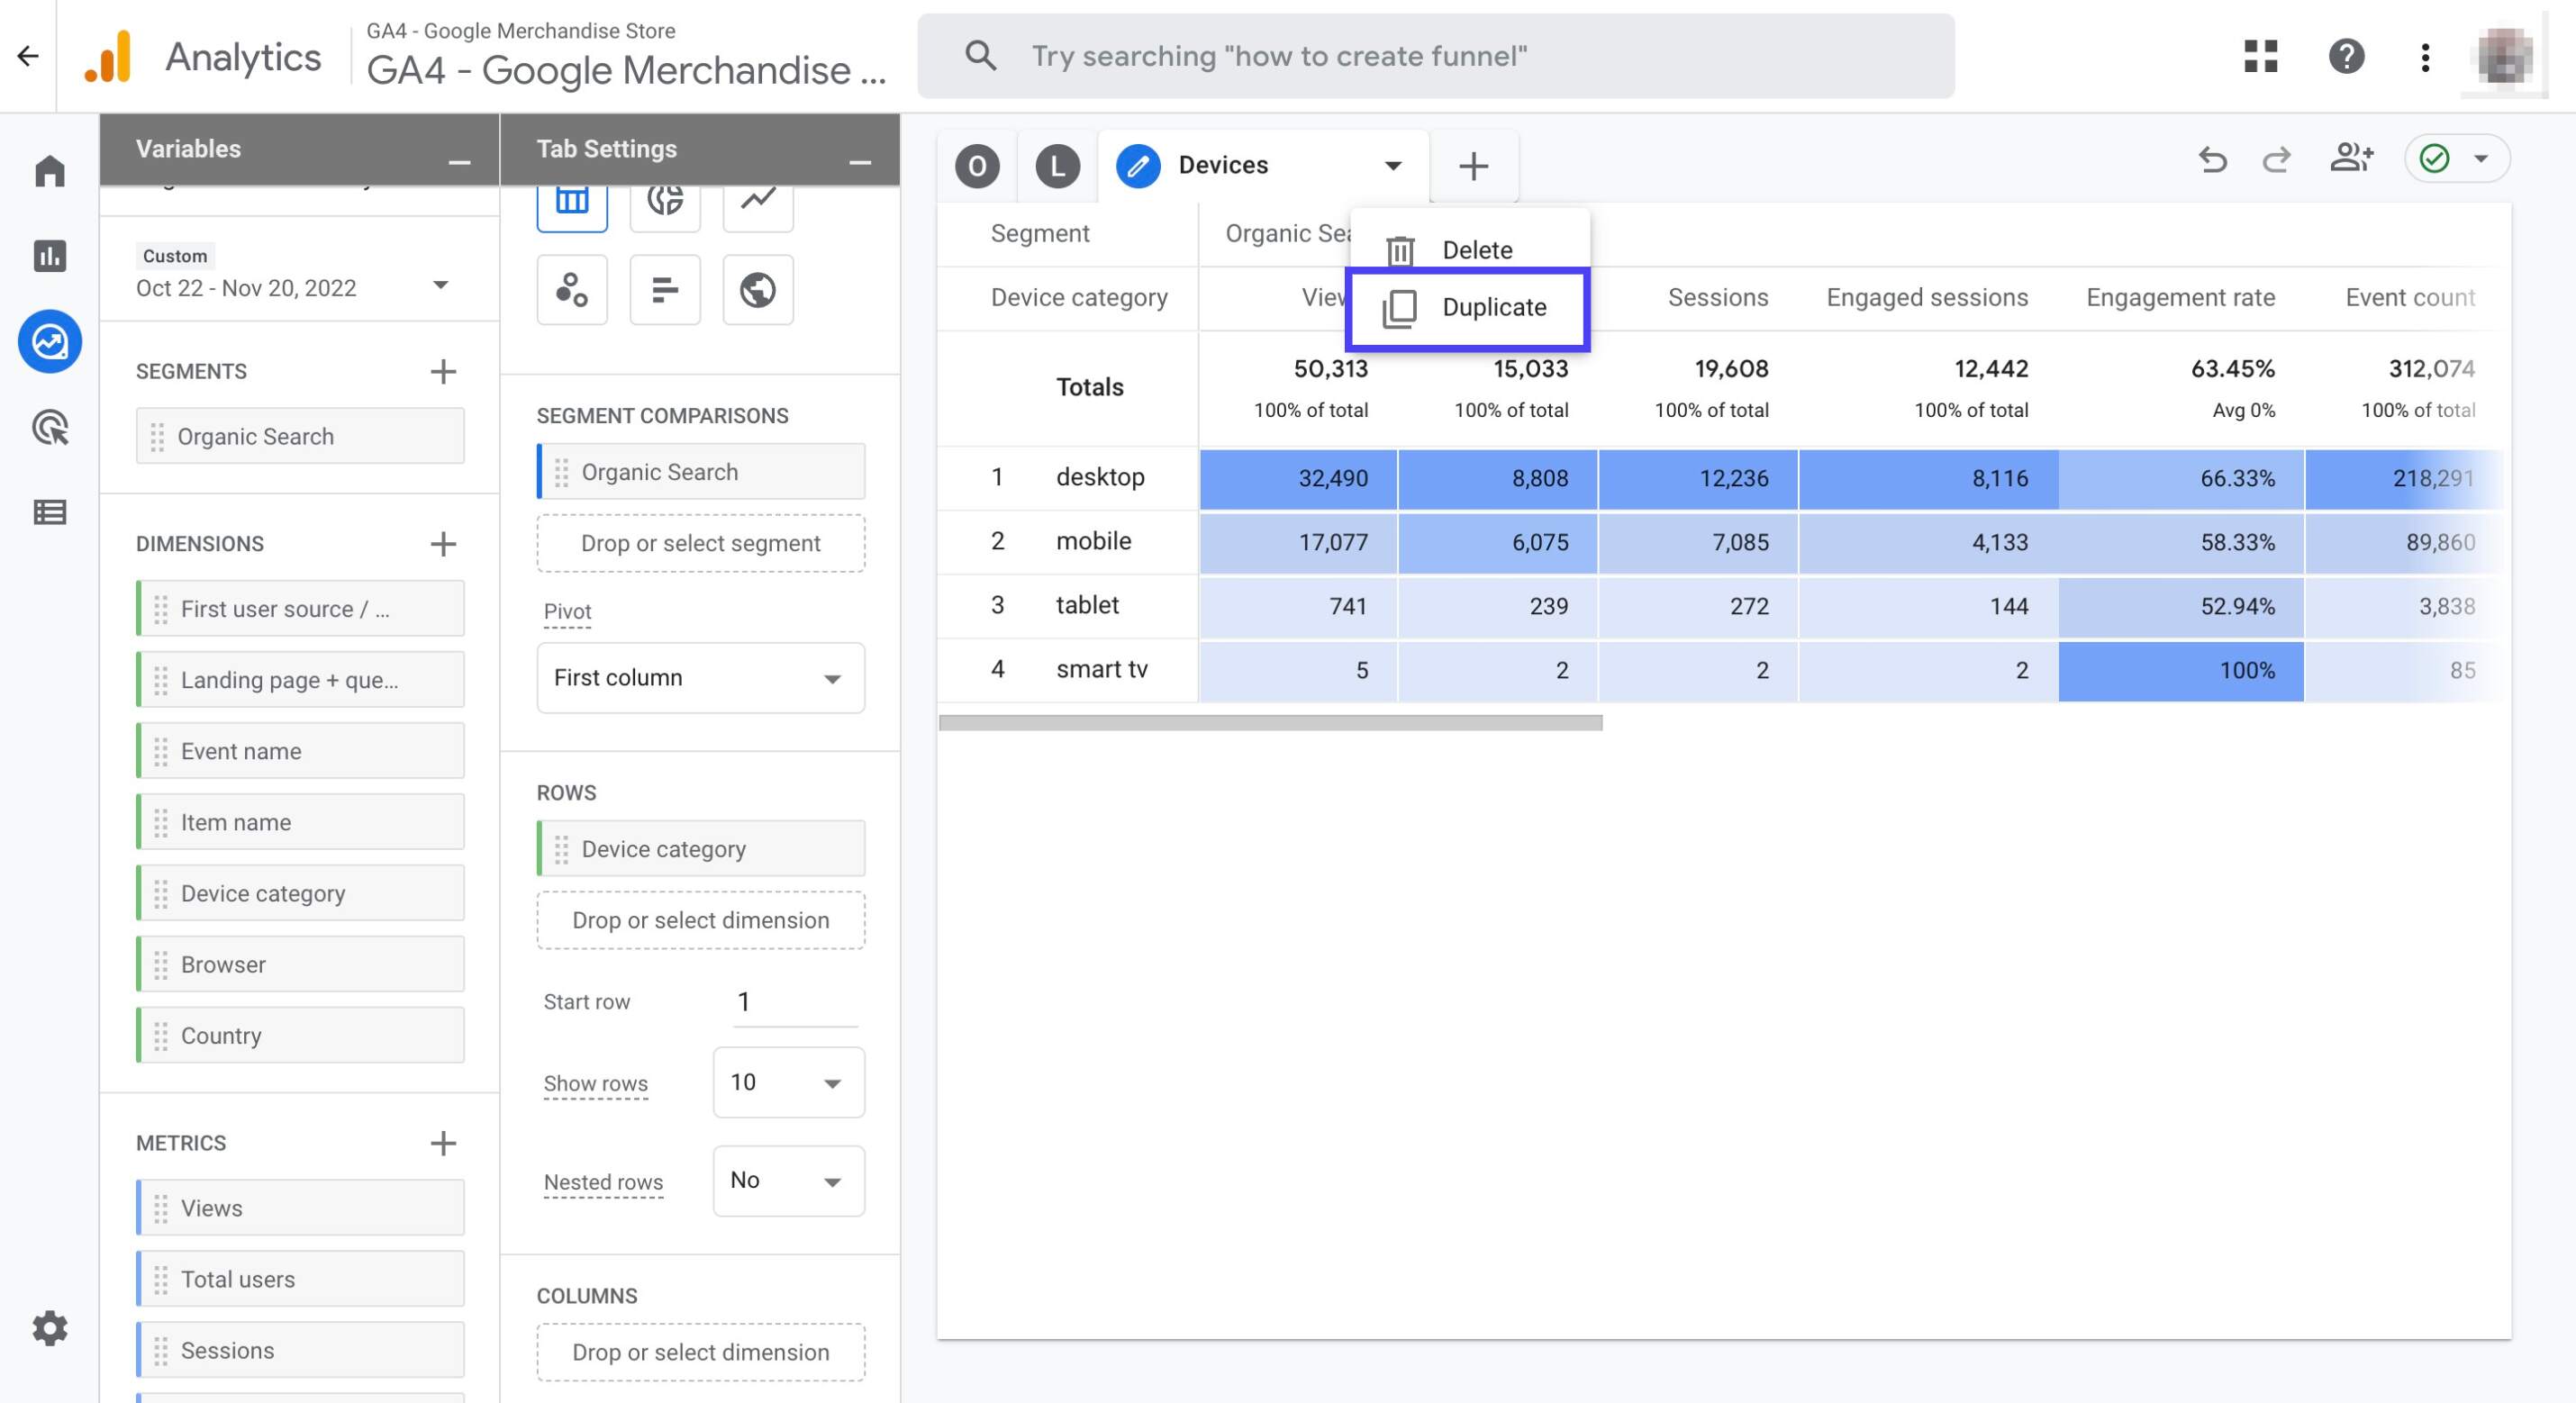
Name the new tab as 'Browsers'
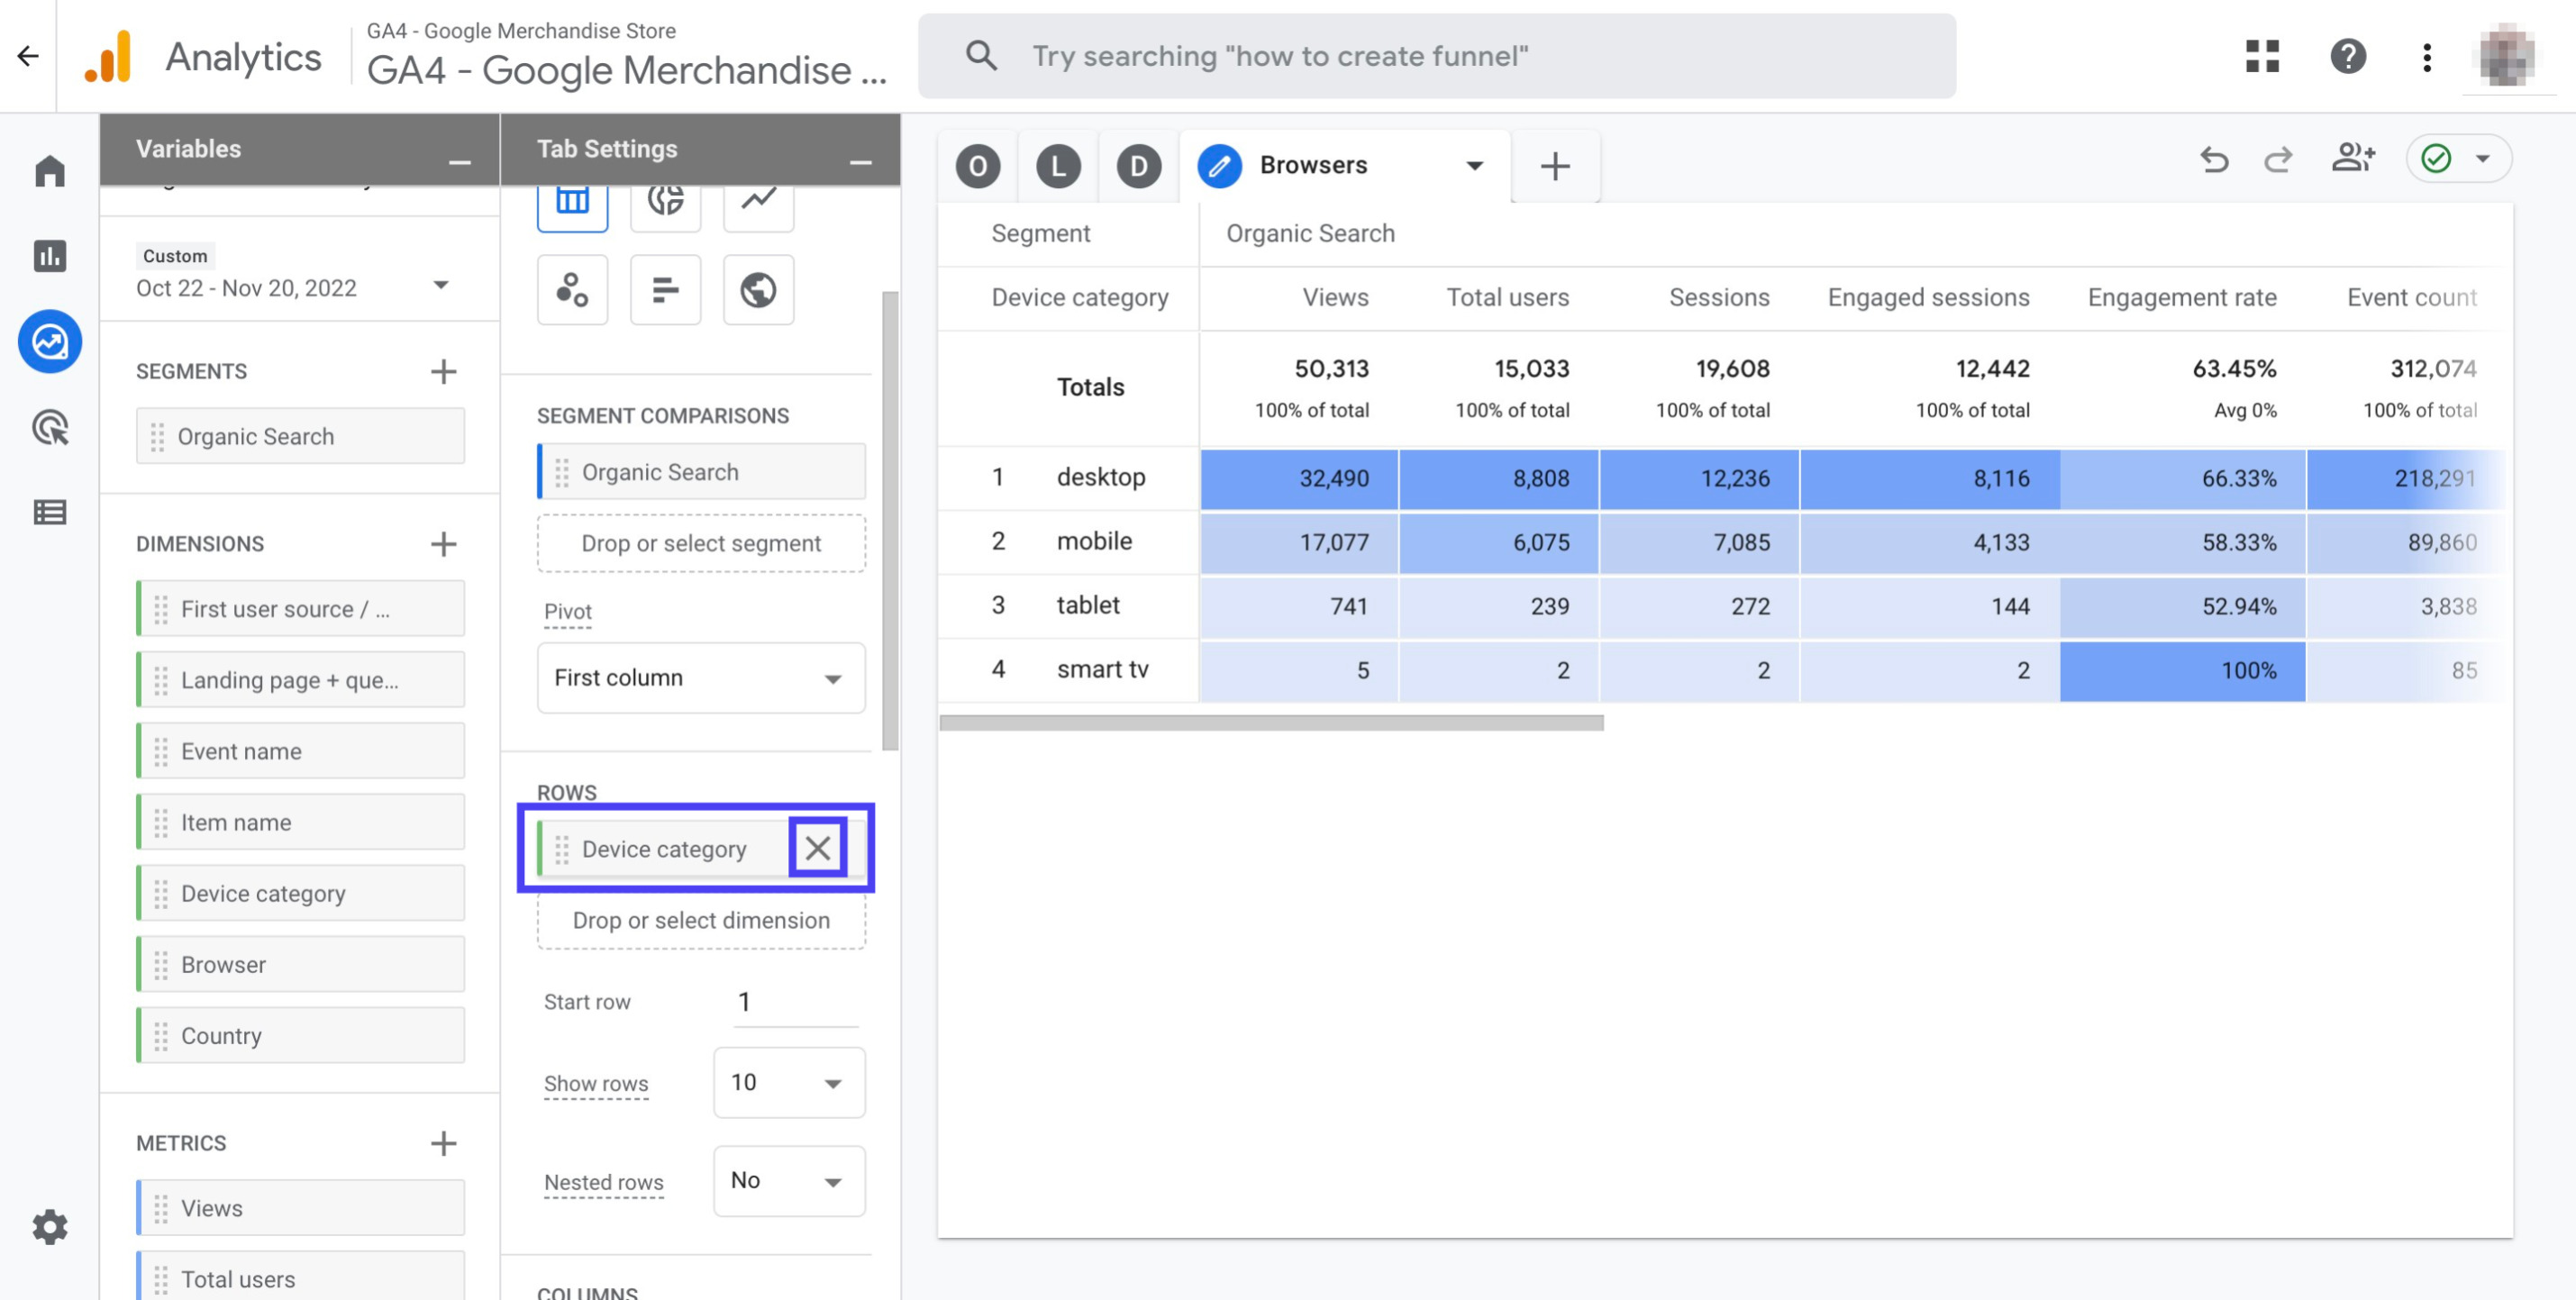
Click the cross sign next to the 'Device category' dimension to remove it from the report
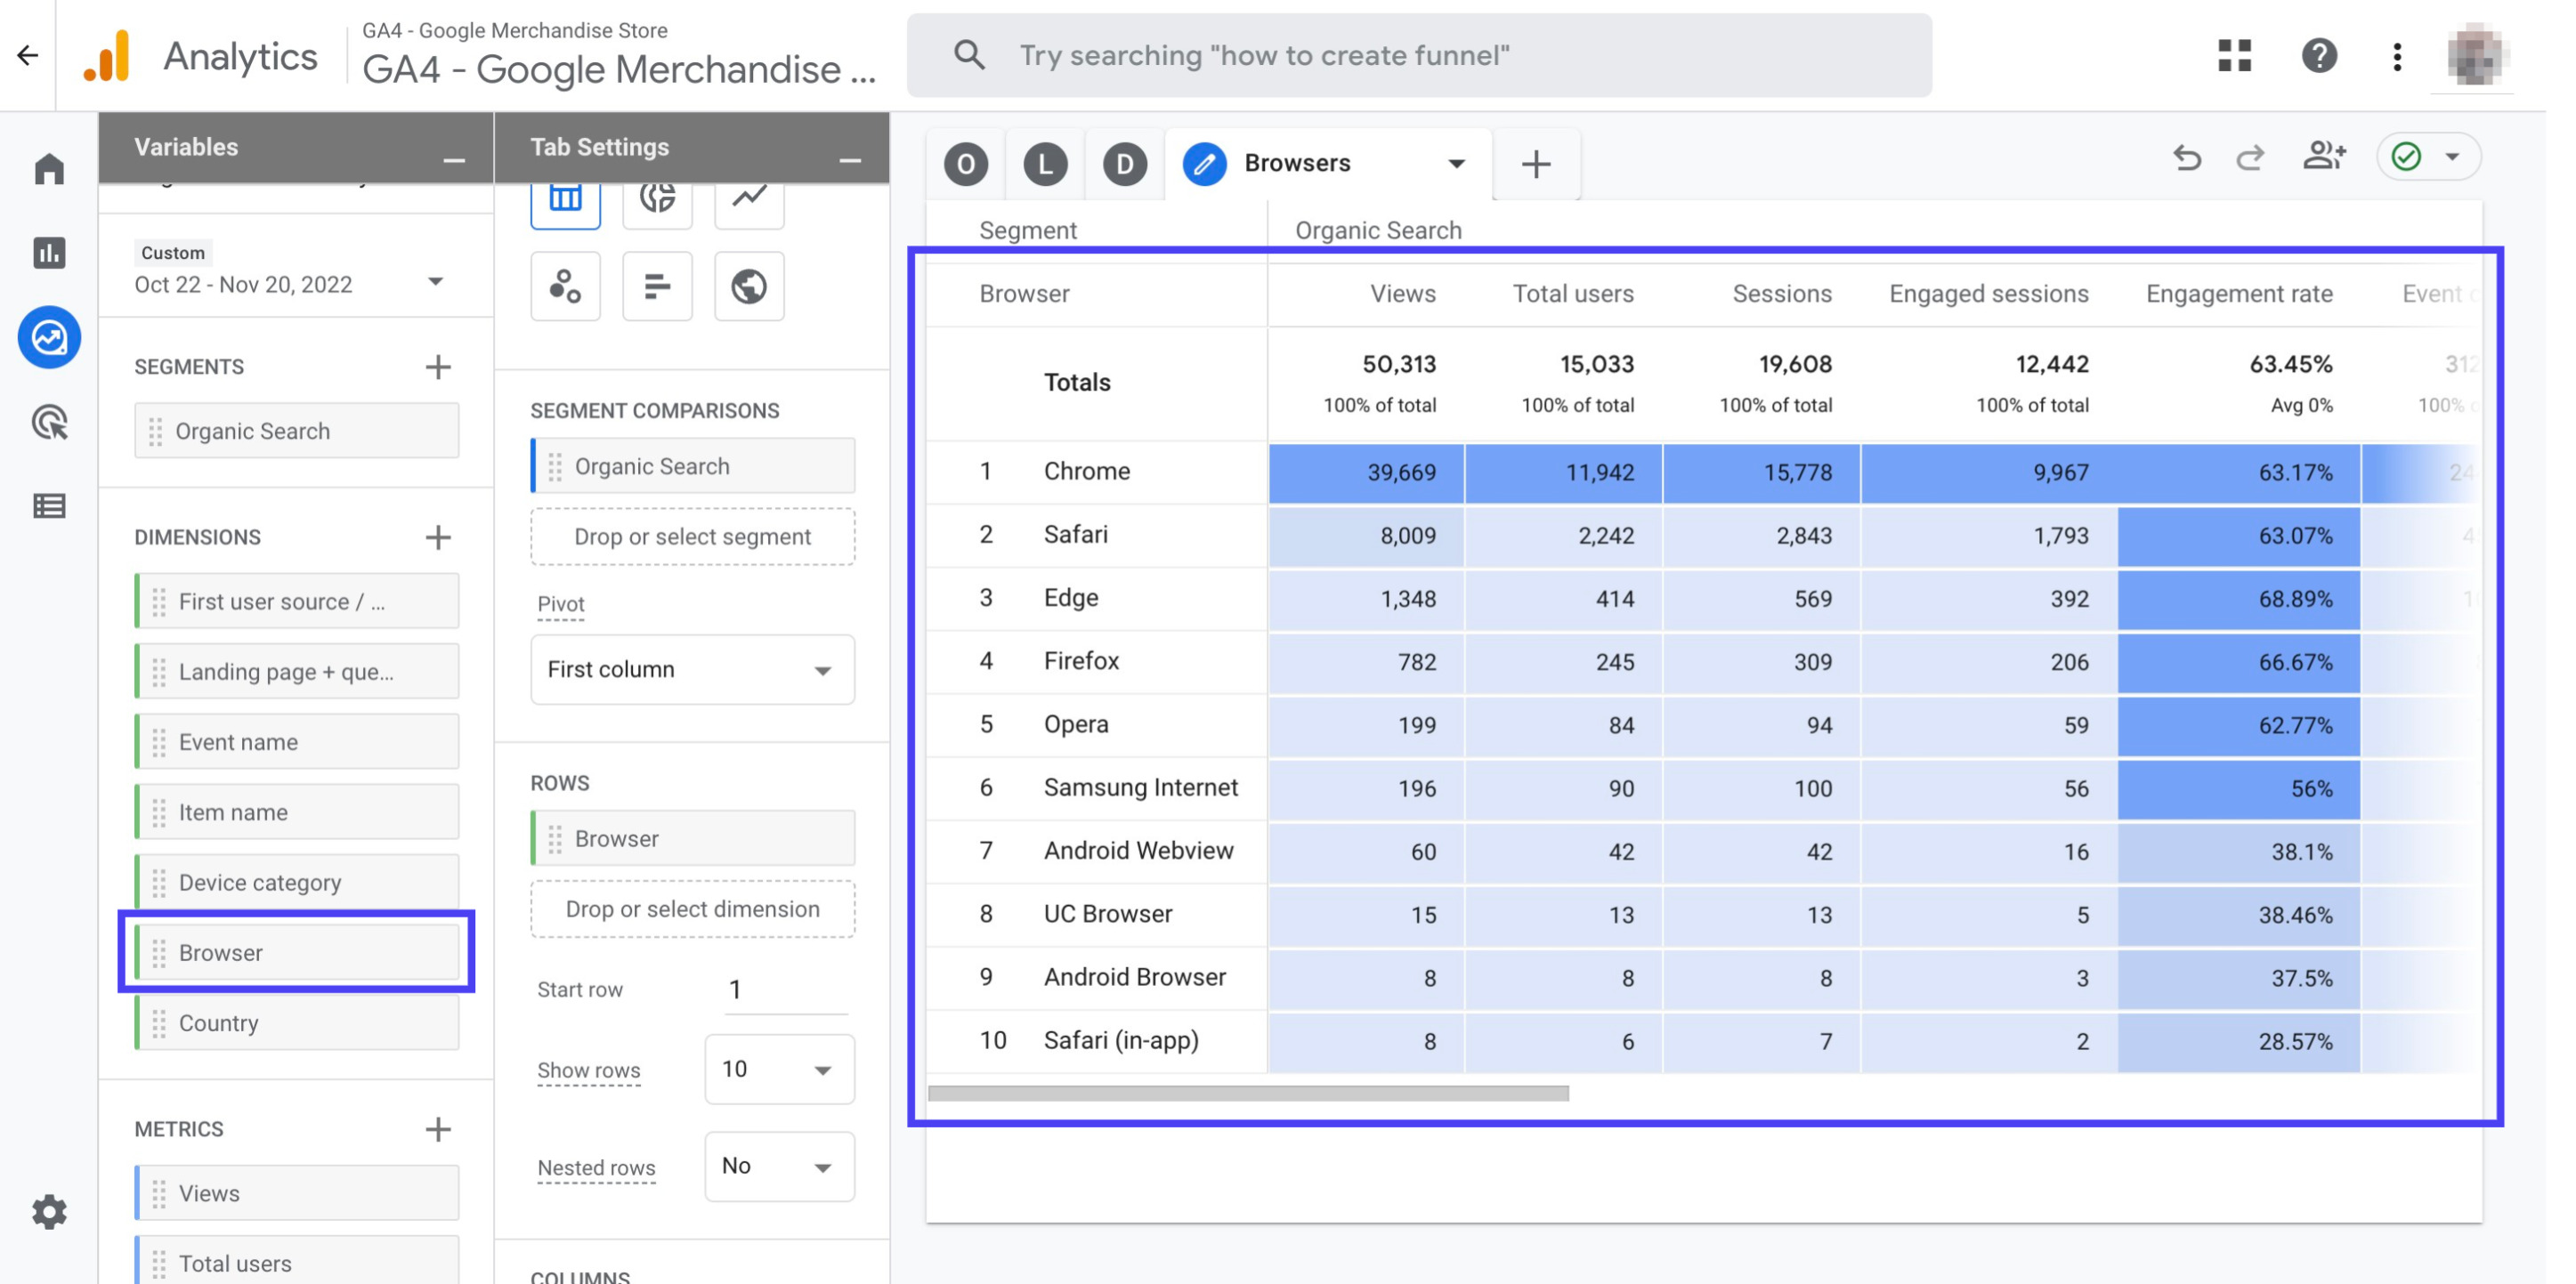
Double click the 'Browser' dimension to add it to your report
Click on the little arrow sign right next to 'Browsers'. Then, click 'Duplicate'
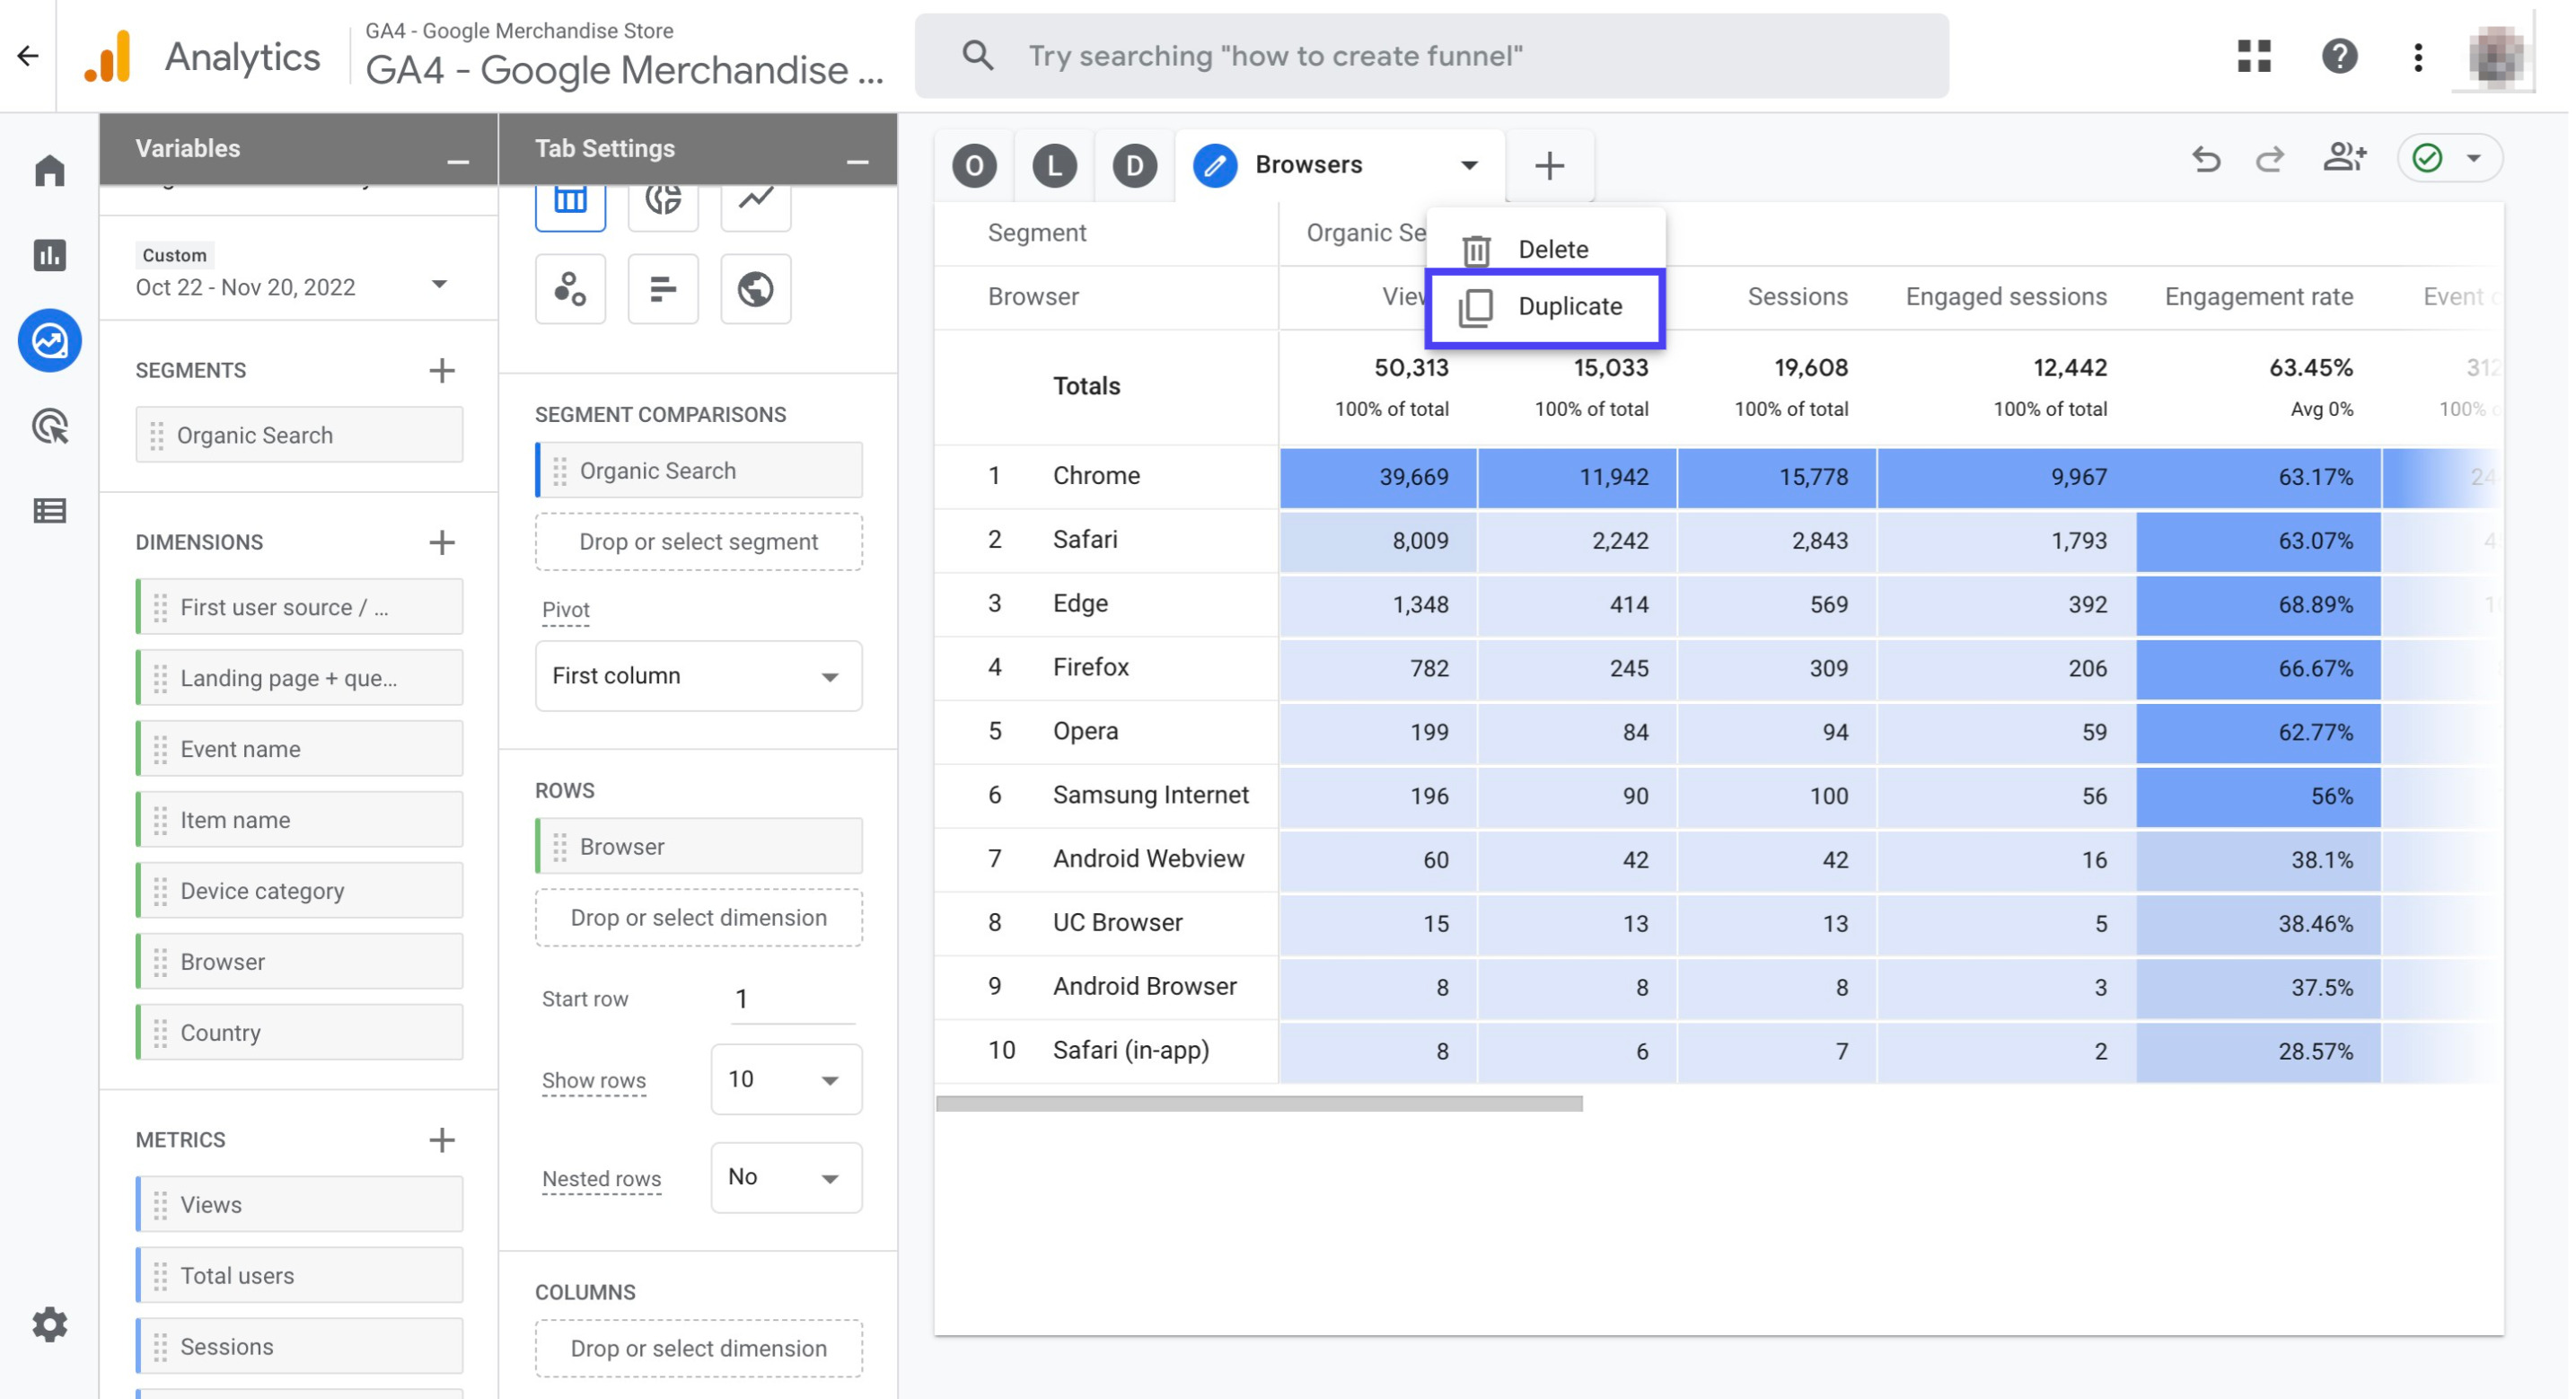
Name the new tab as 'Countries'
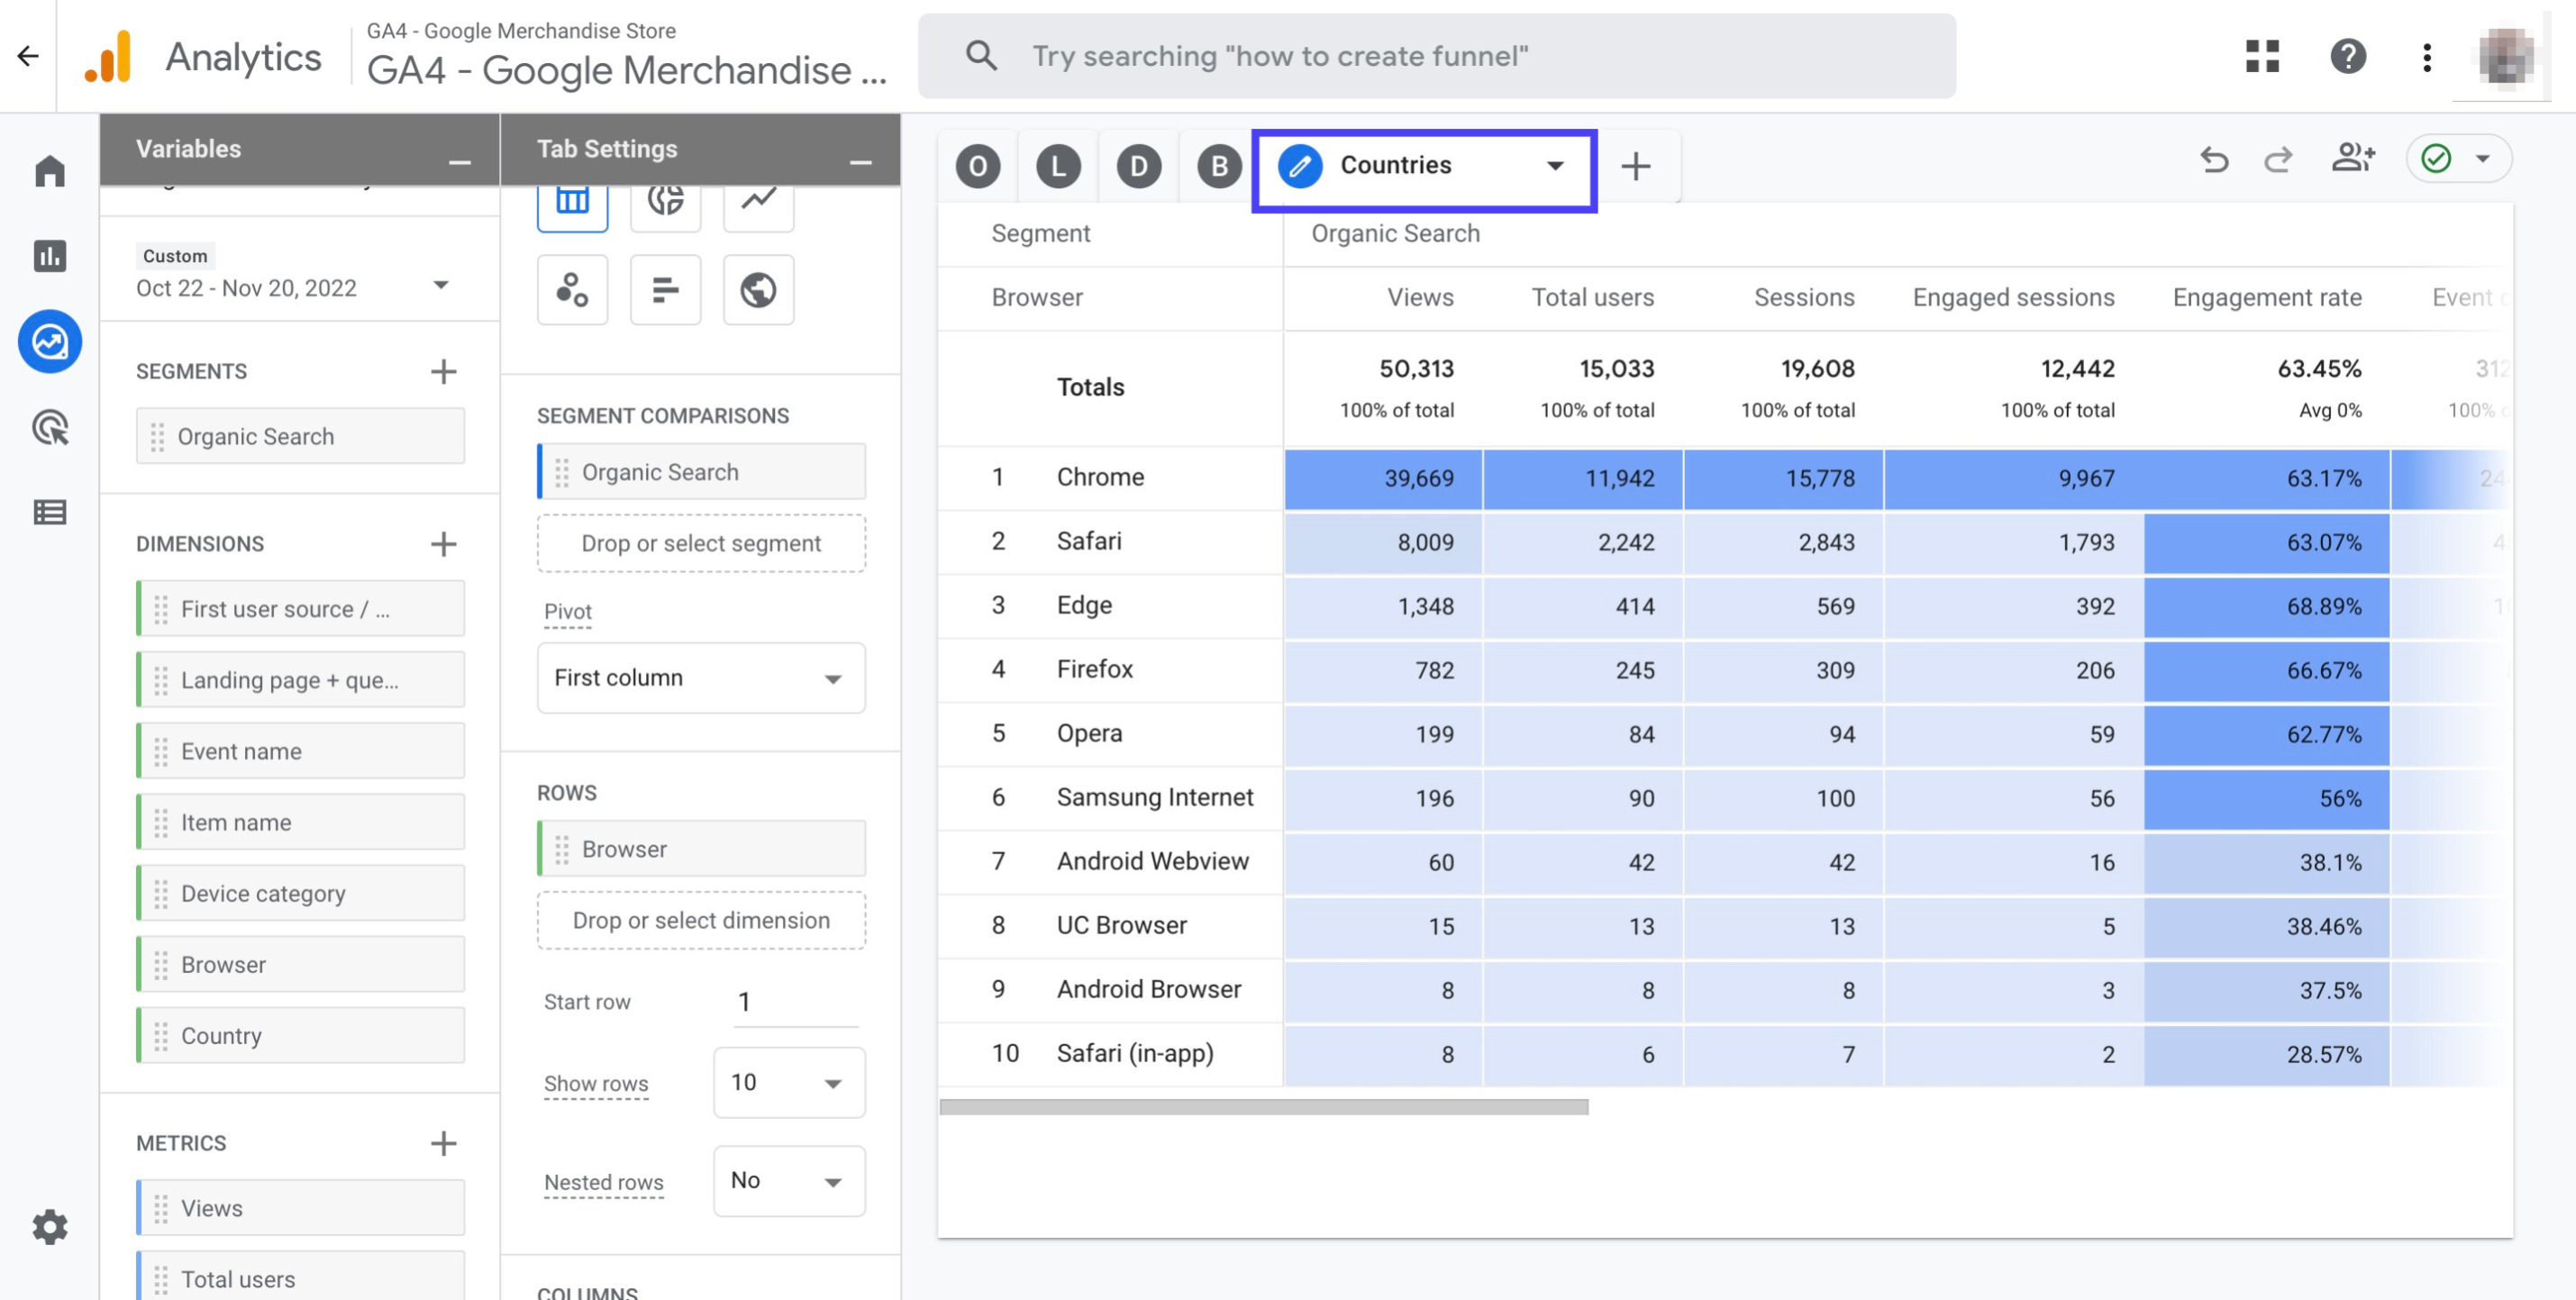
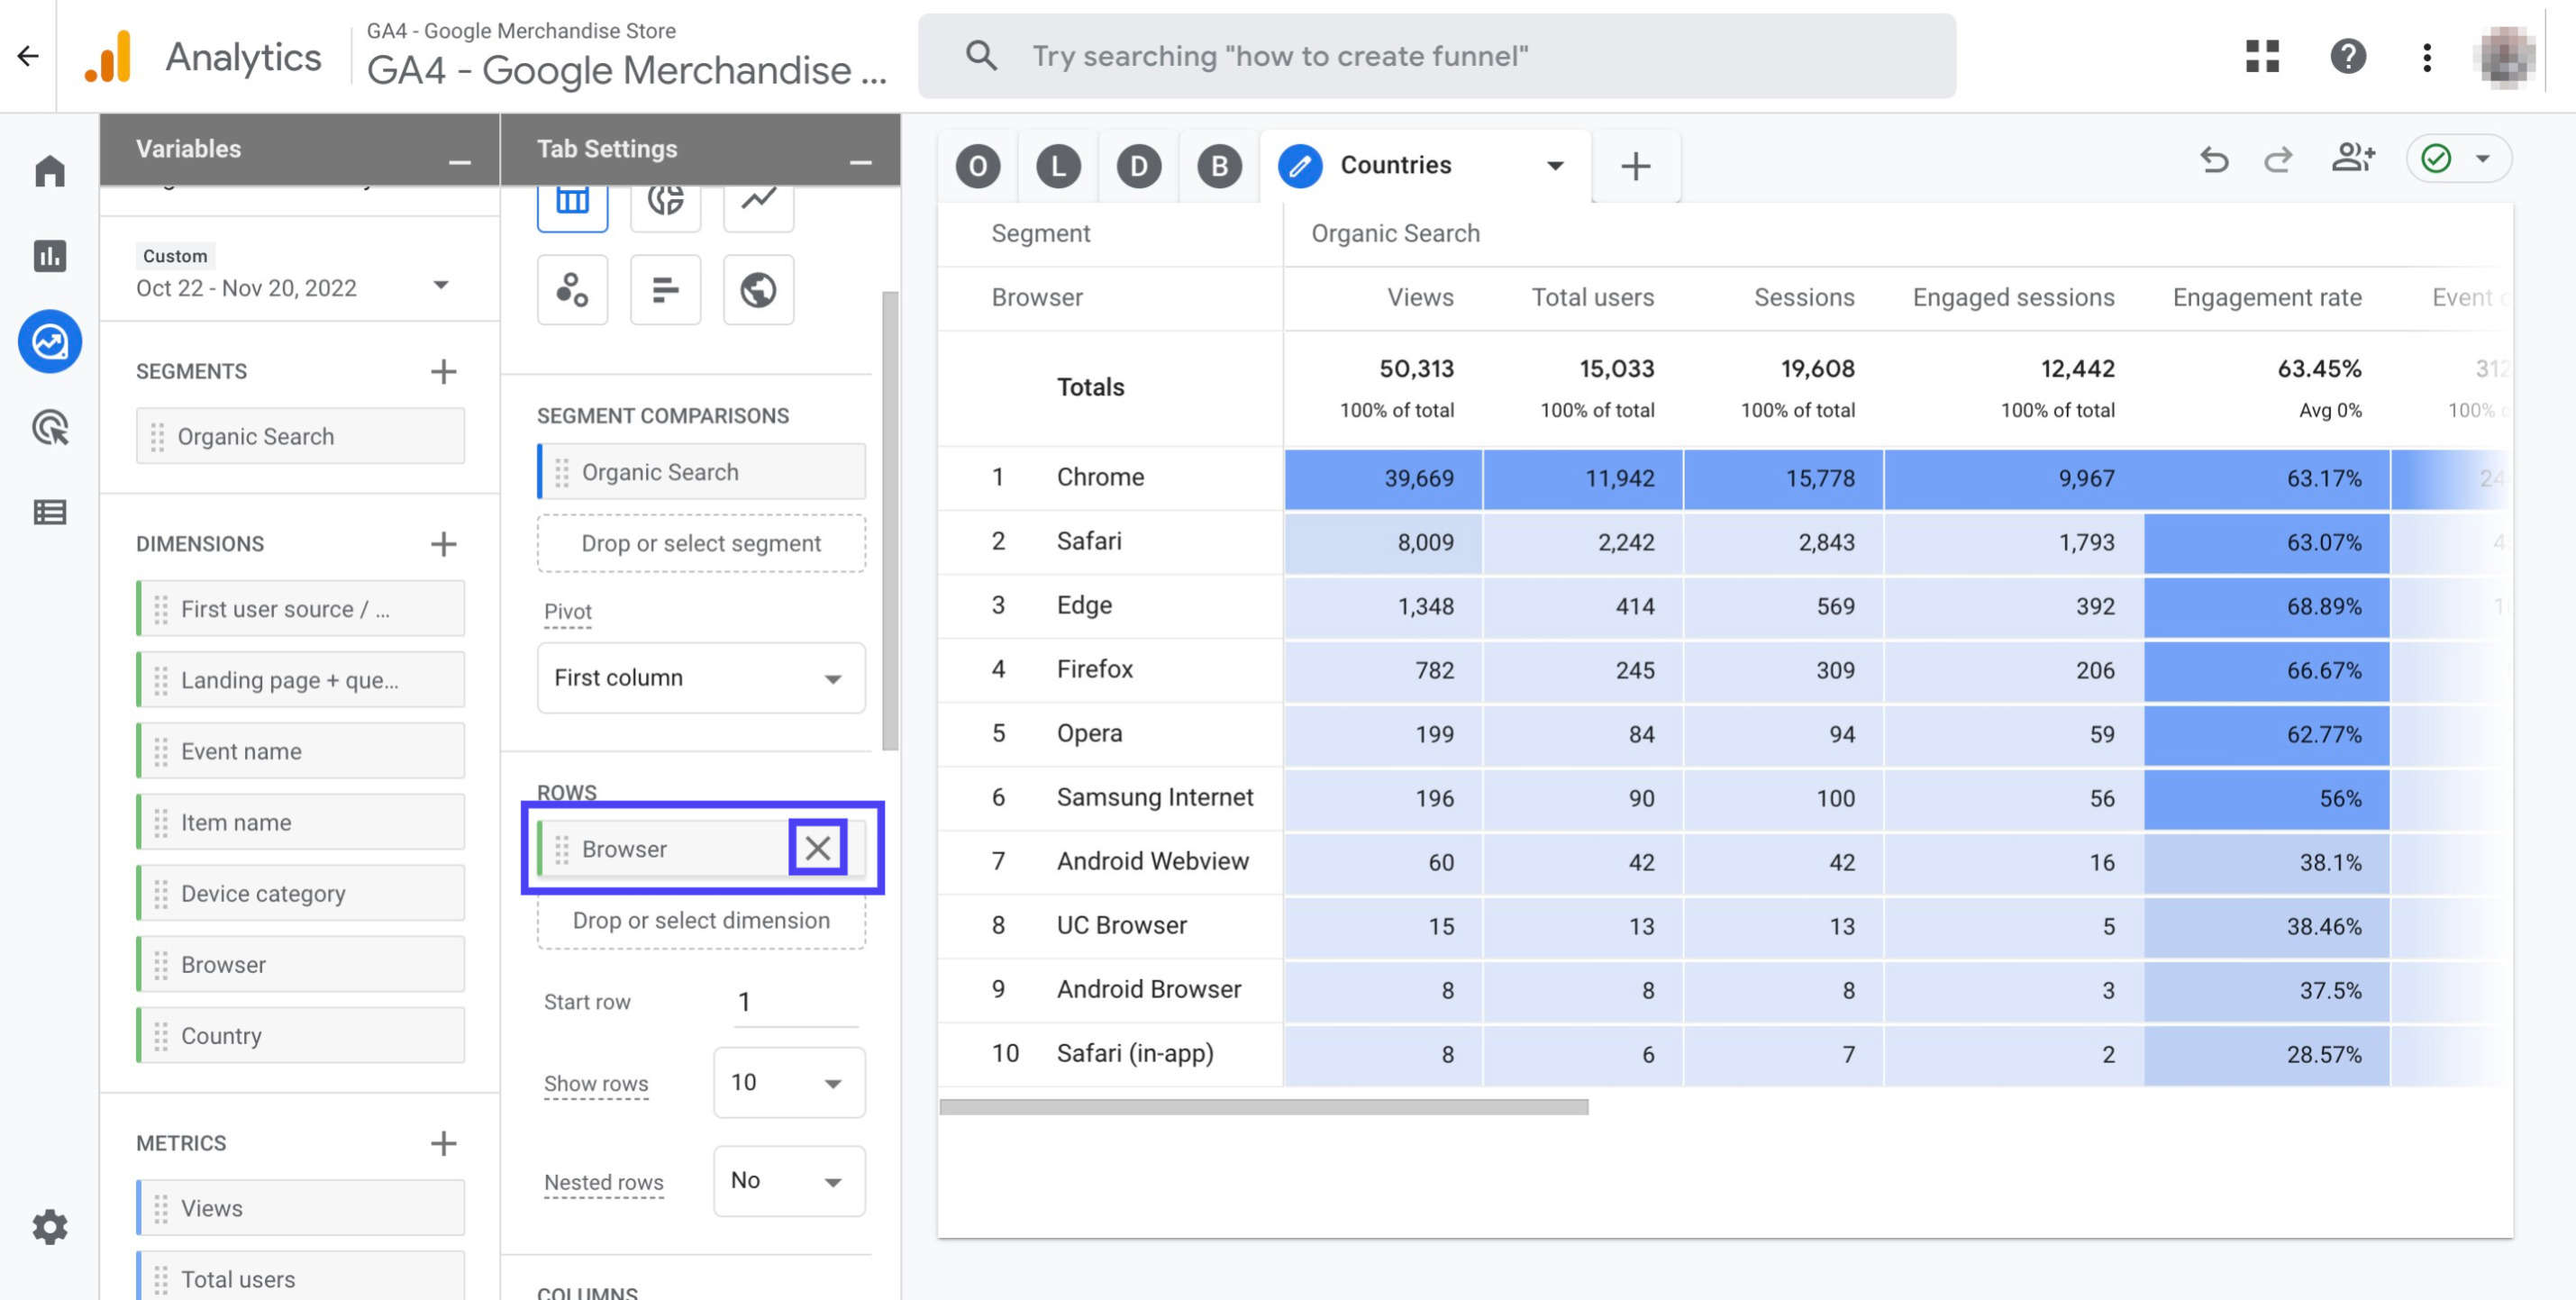
Click the cross sign next to the 'Browser' dimension to remove it from the report
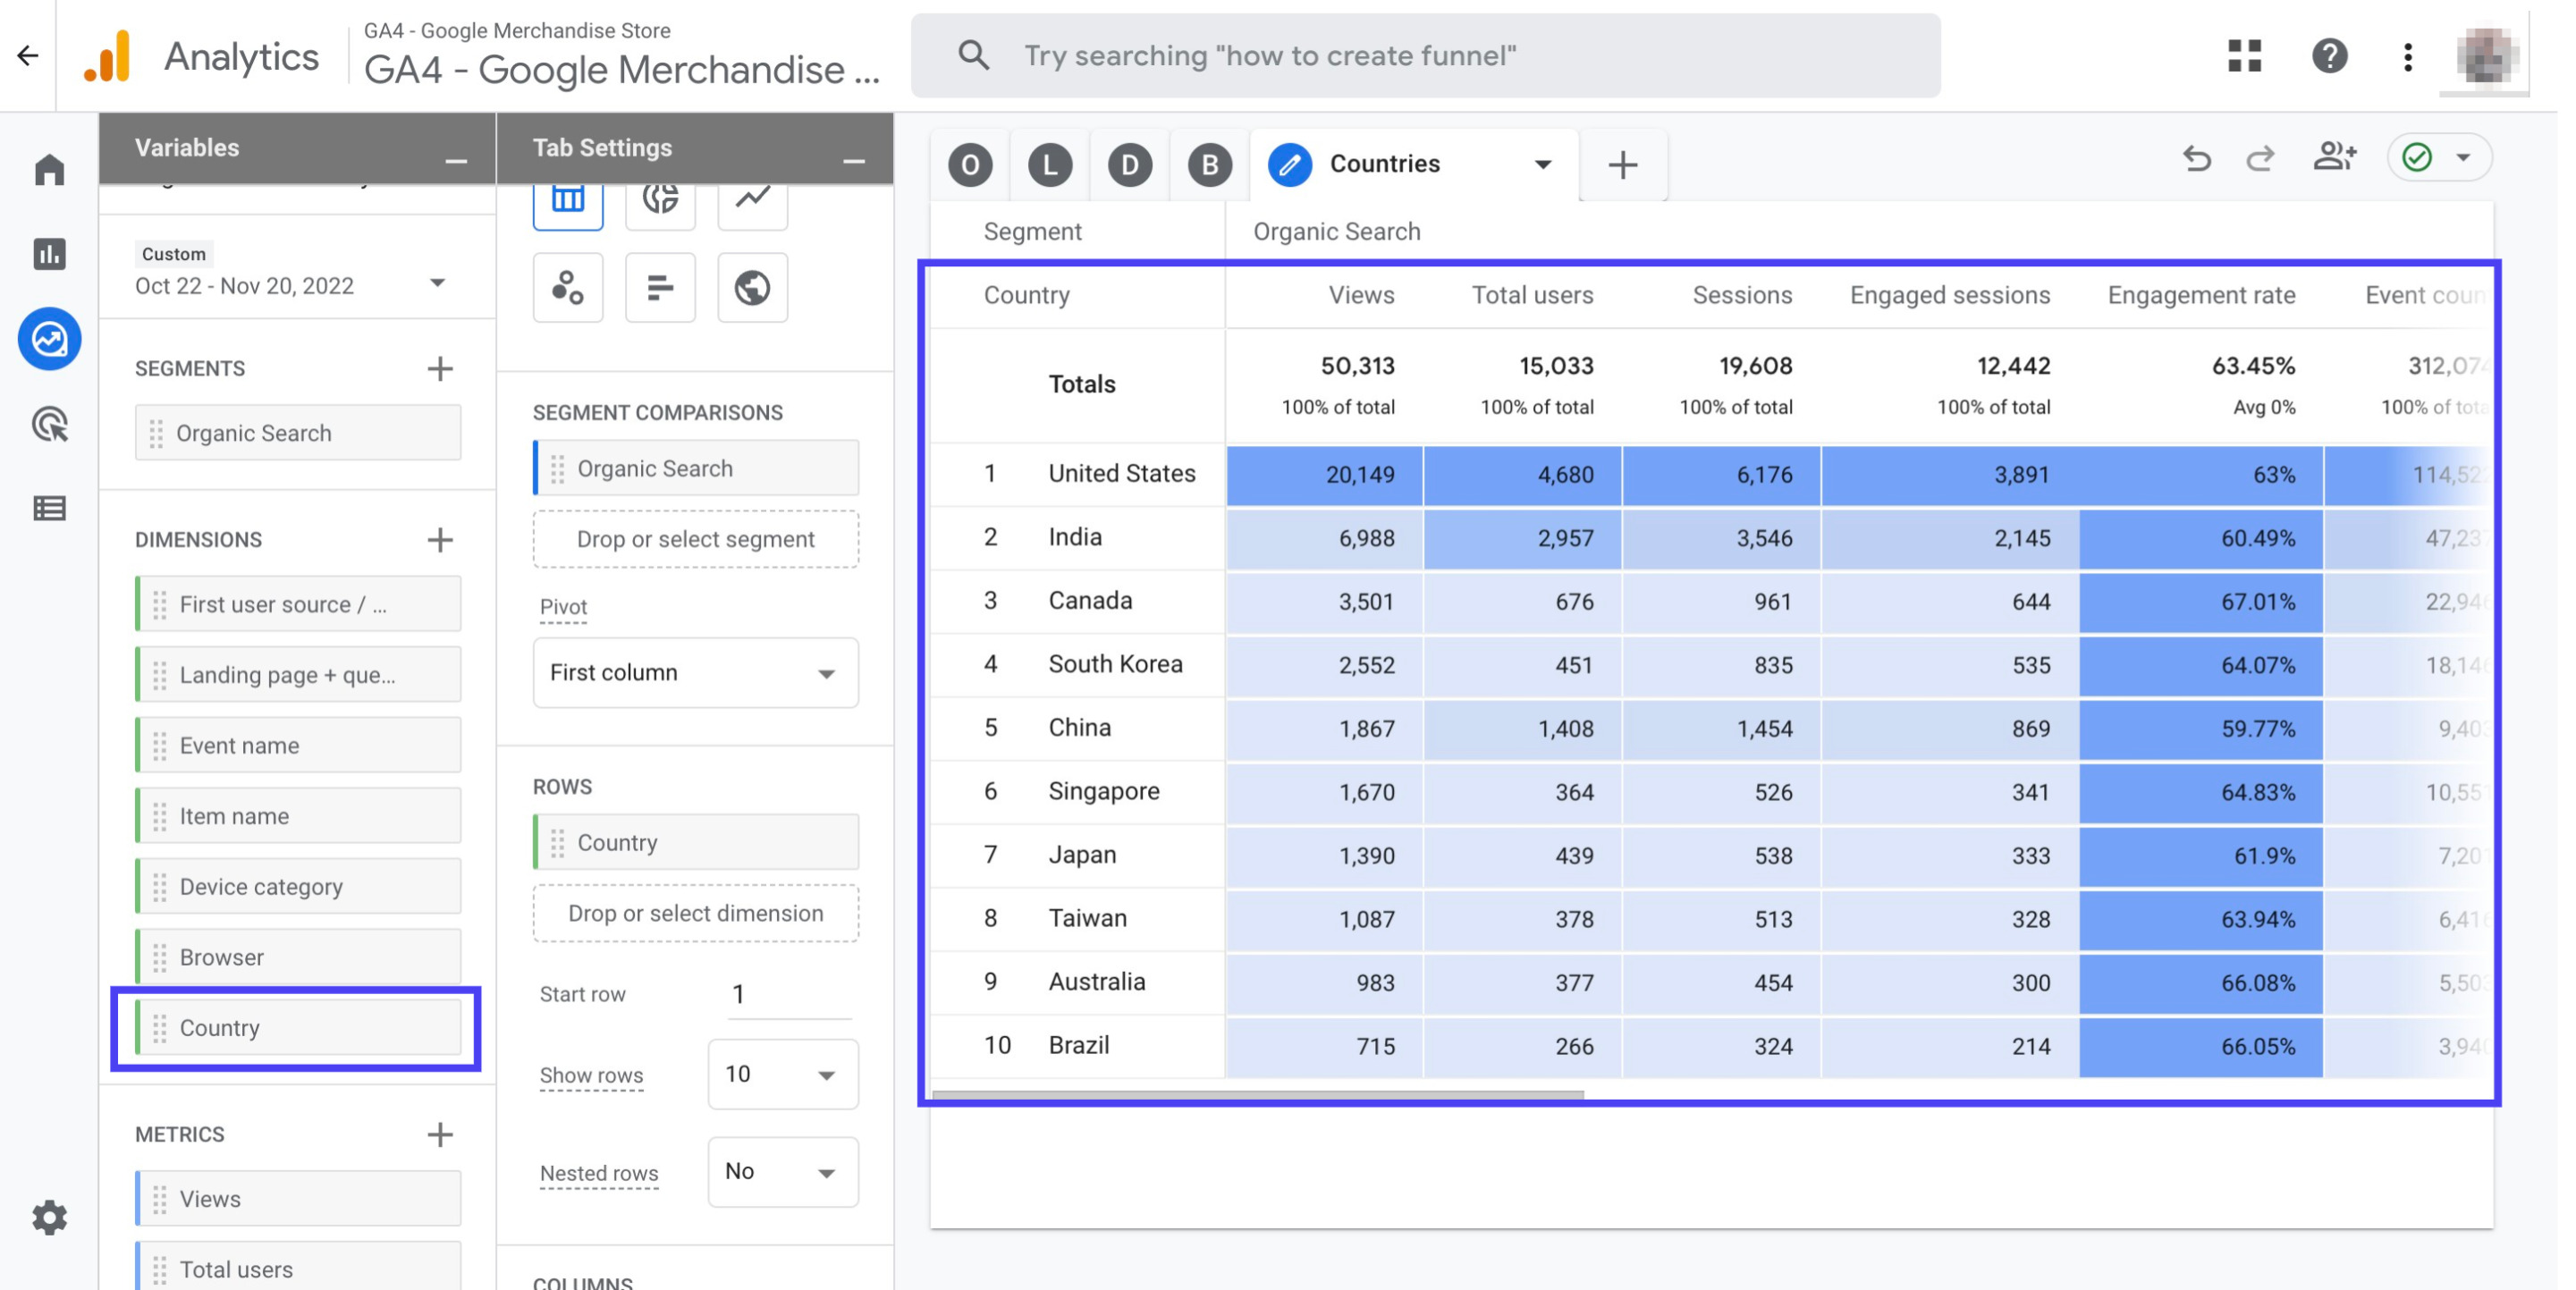
Double click the 'Country' dimension to add it to your report
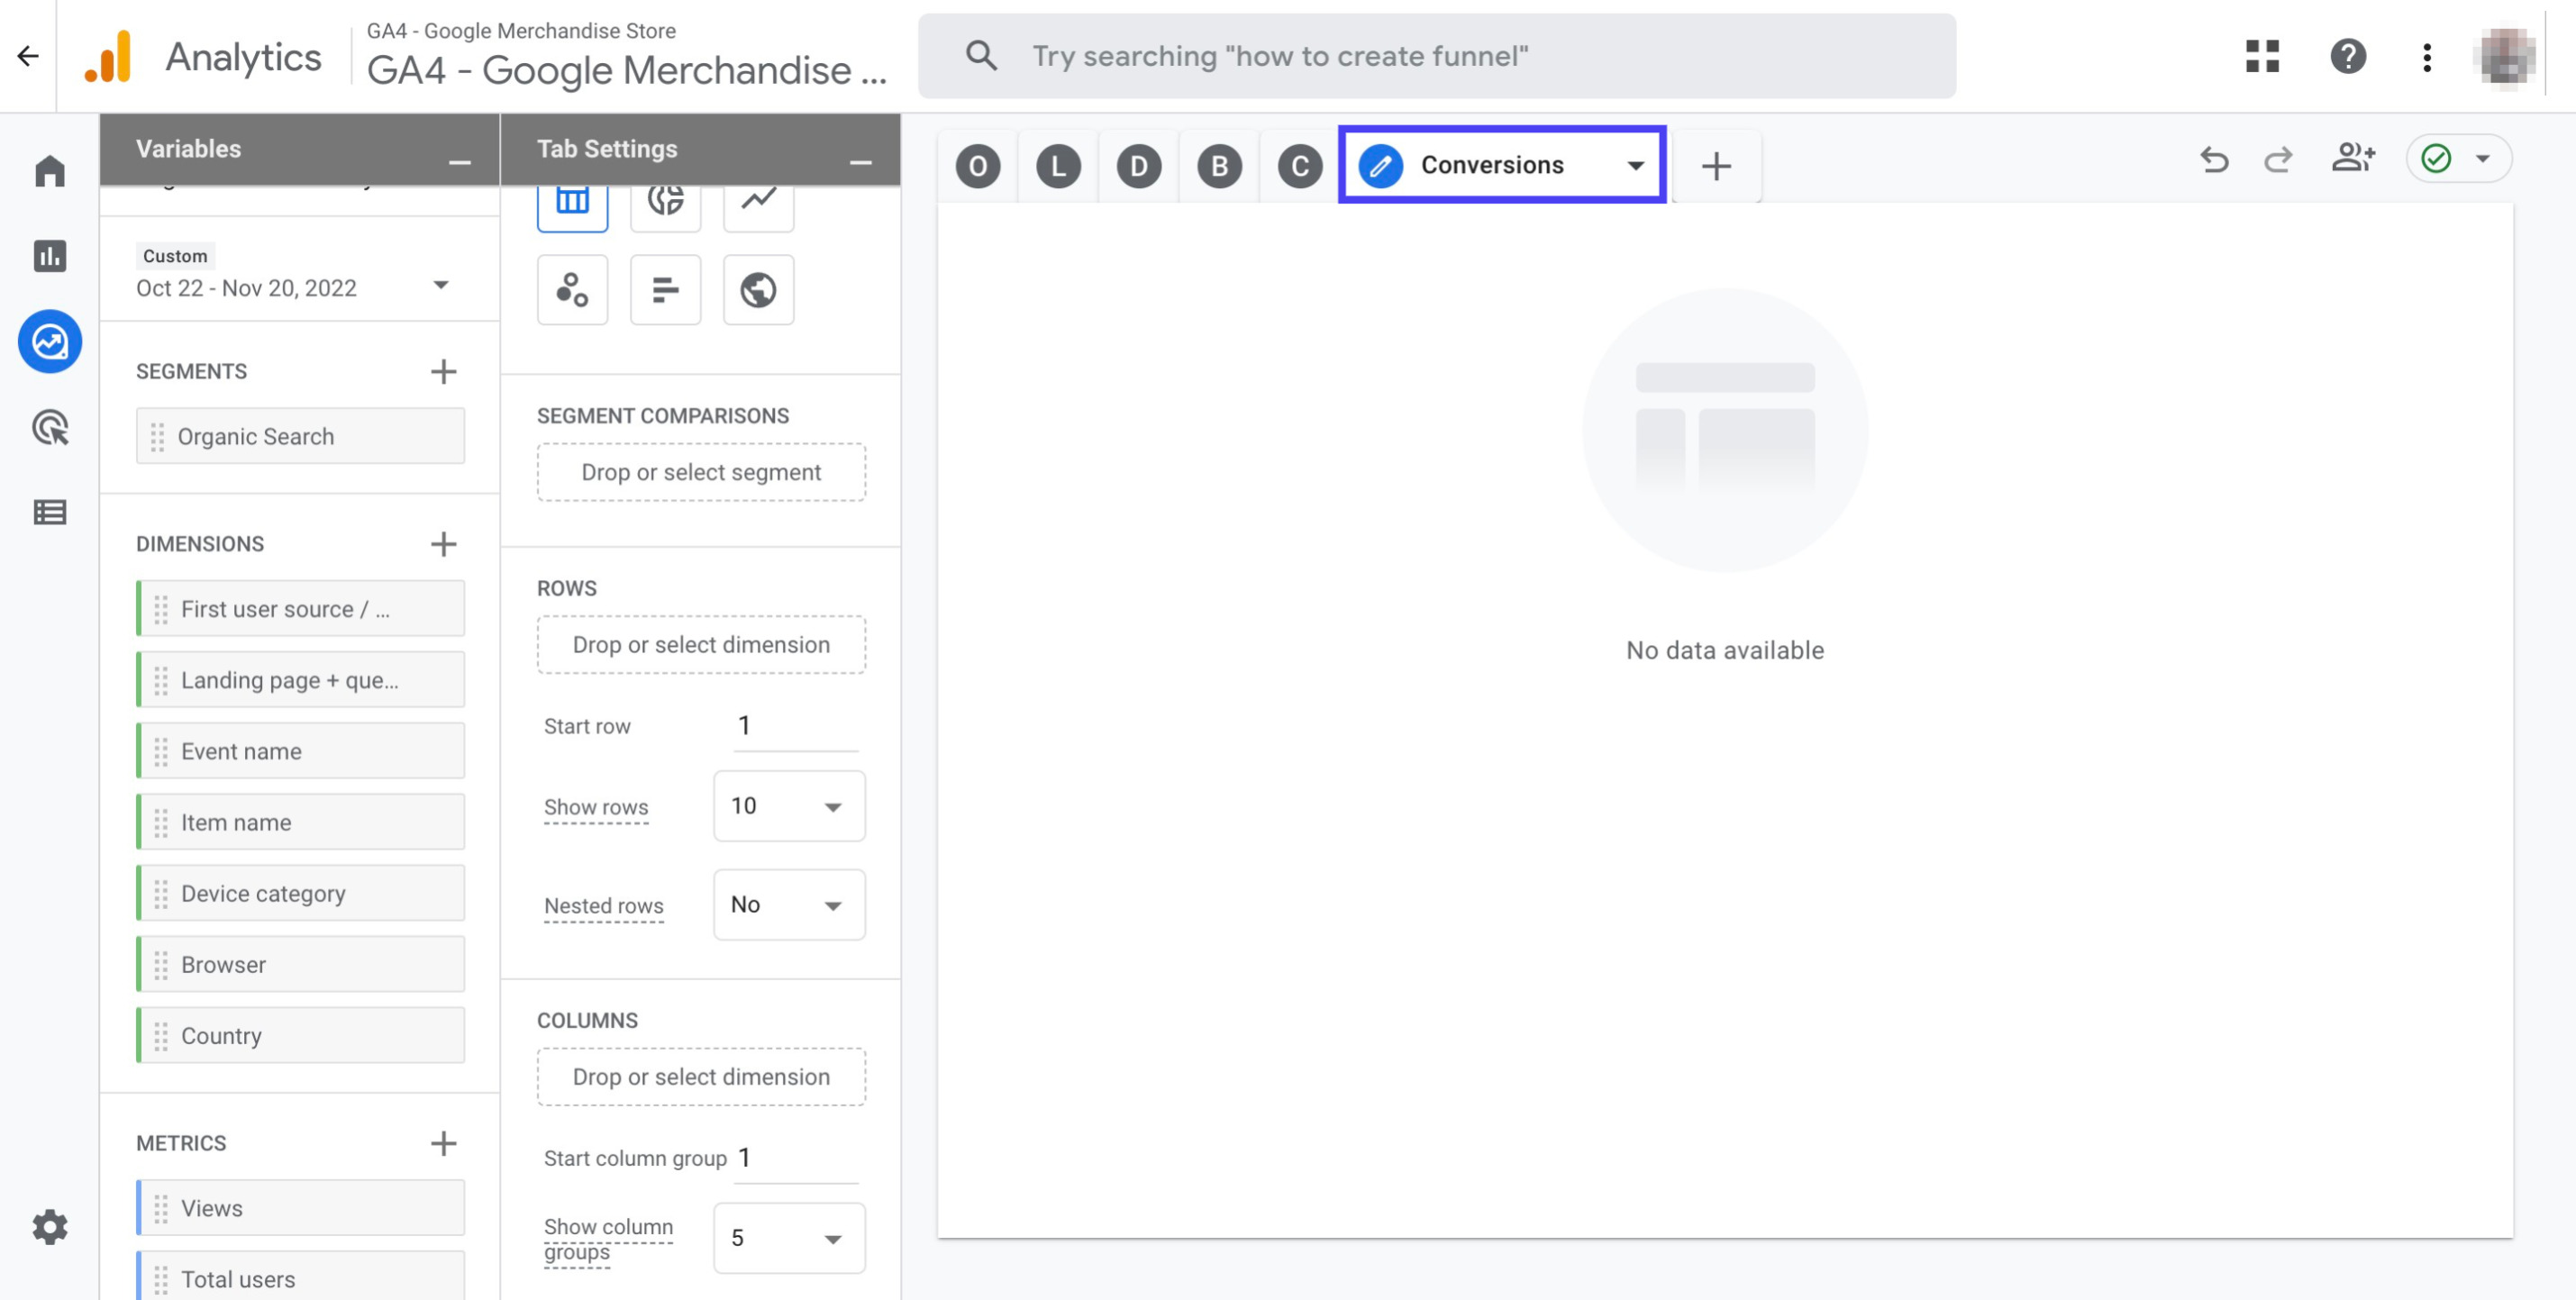
Click the '+' sign right next to the 'Countries' tab. Then, click on 'Free form'
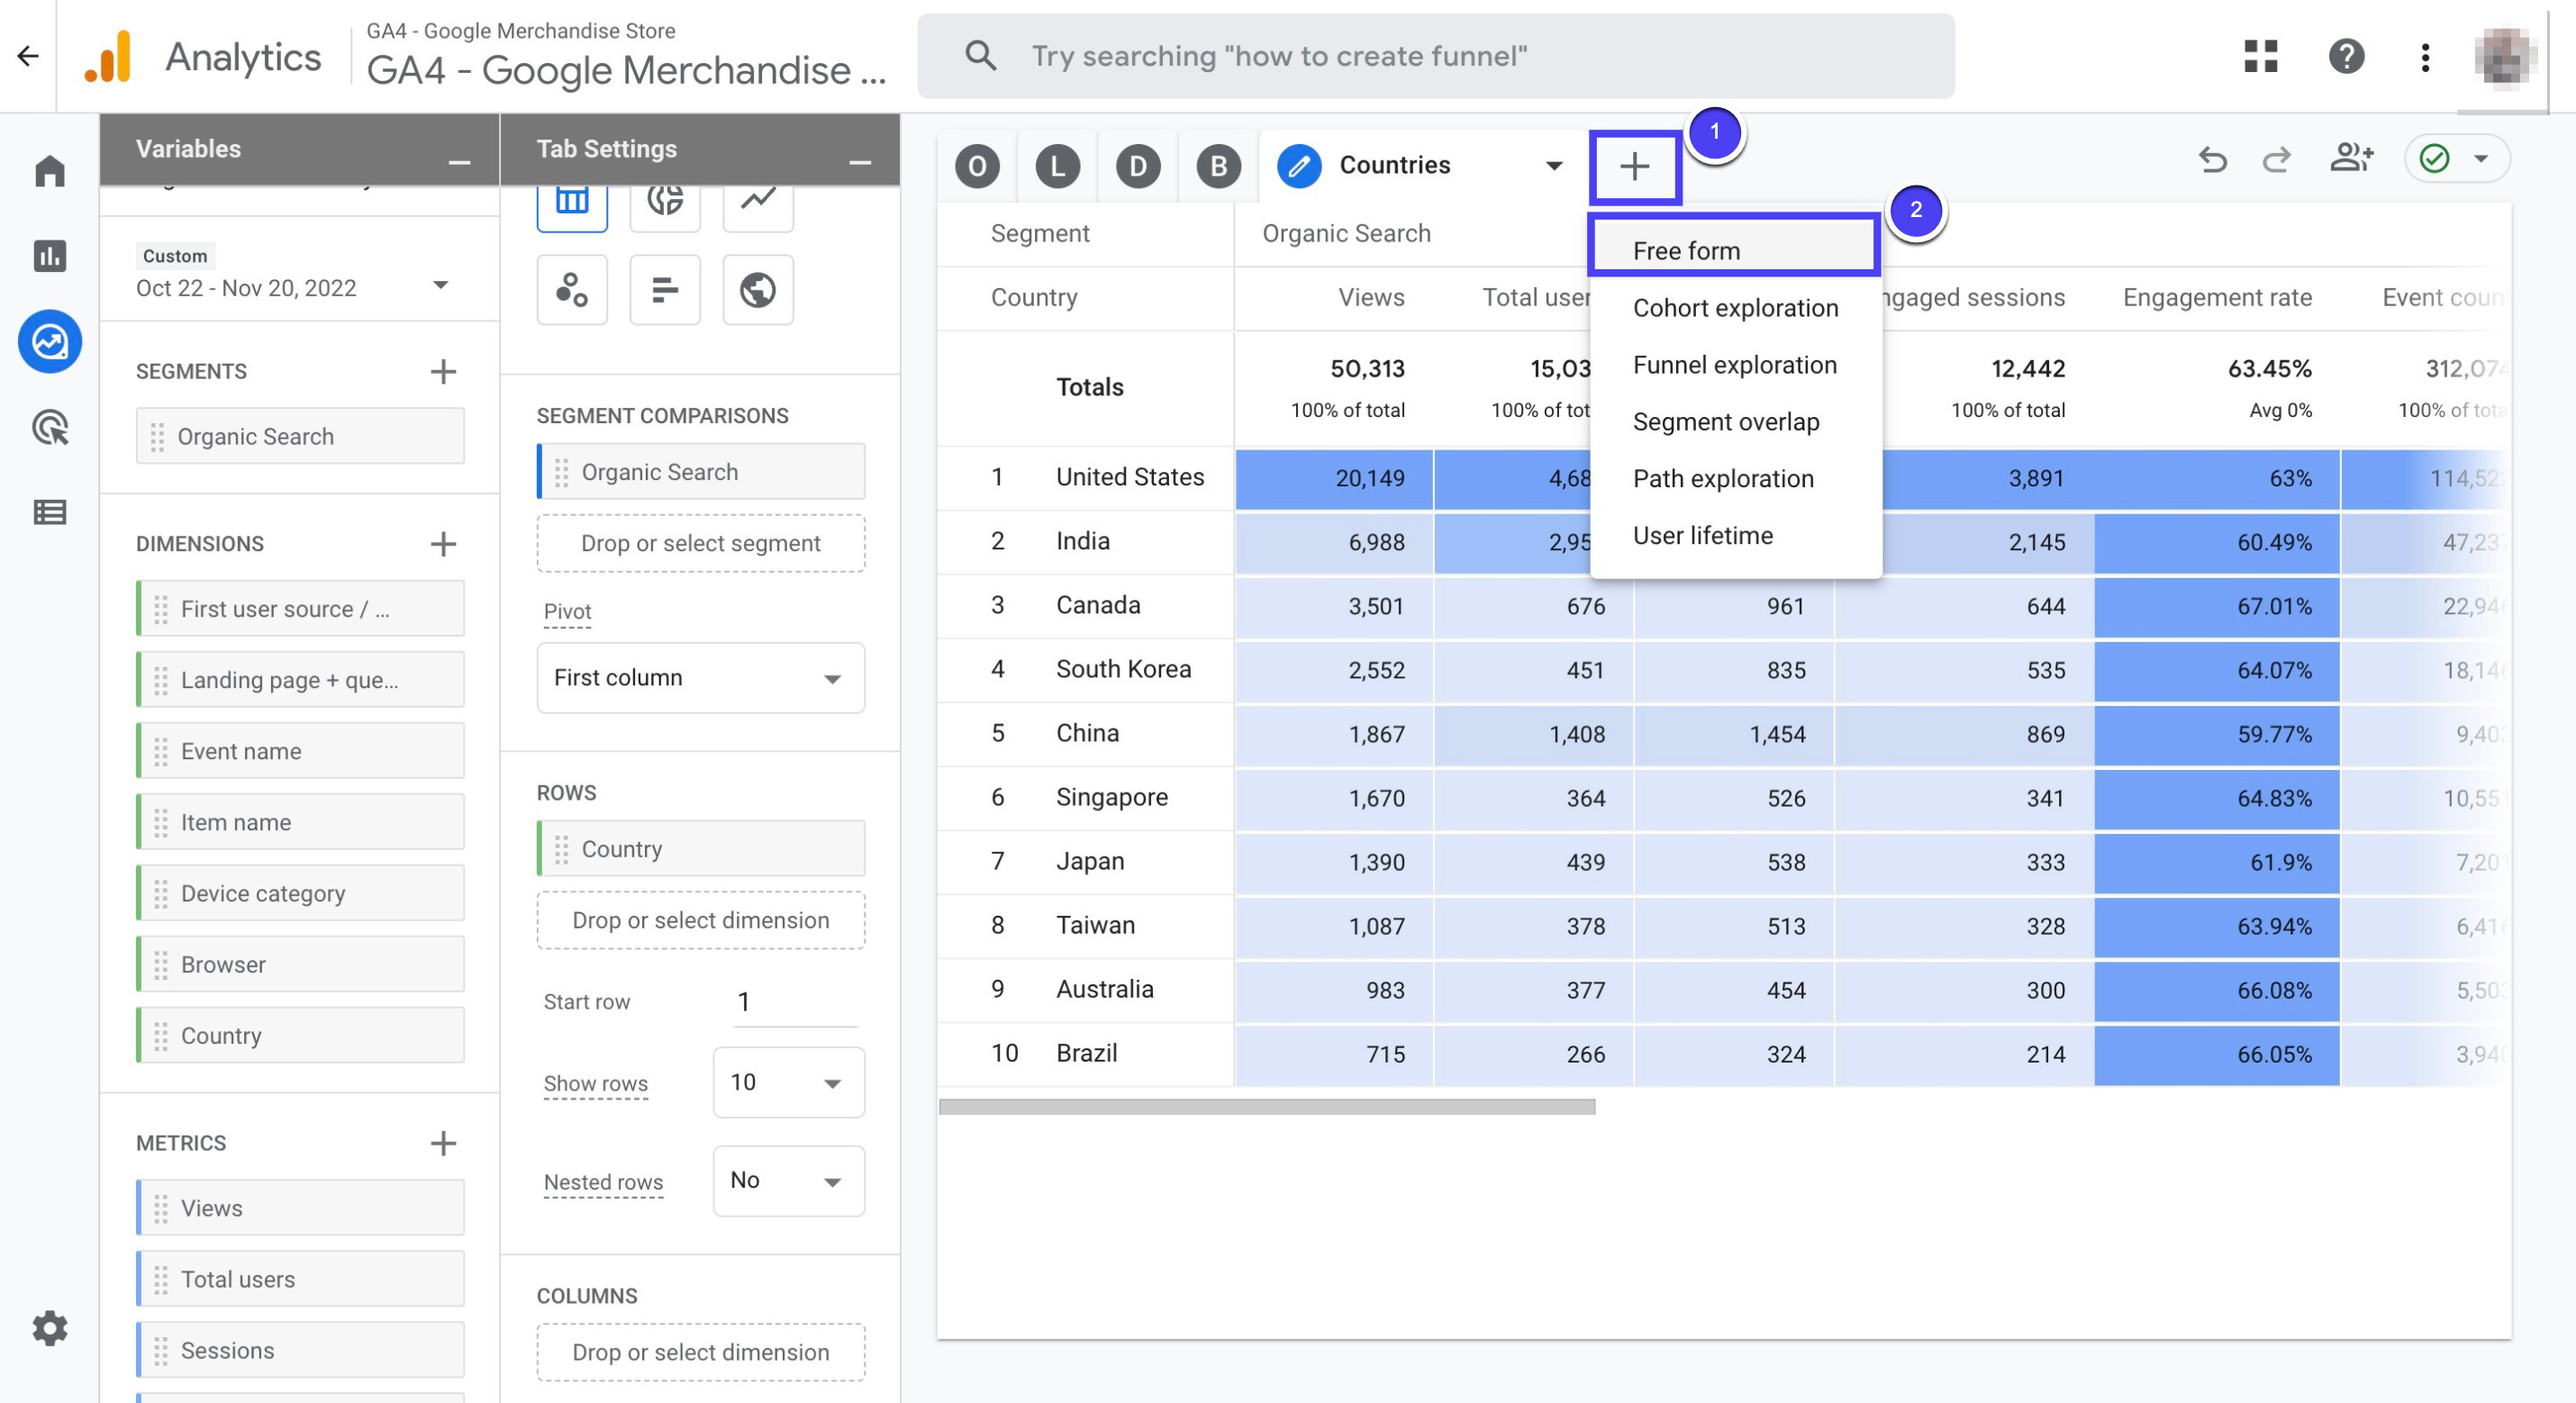
Name the new tab as 'Conversions'
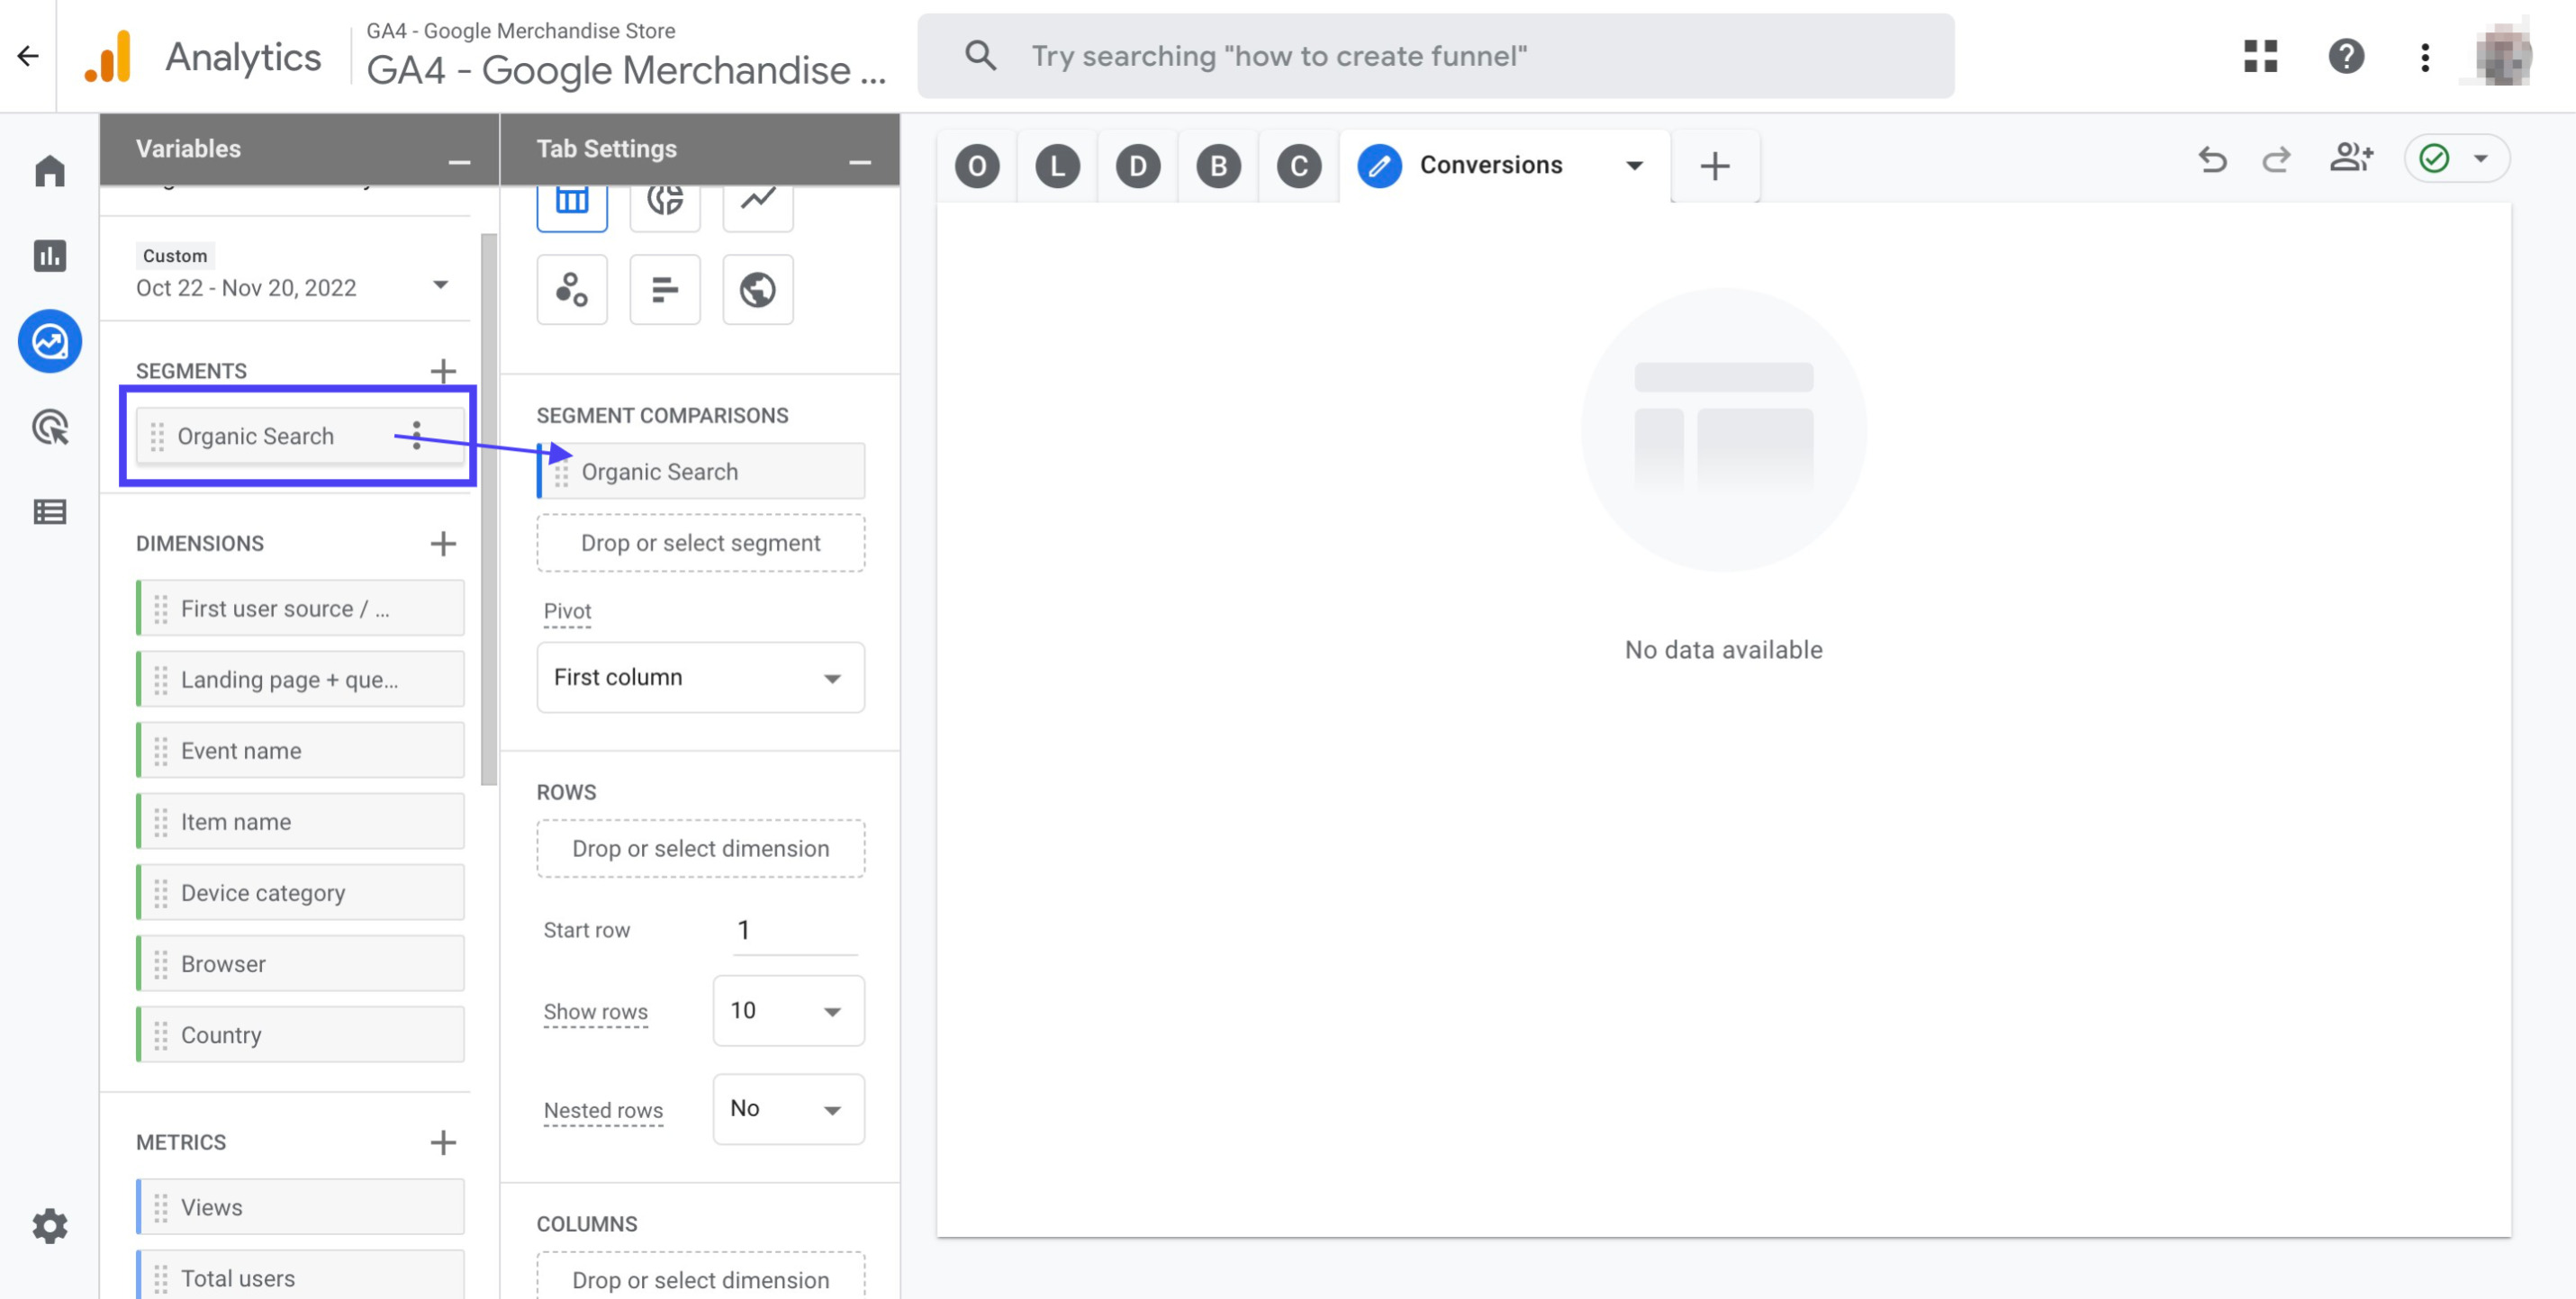
Double click the 'Organic search' segment in order to add it to your report
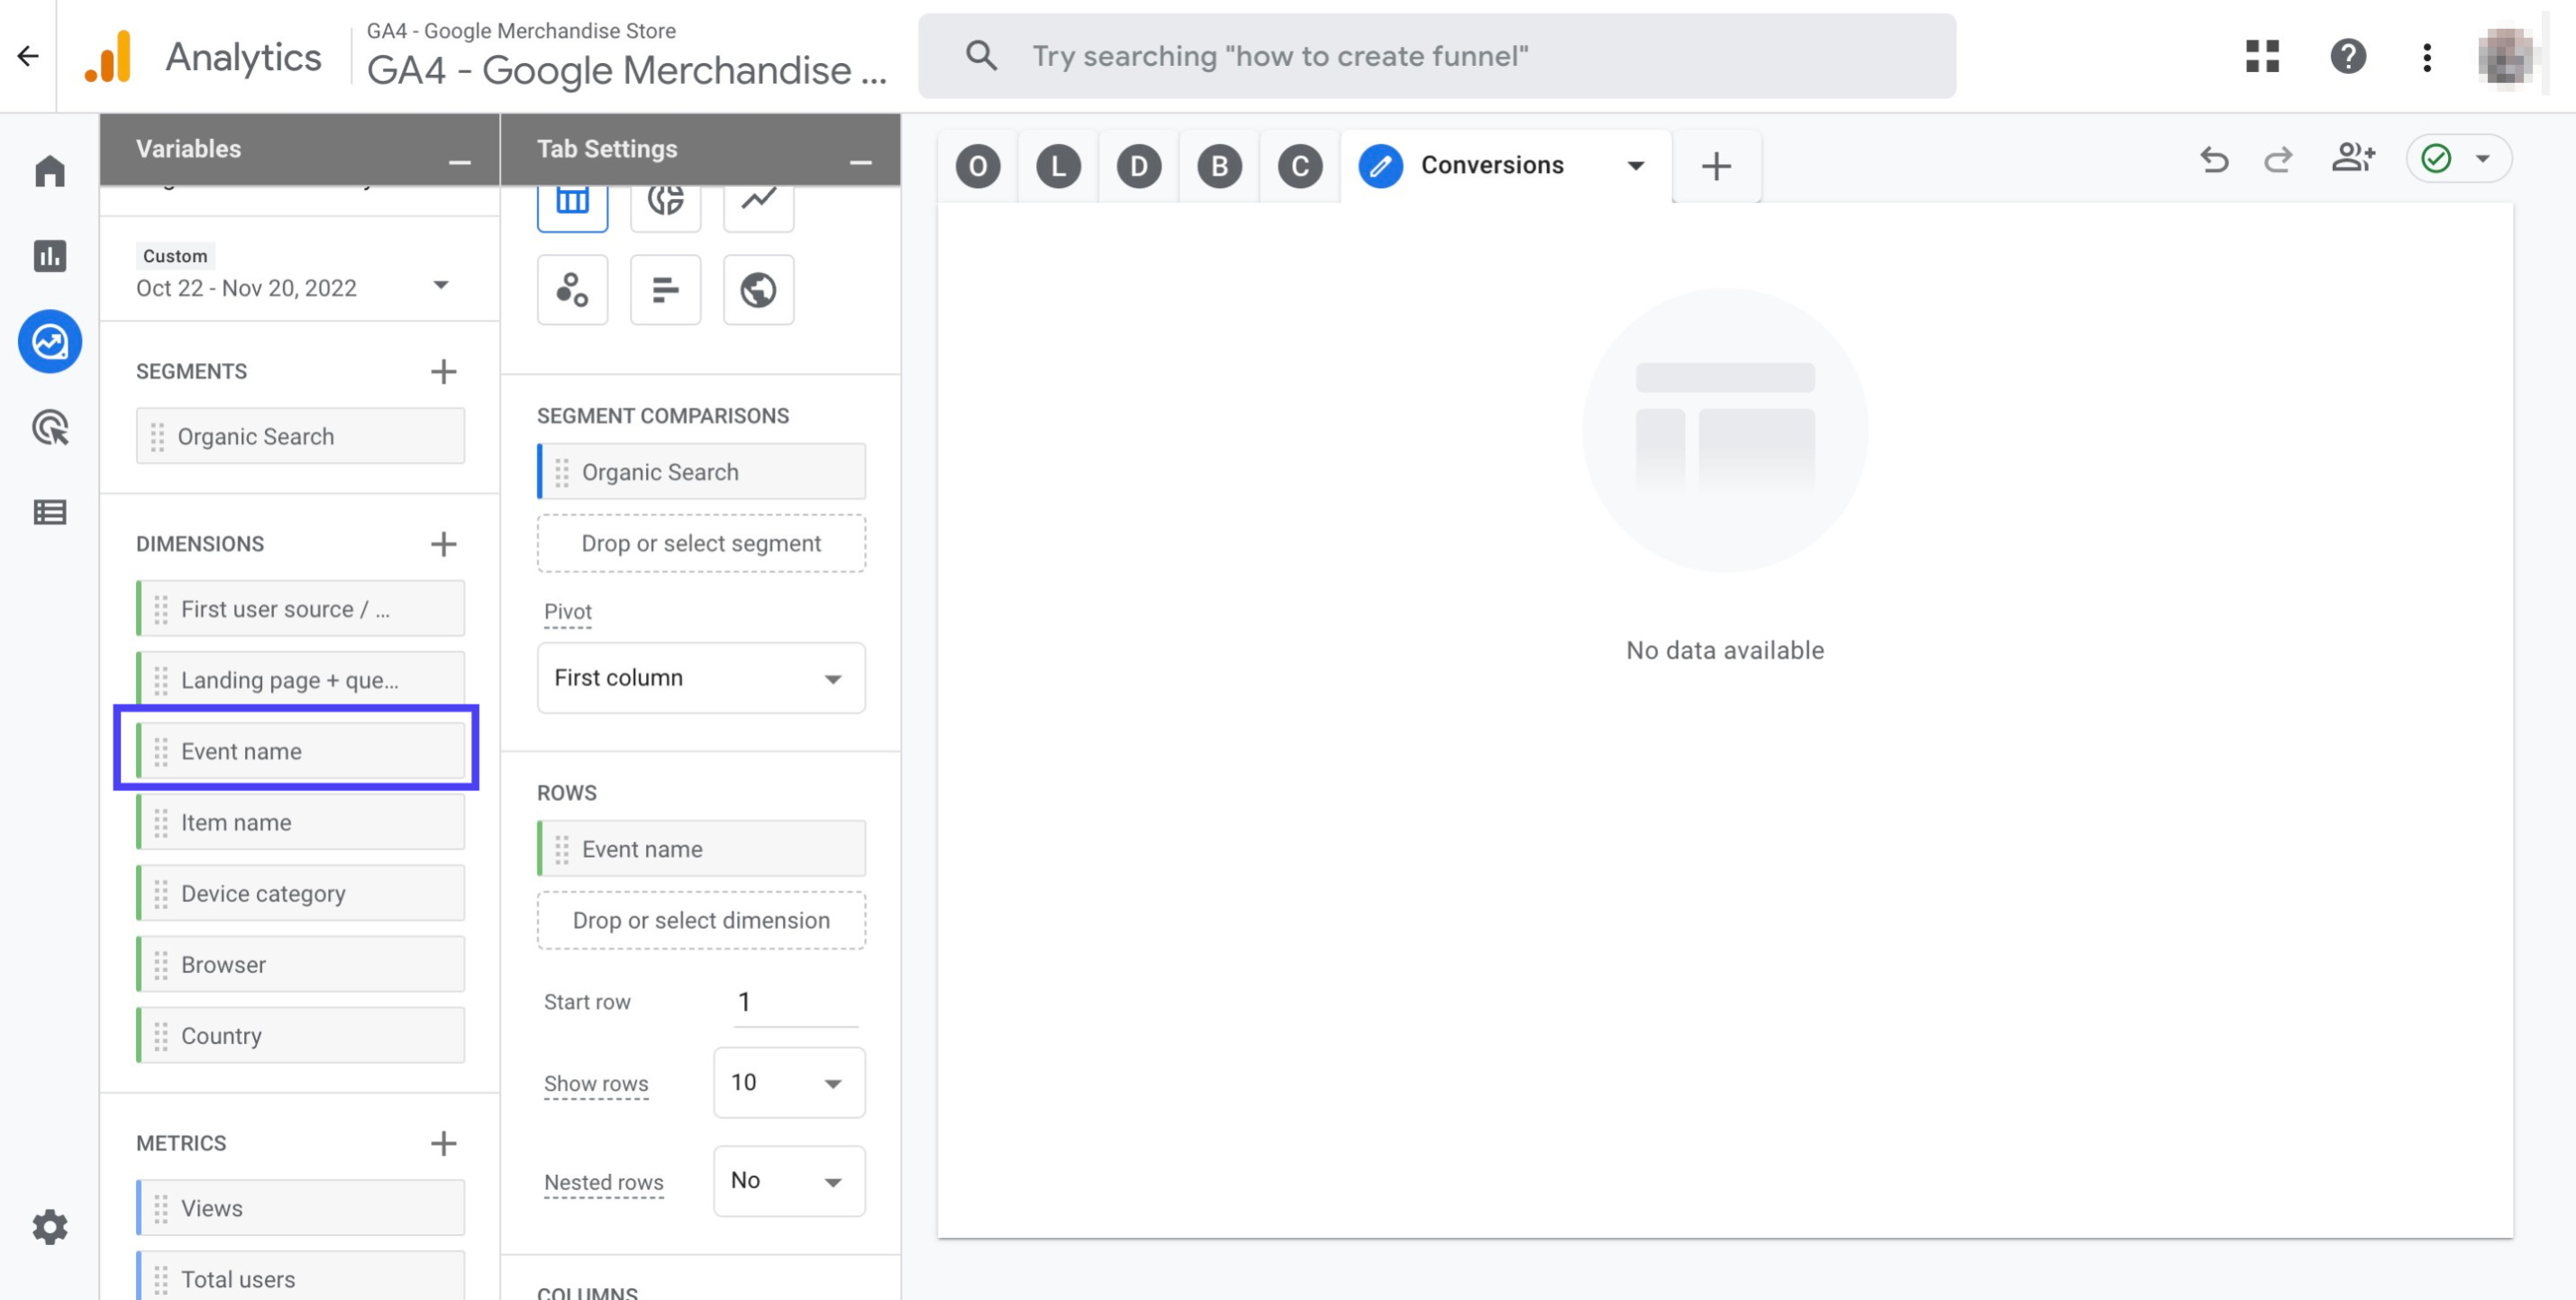
Double click the 'Event name' dimension to add it to your report
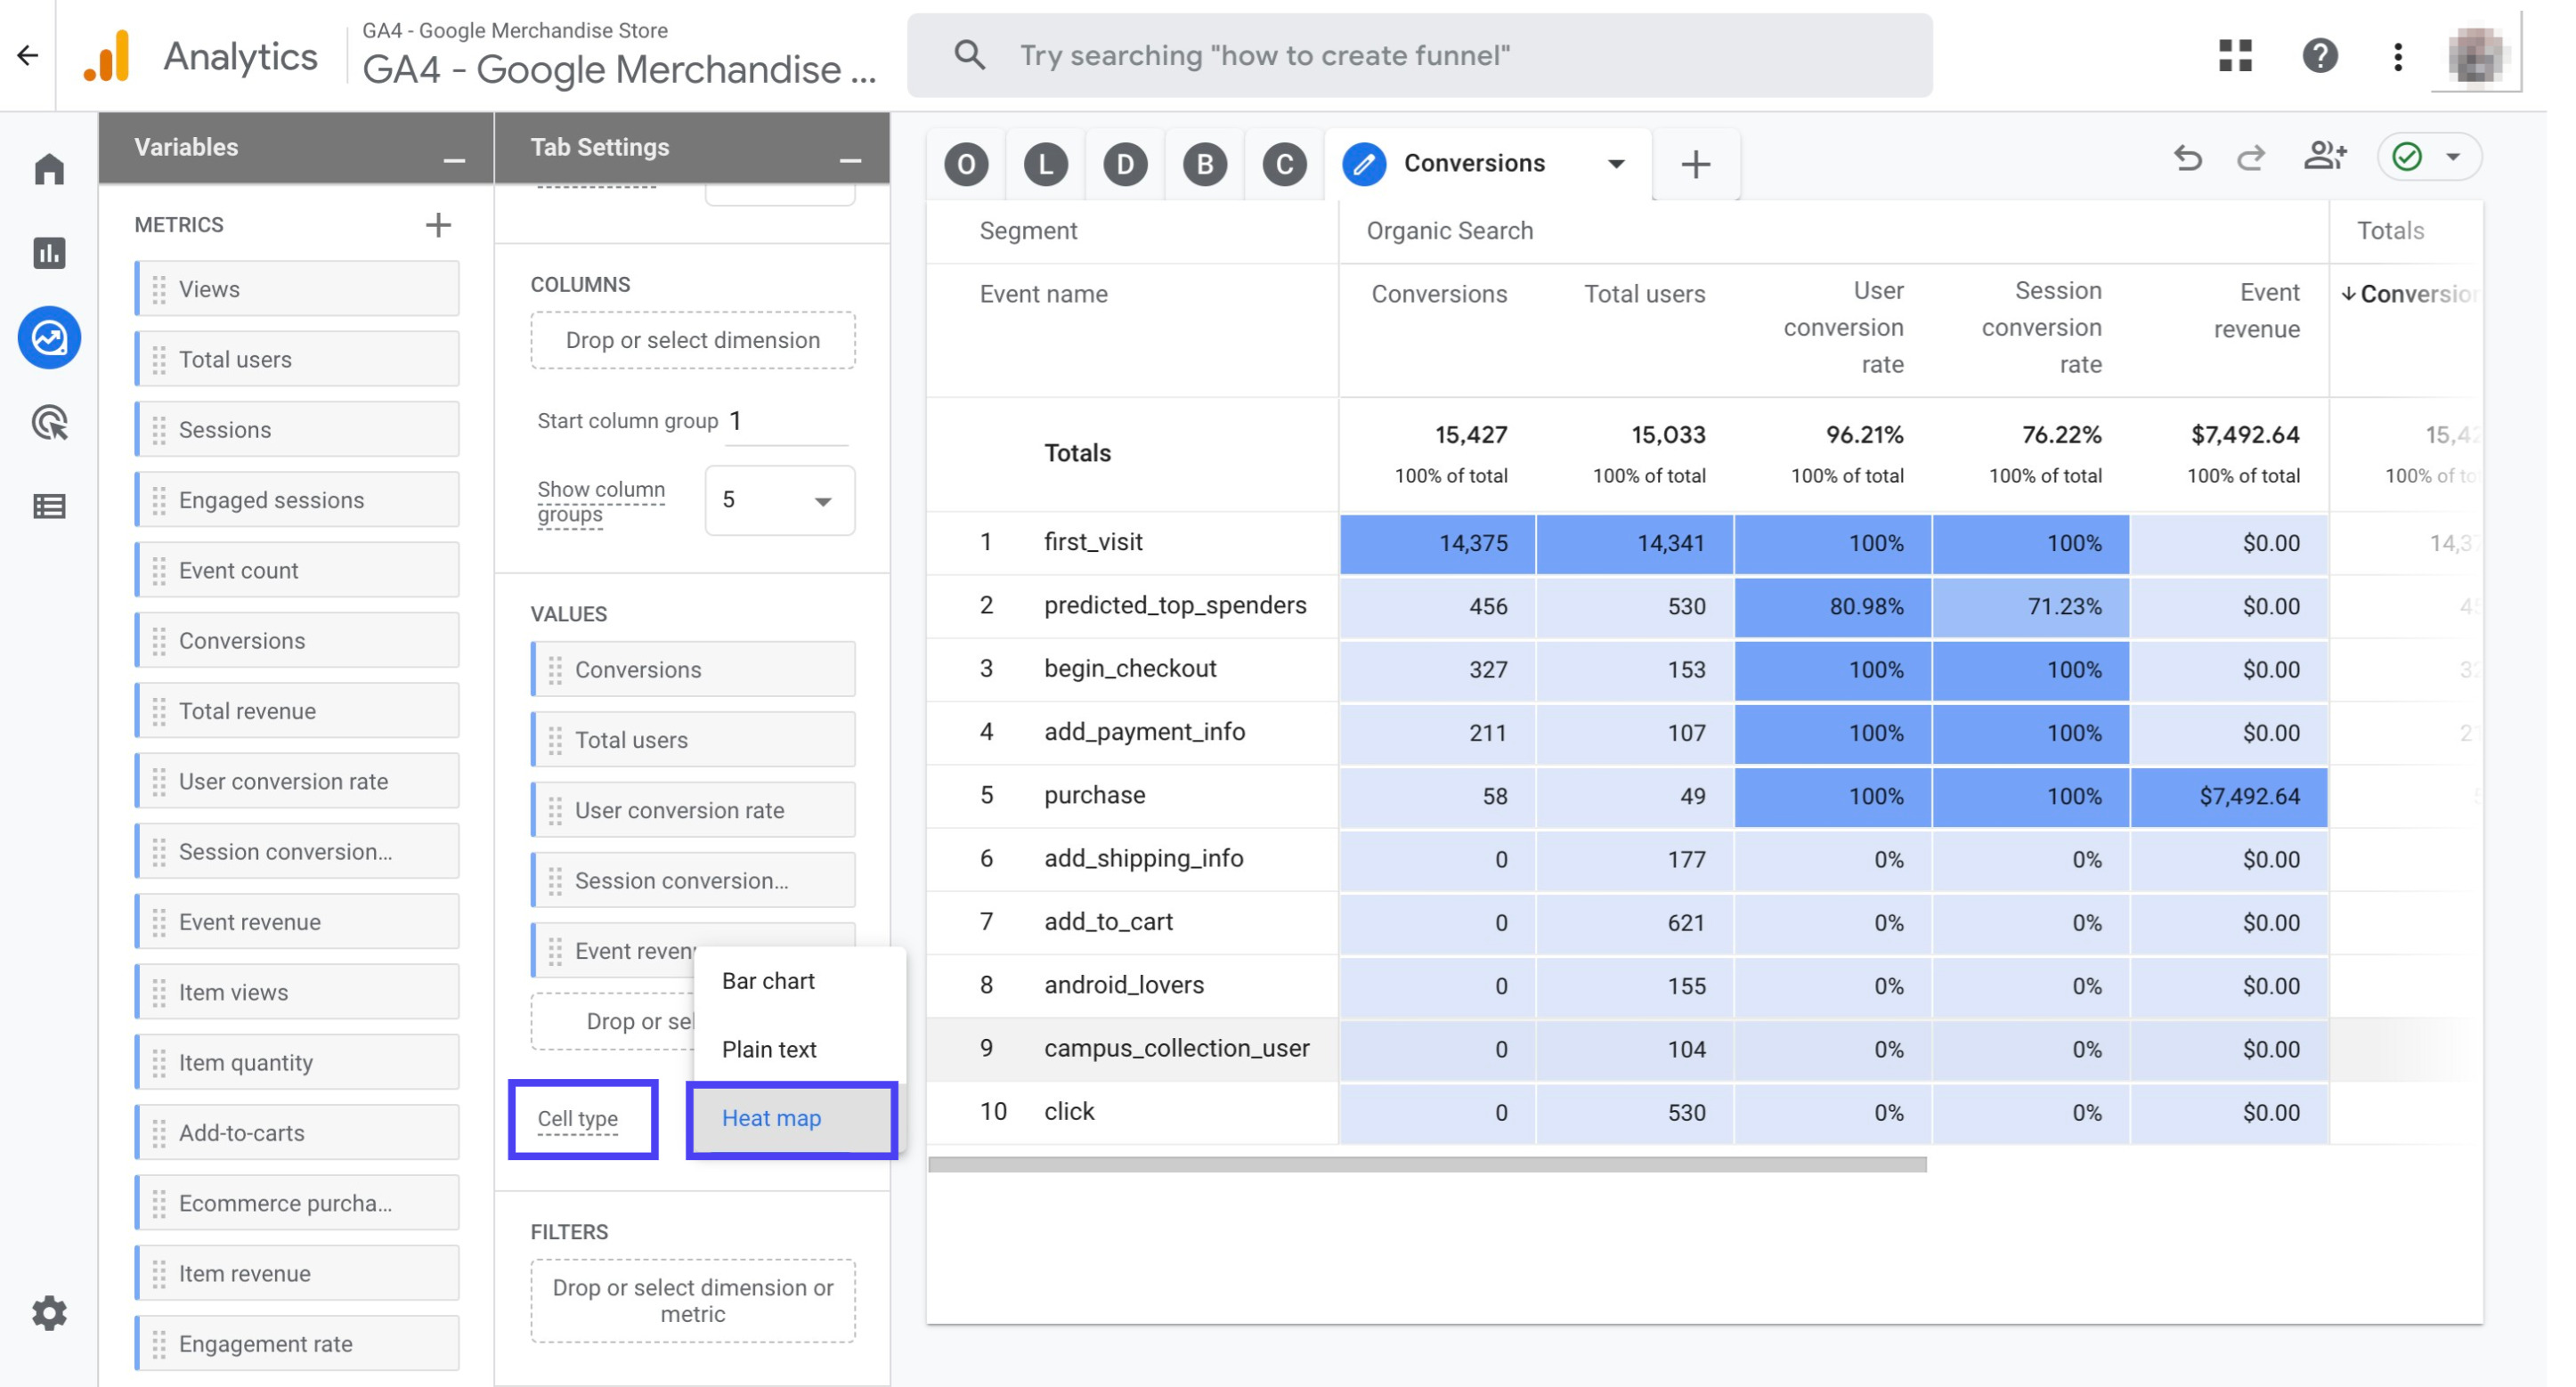
Double click on the metrics to add them to your report: 'Conversions', 'Total users', 'User conversion rate', 'Session conversion rate', 'Event revenue'
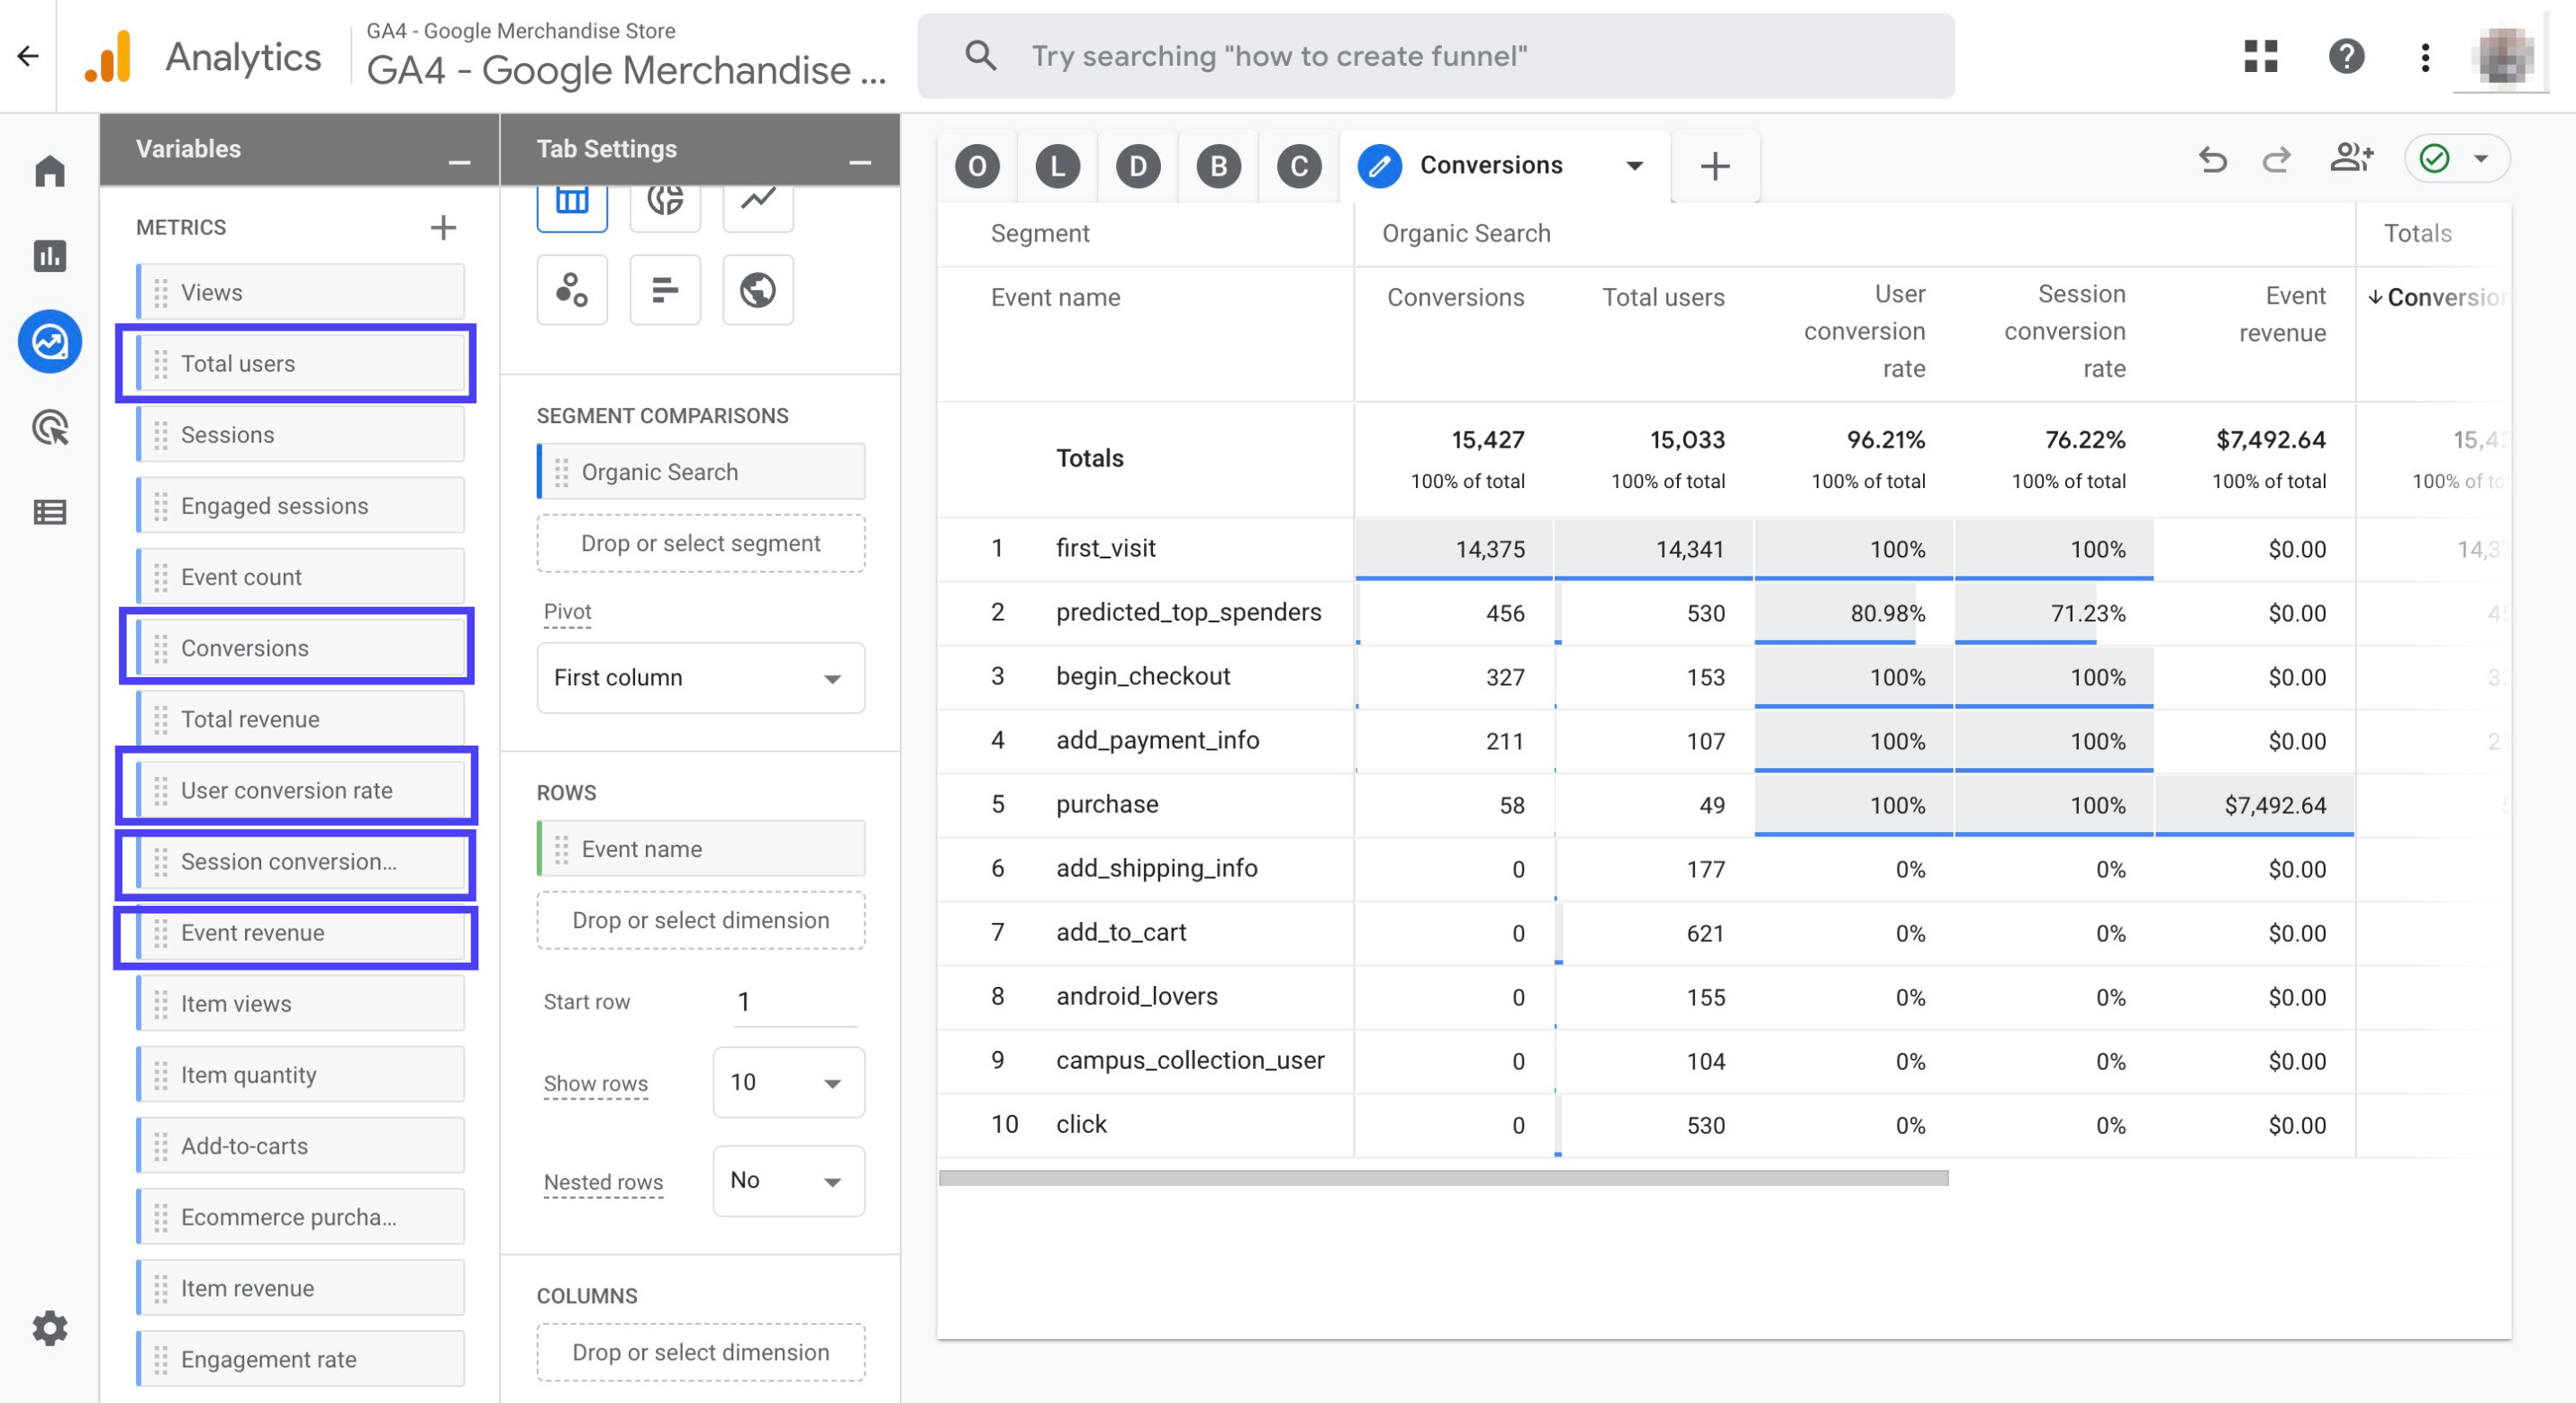
Scroll down to click 'Cell type'. Then, choose 'Heat map' from the drop down menu
Click the '+' sign right next to the 'Conversions' tab. Then, click on 'Free form'
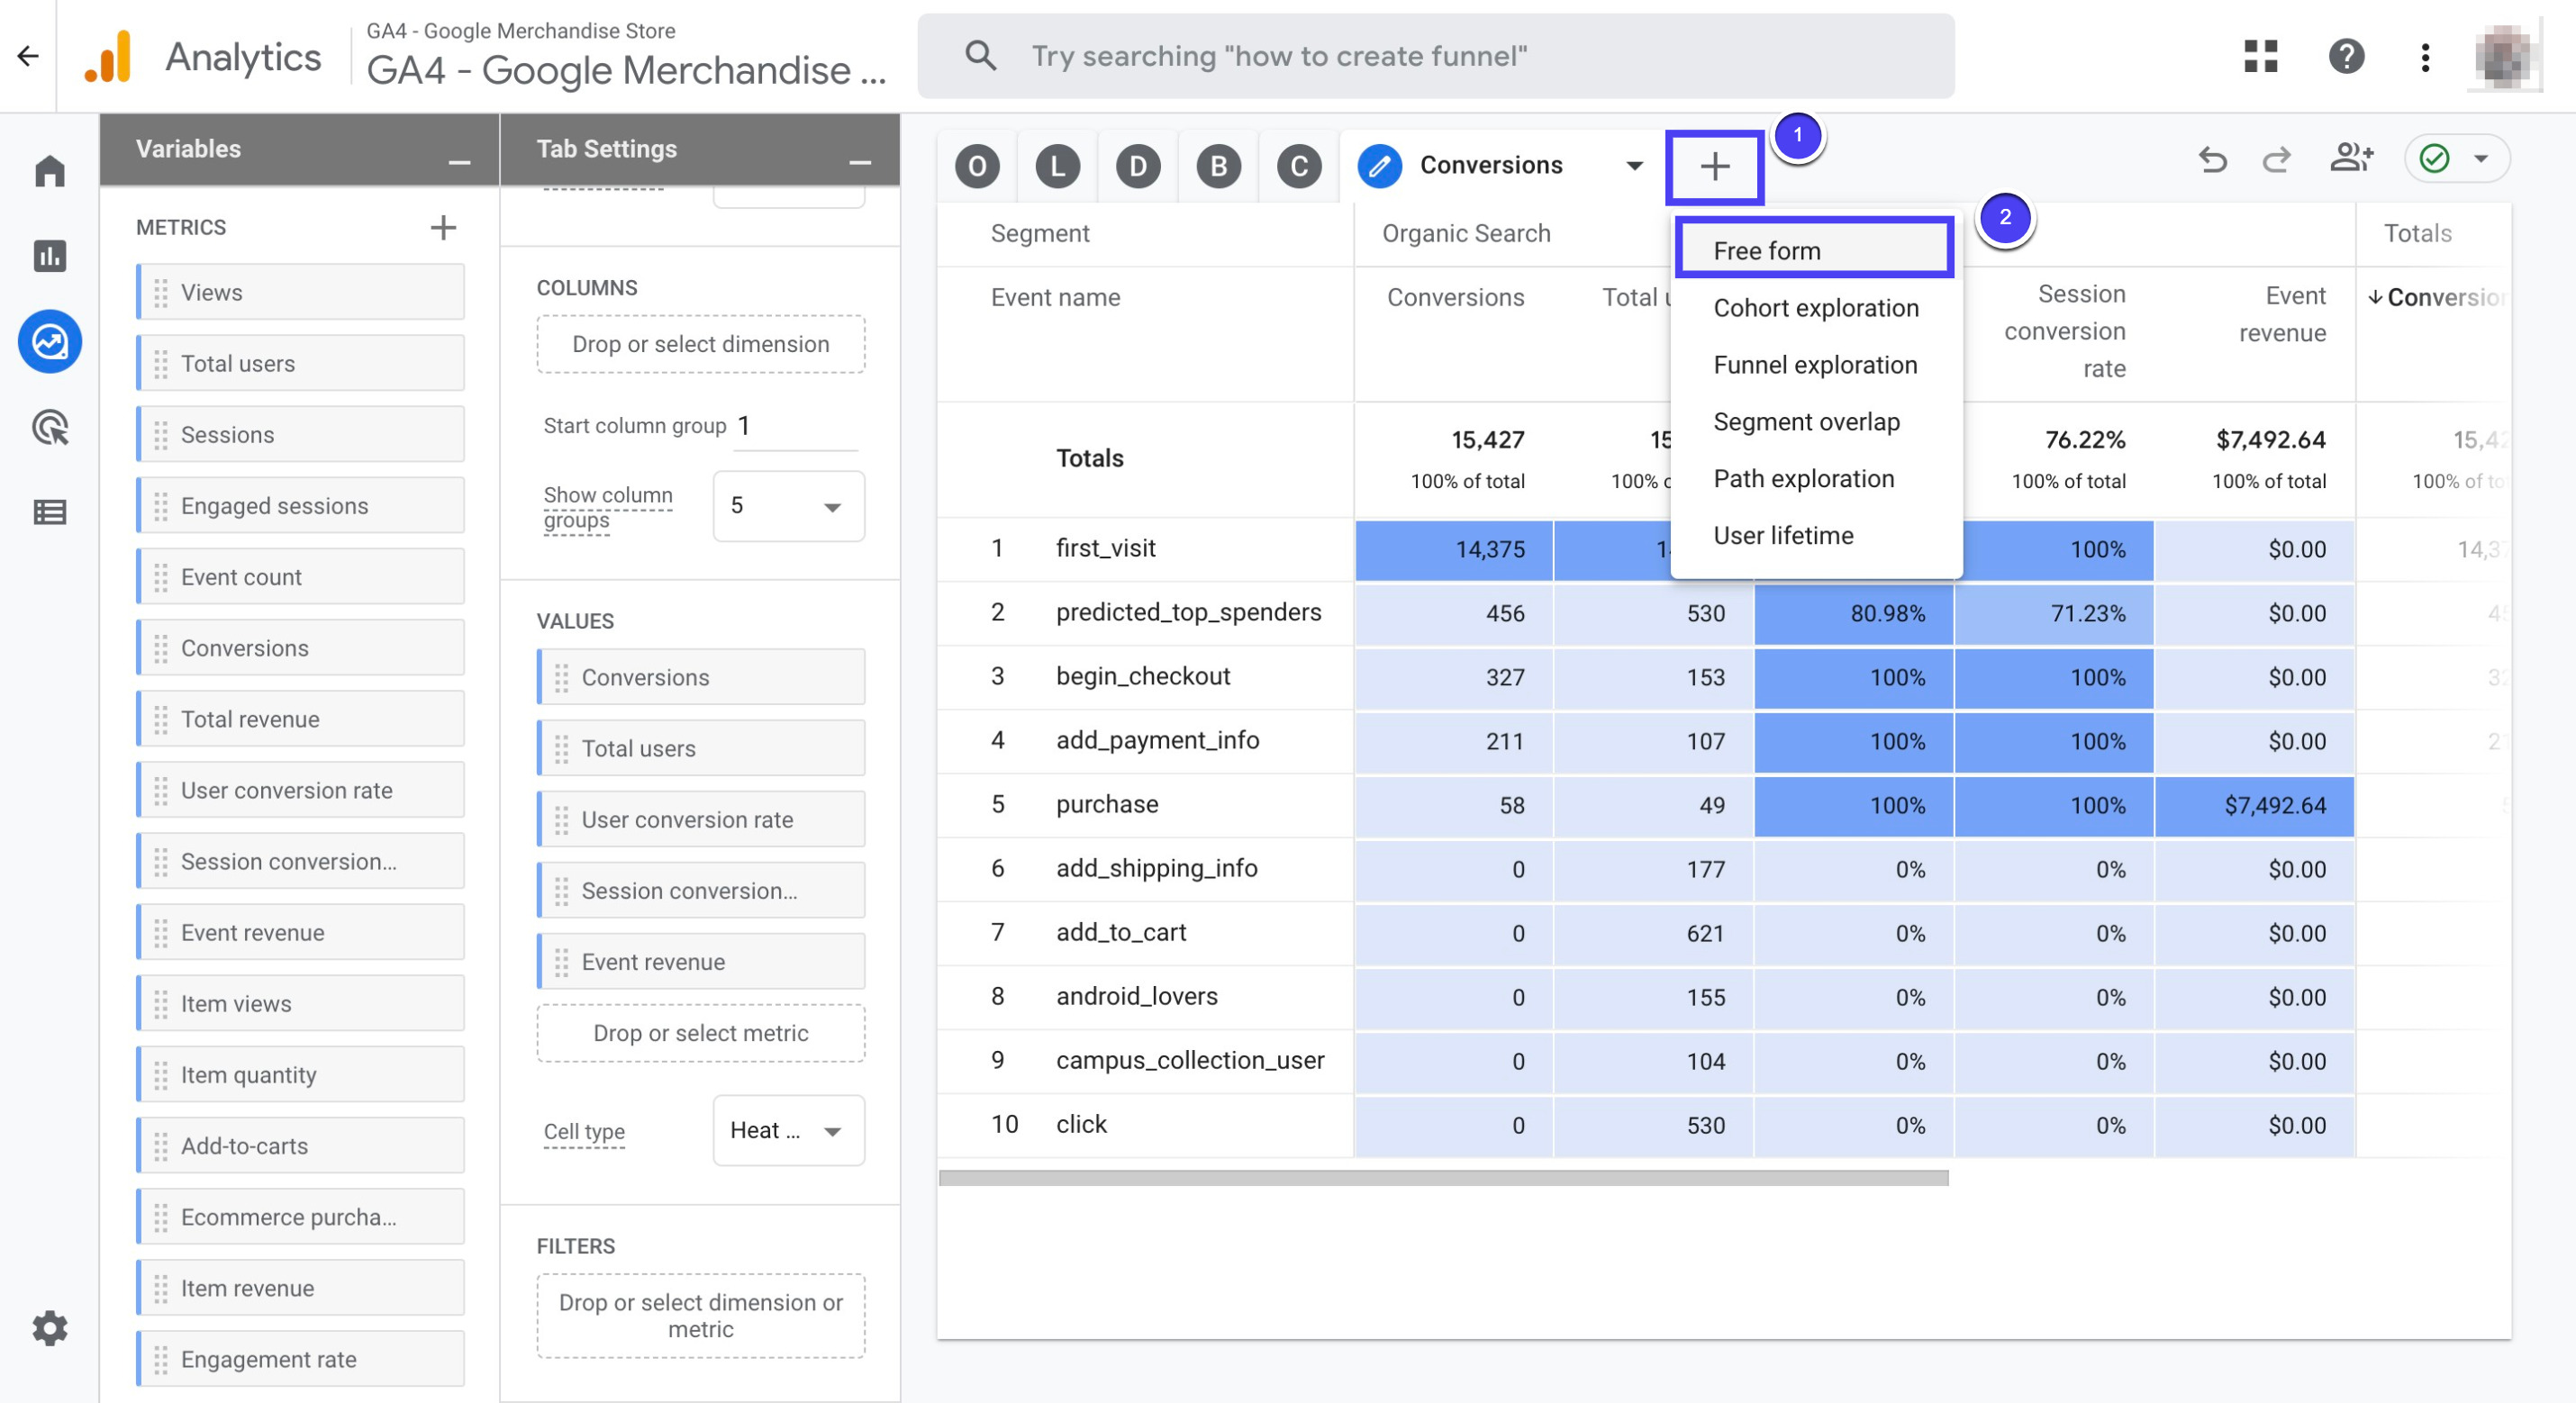
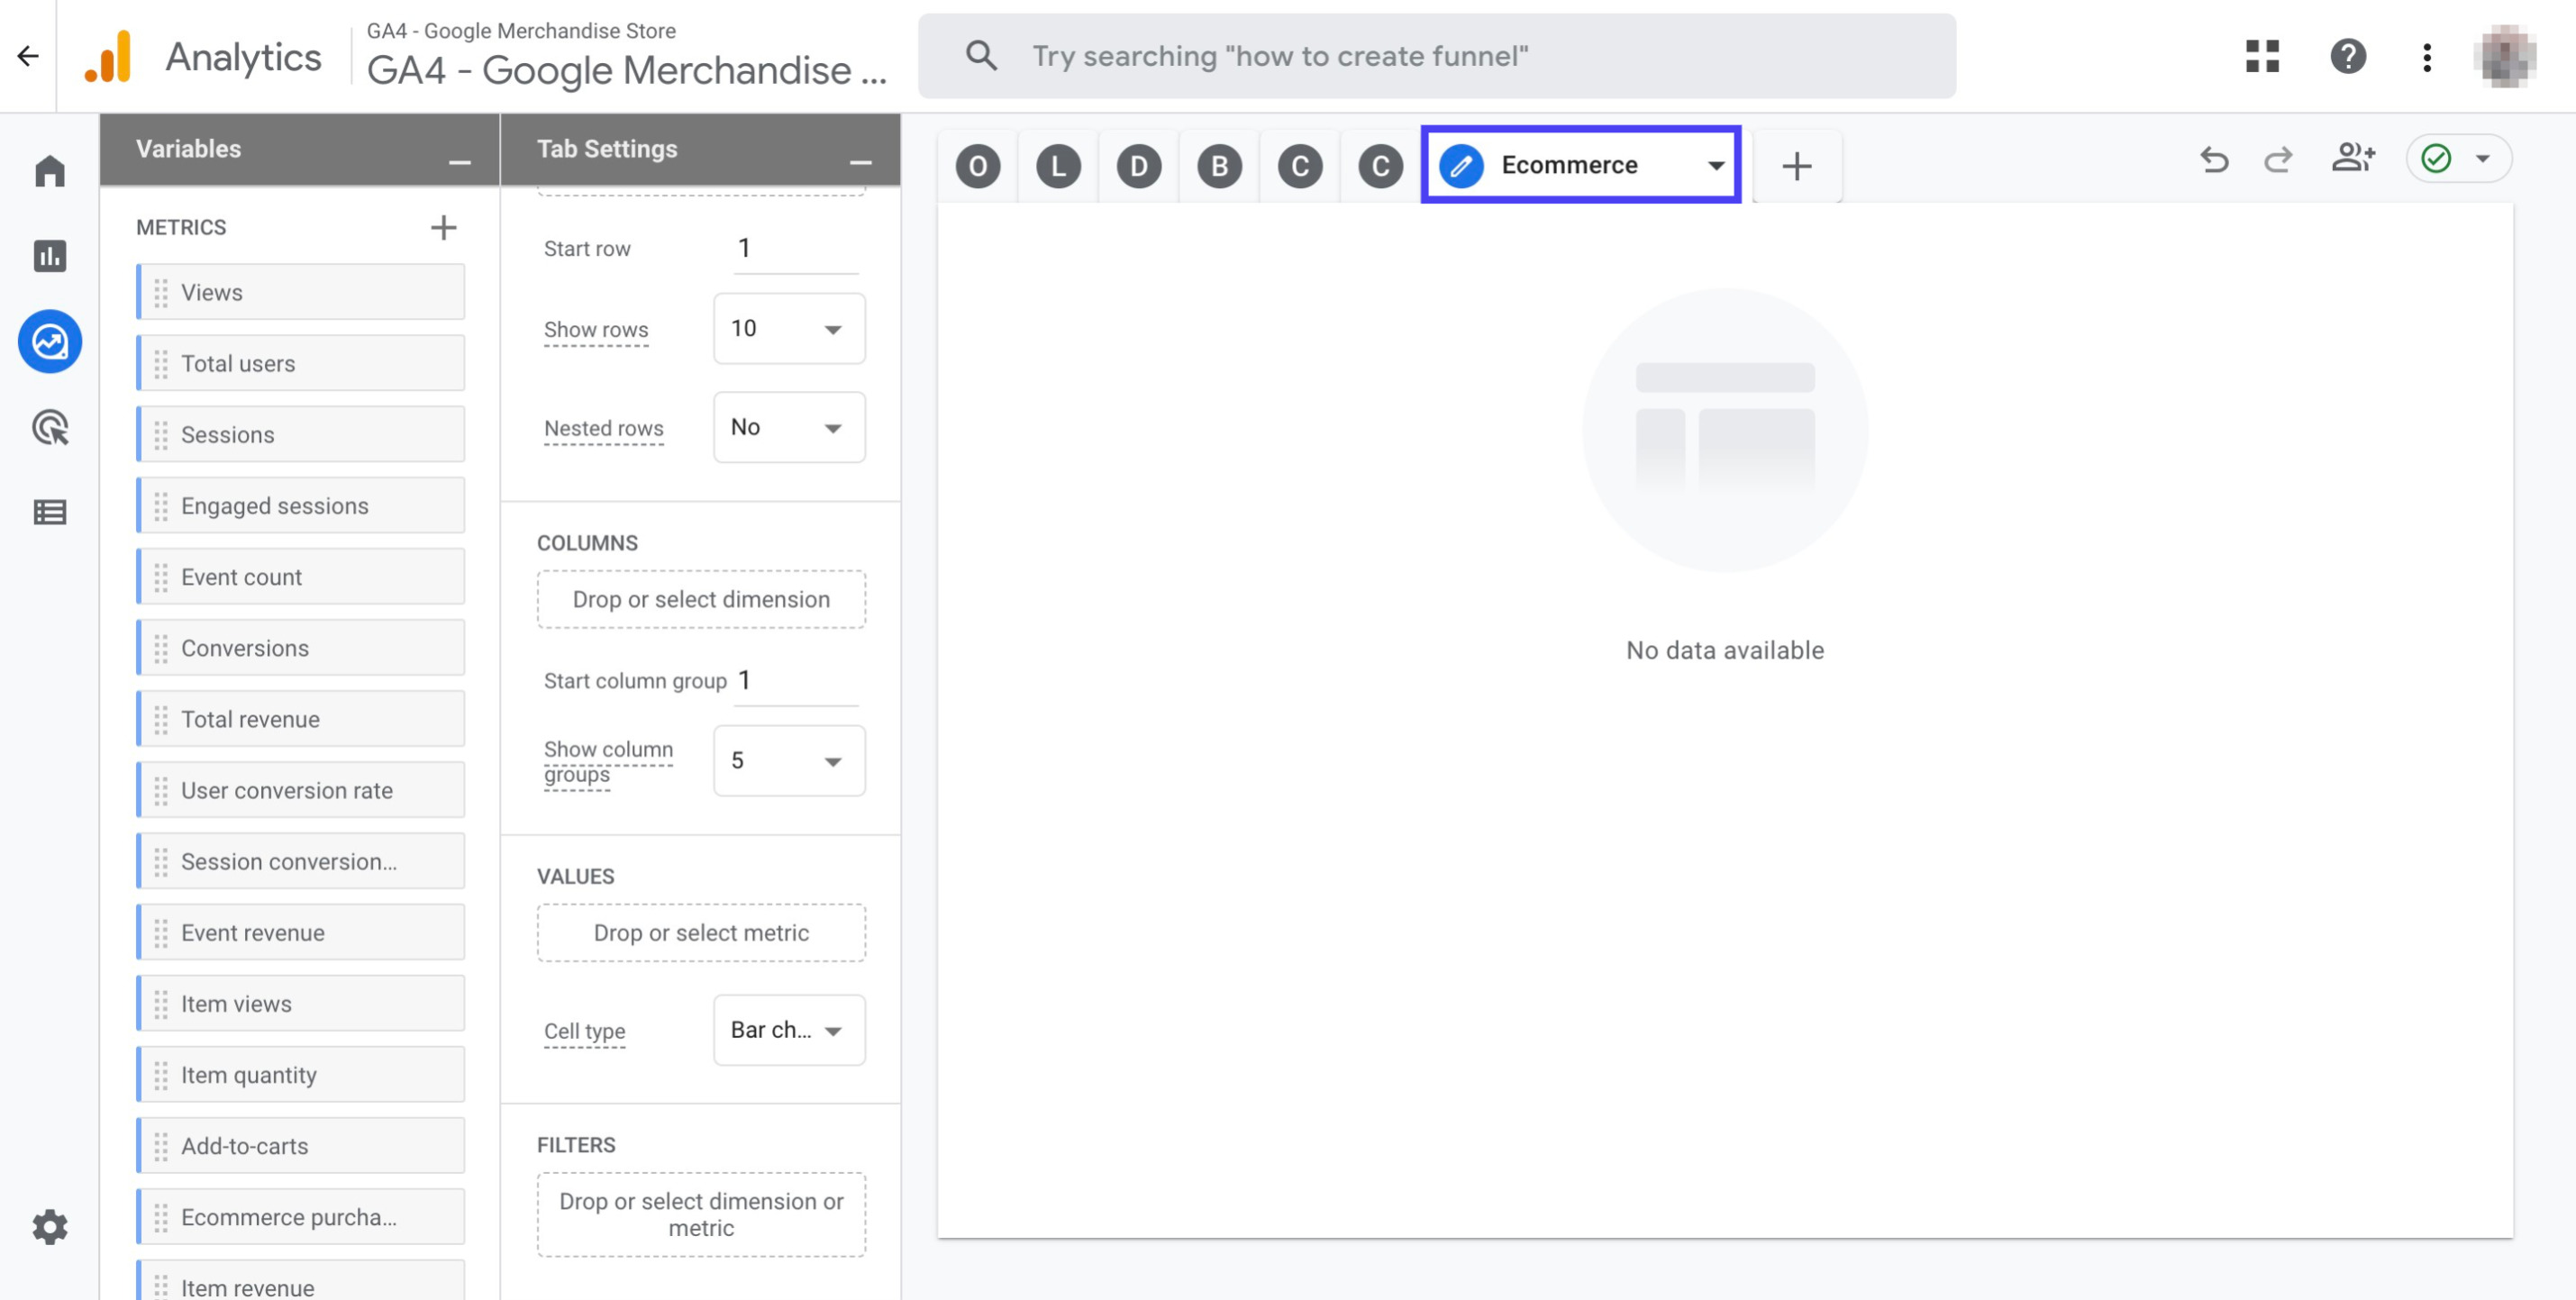
Name the new tab as 'Ecommerce'
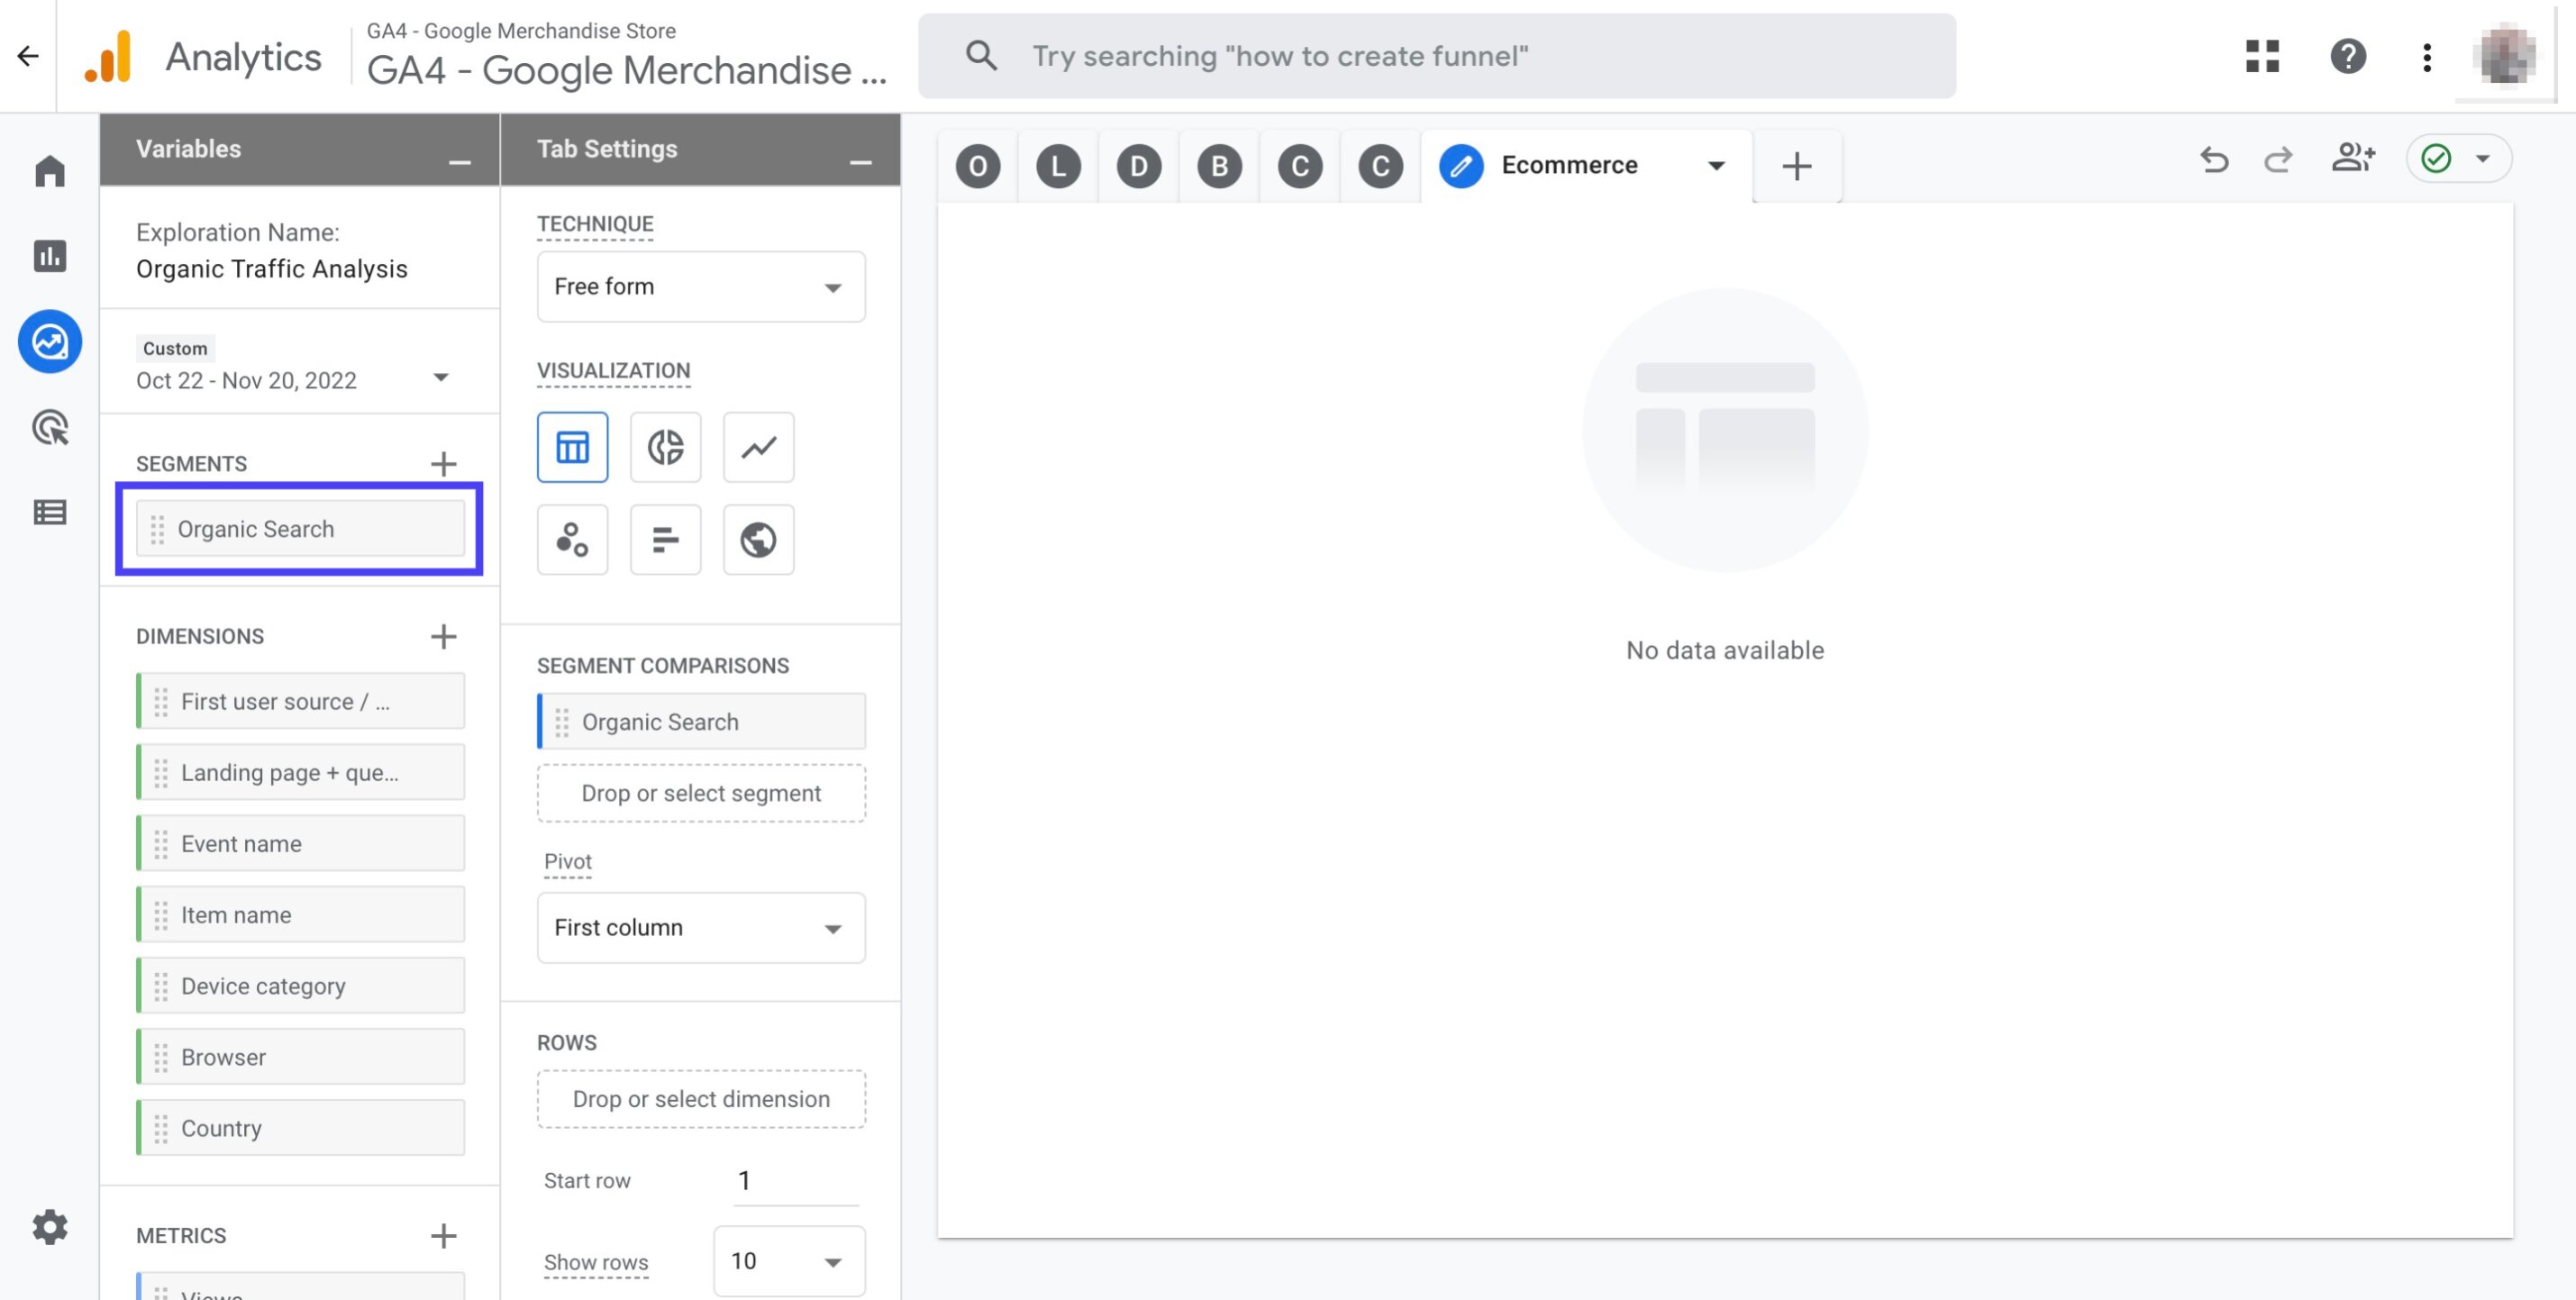
Double click the 'Organic search' segment to add it to your report
Double click the dimension 'Item name' to add it to your report
Double click the metrics to add them to your reports: 'Item views', 'Item quantity', 'Add-to-carts', 'Ecommerce purchases', 'Item revenue'
Scroll down to click 'Cell type'. Then, choose 'Heat map' from the drop down menu
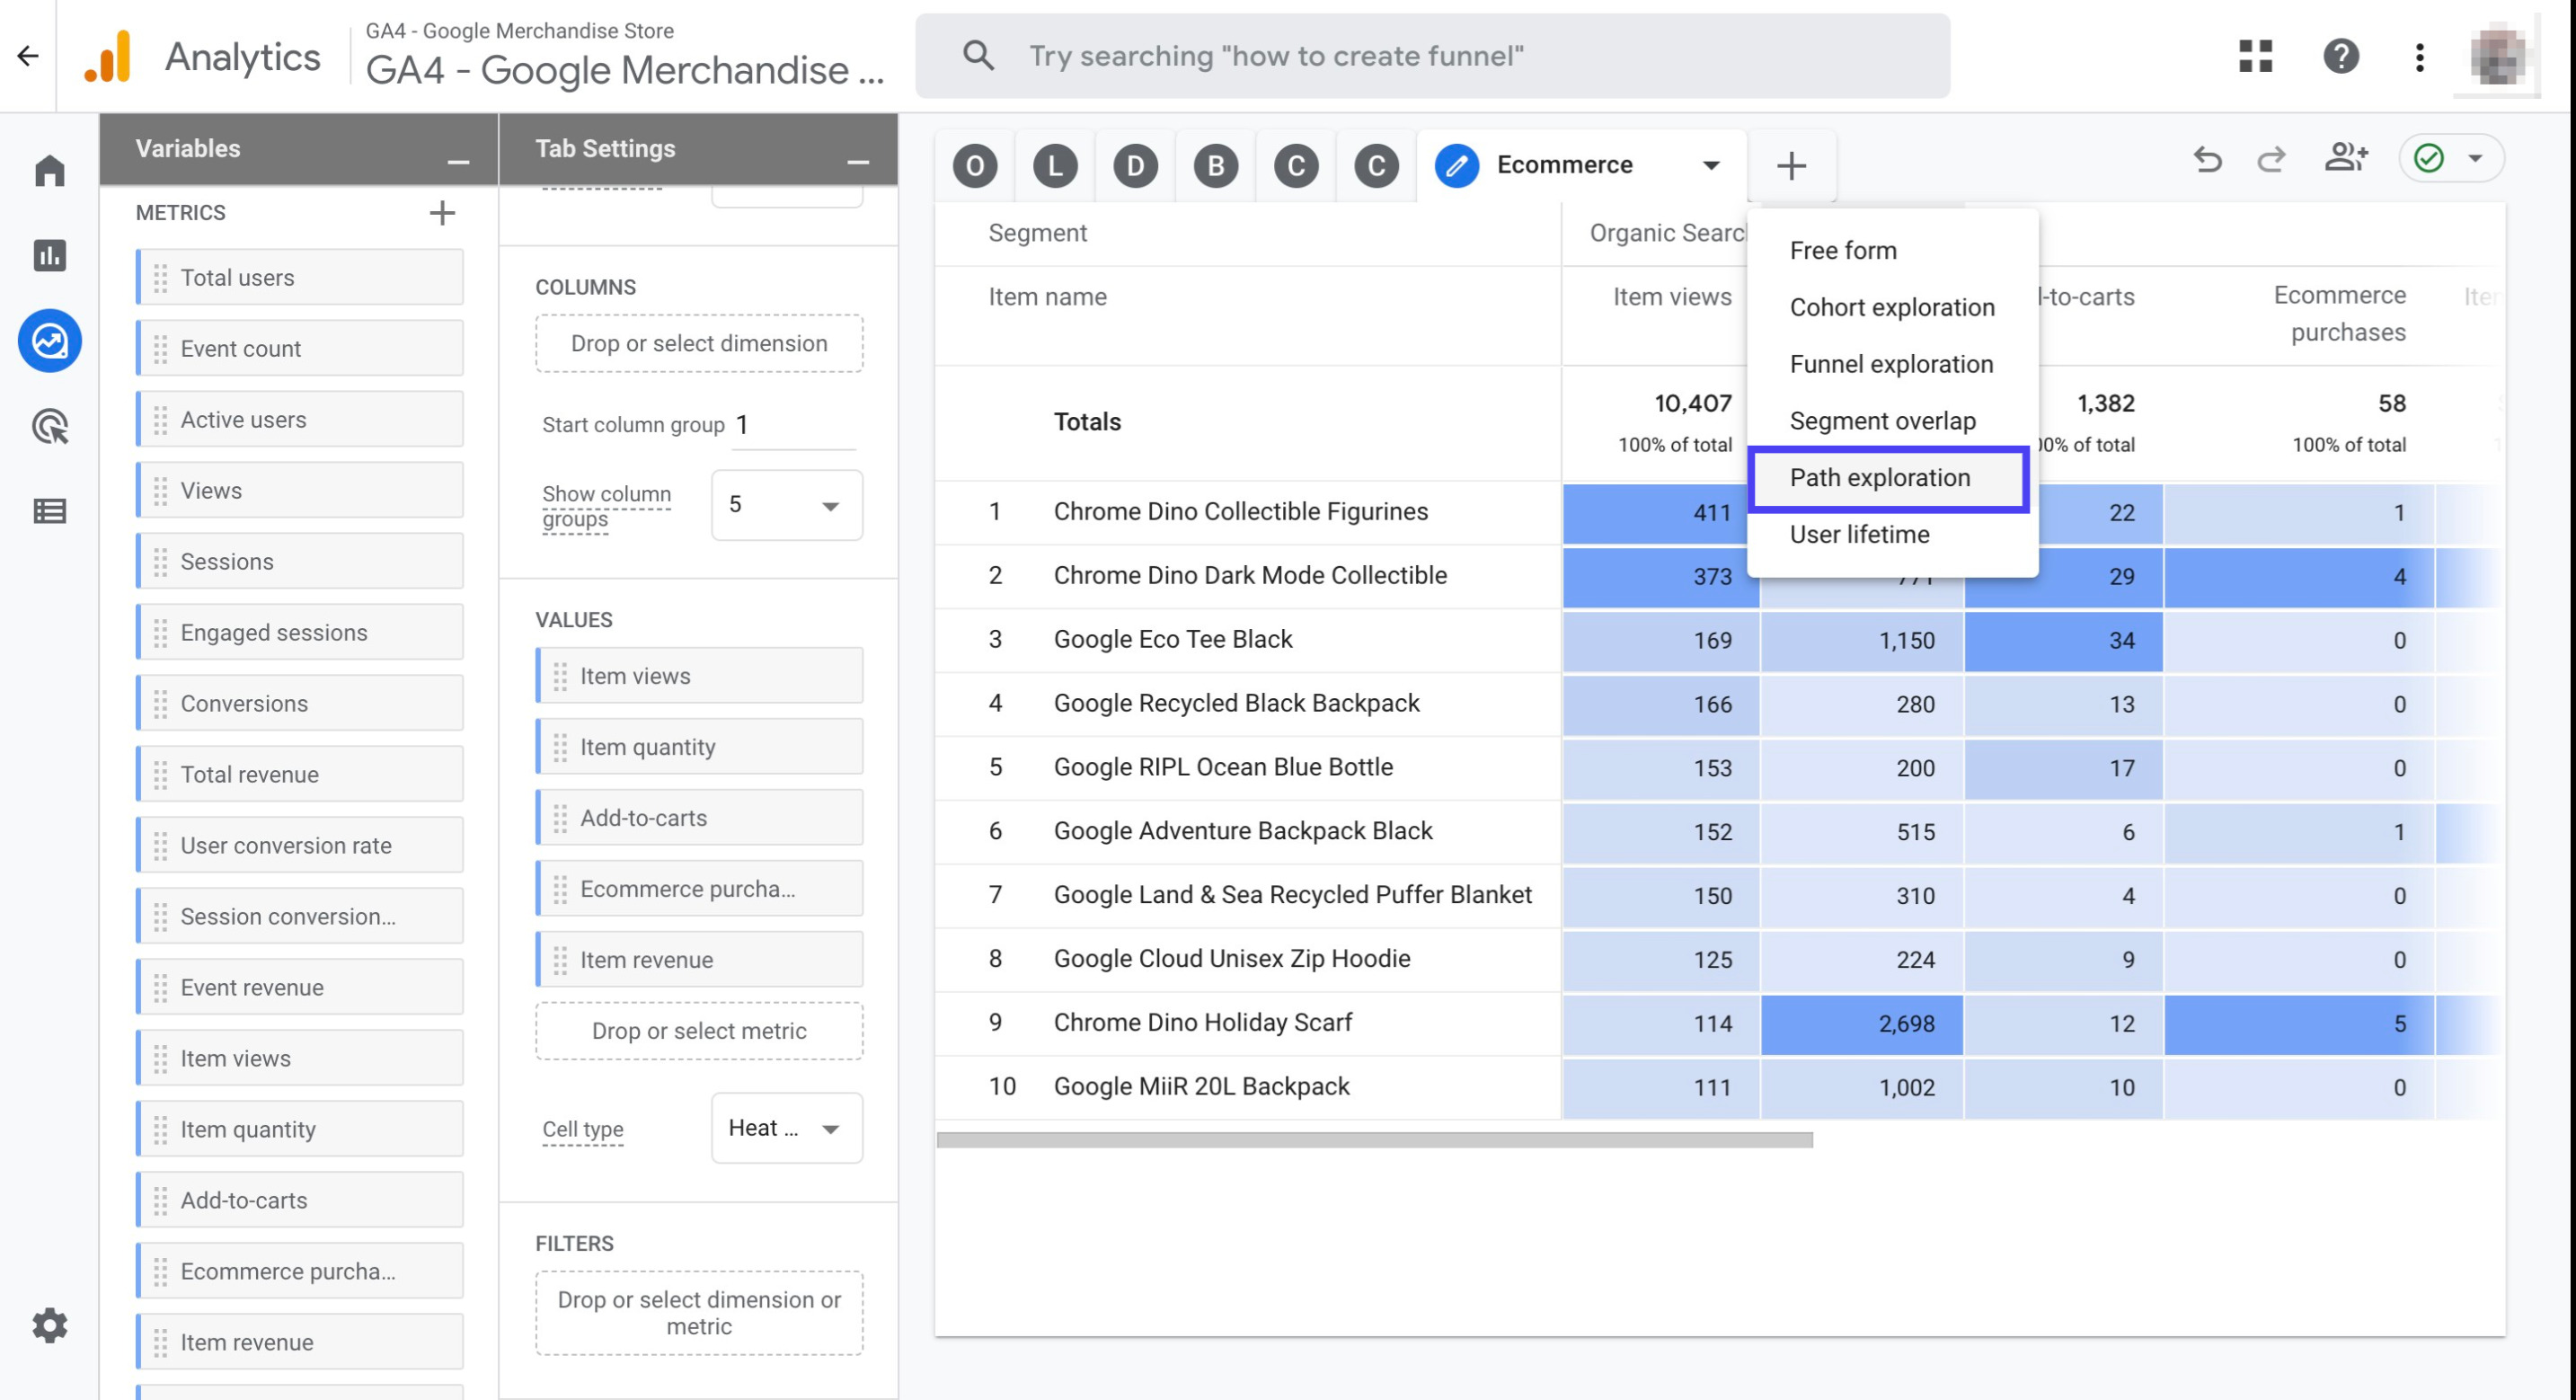
Click the '+' sign right next to the 'Ecommerce' tab. Then, click on 'Path Exploration'
Name the new tab as 'User Flow'
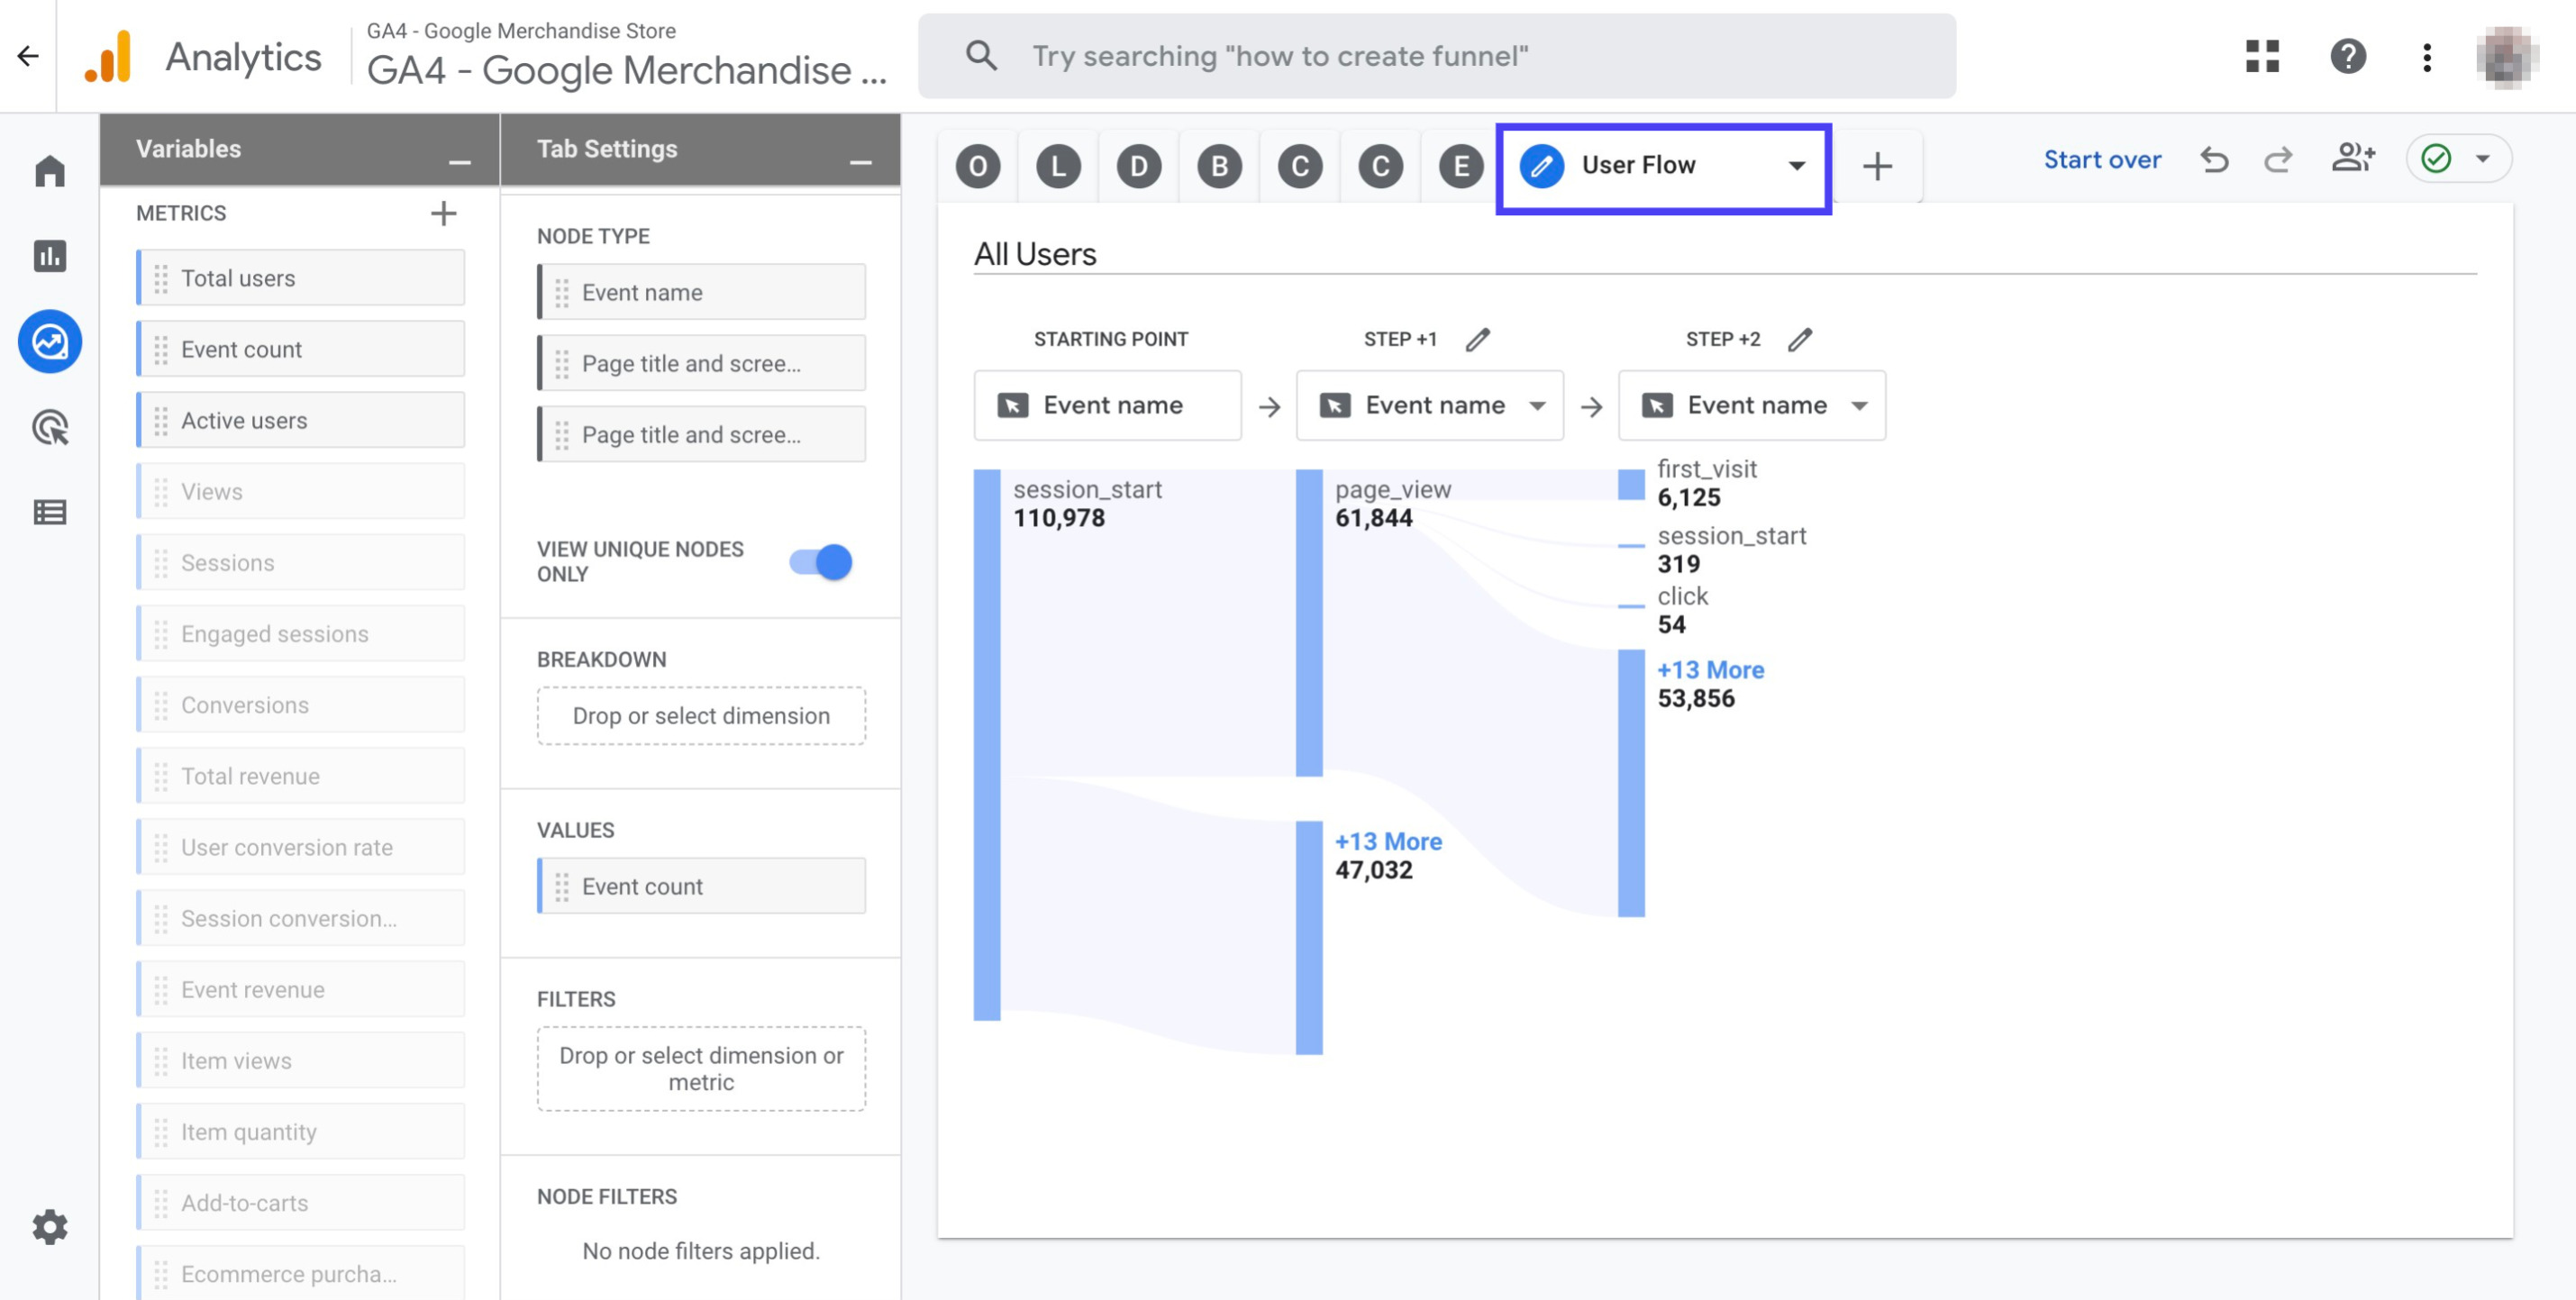
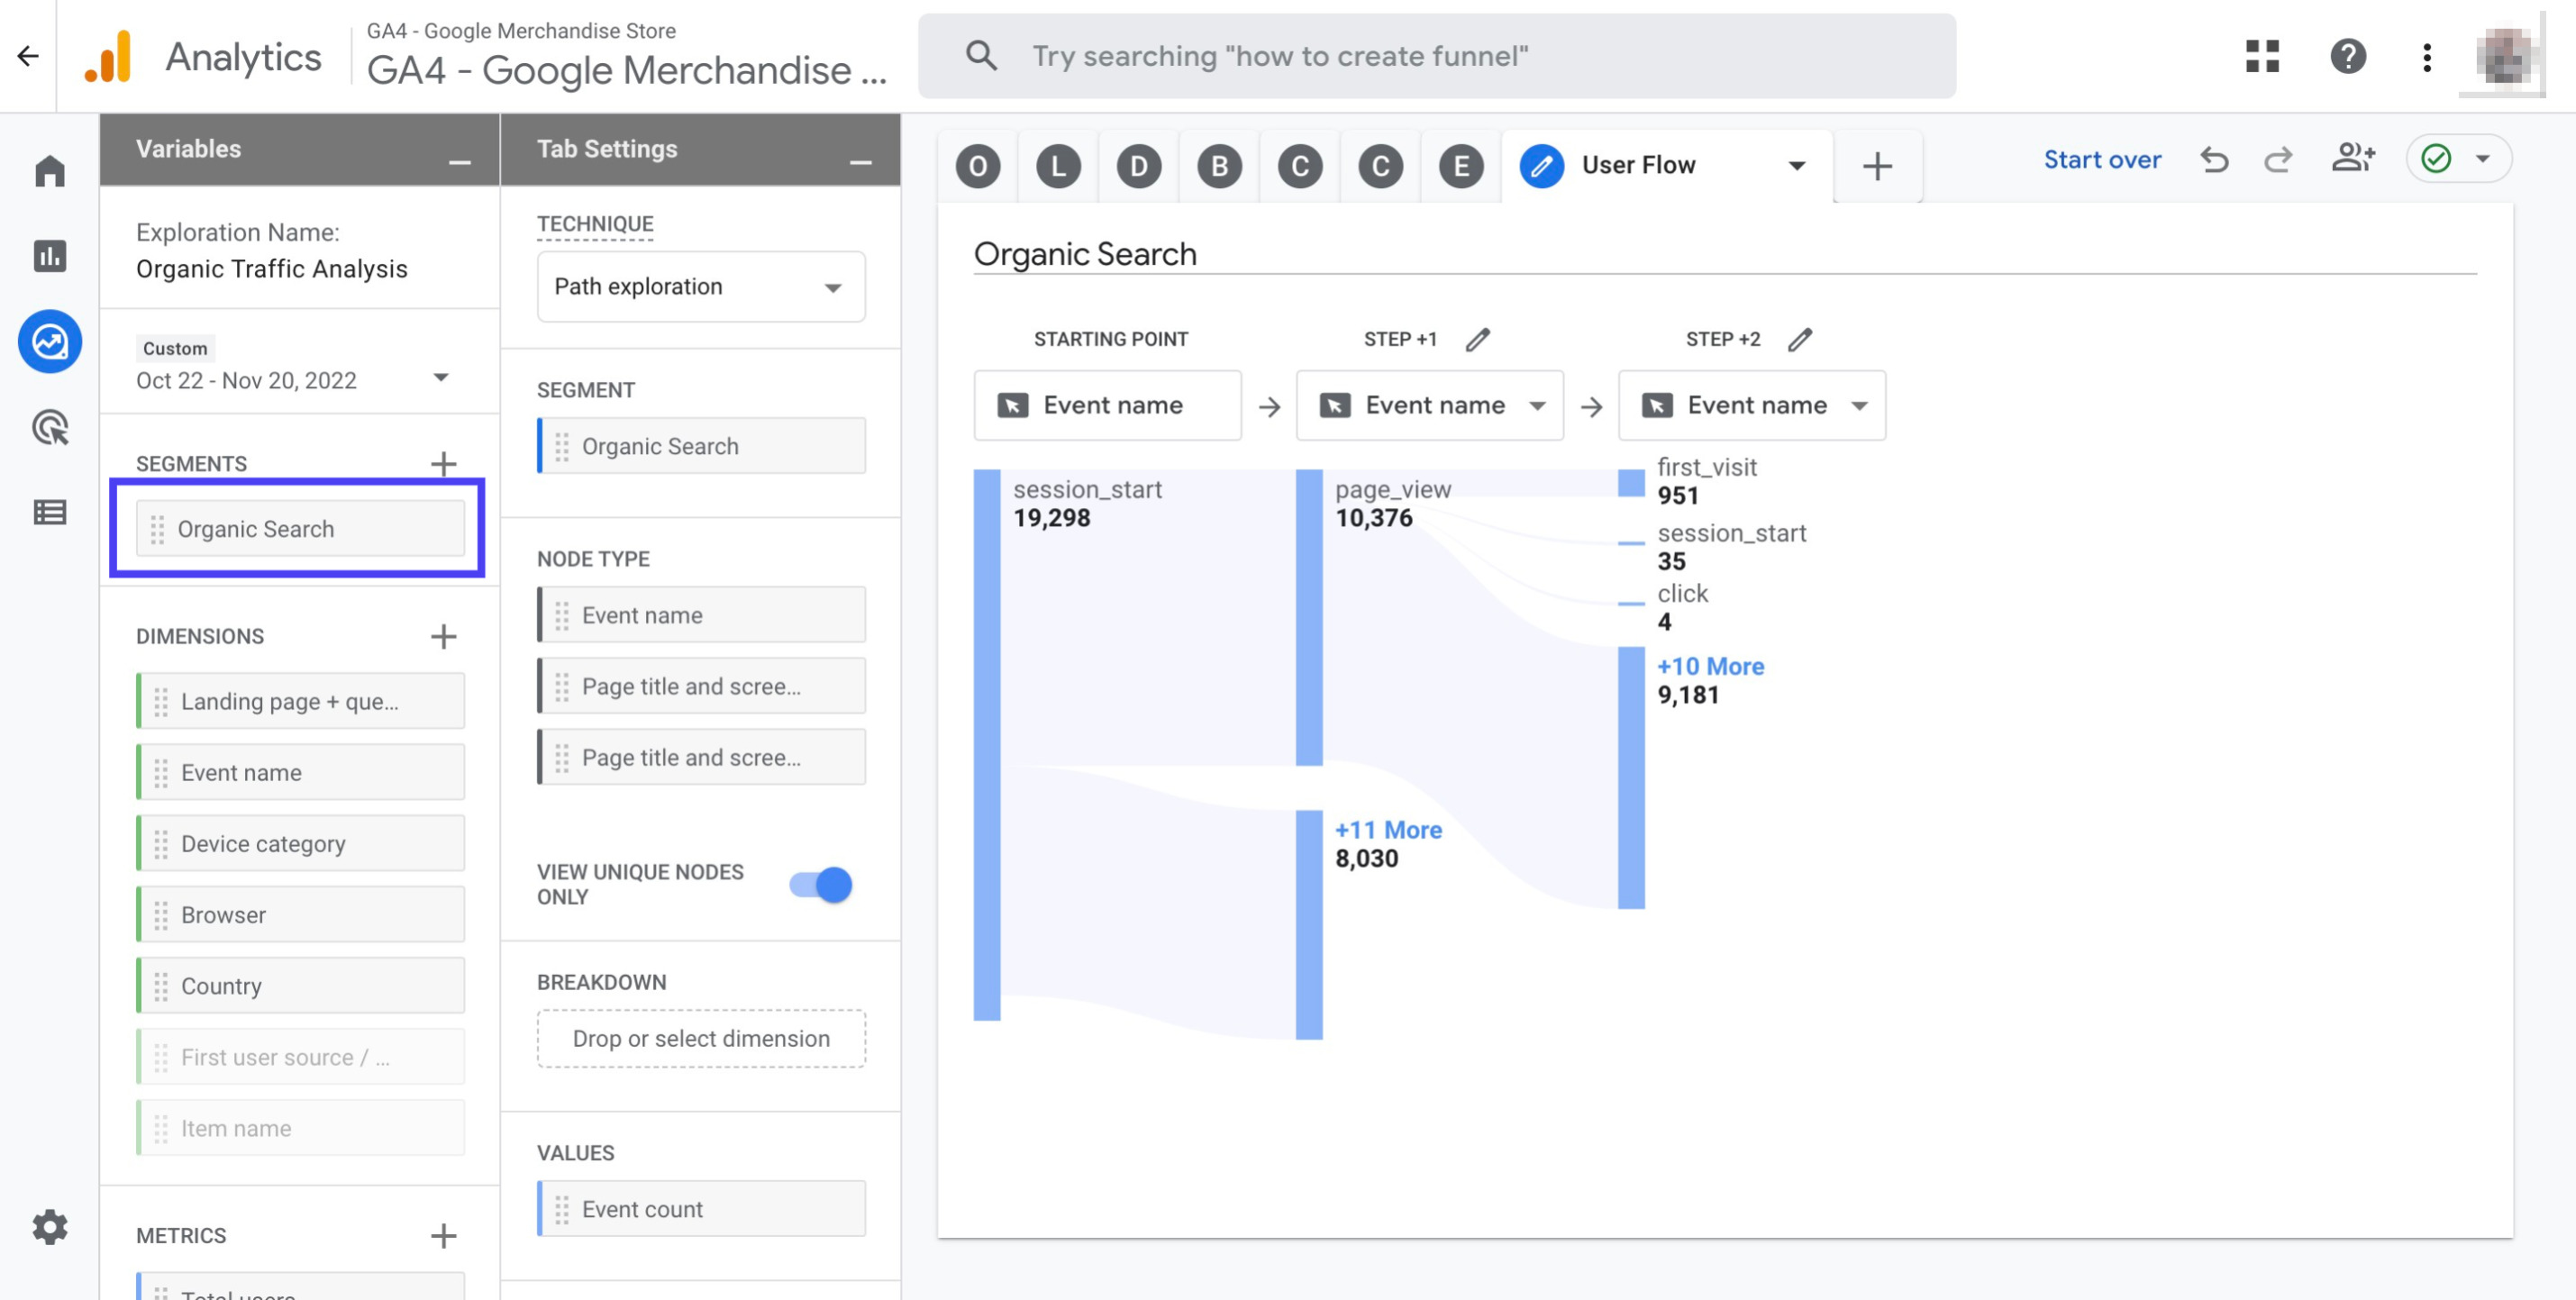
Double click the 'Organic search' segment to add it to your report
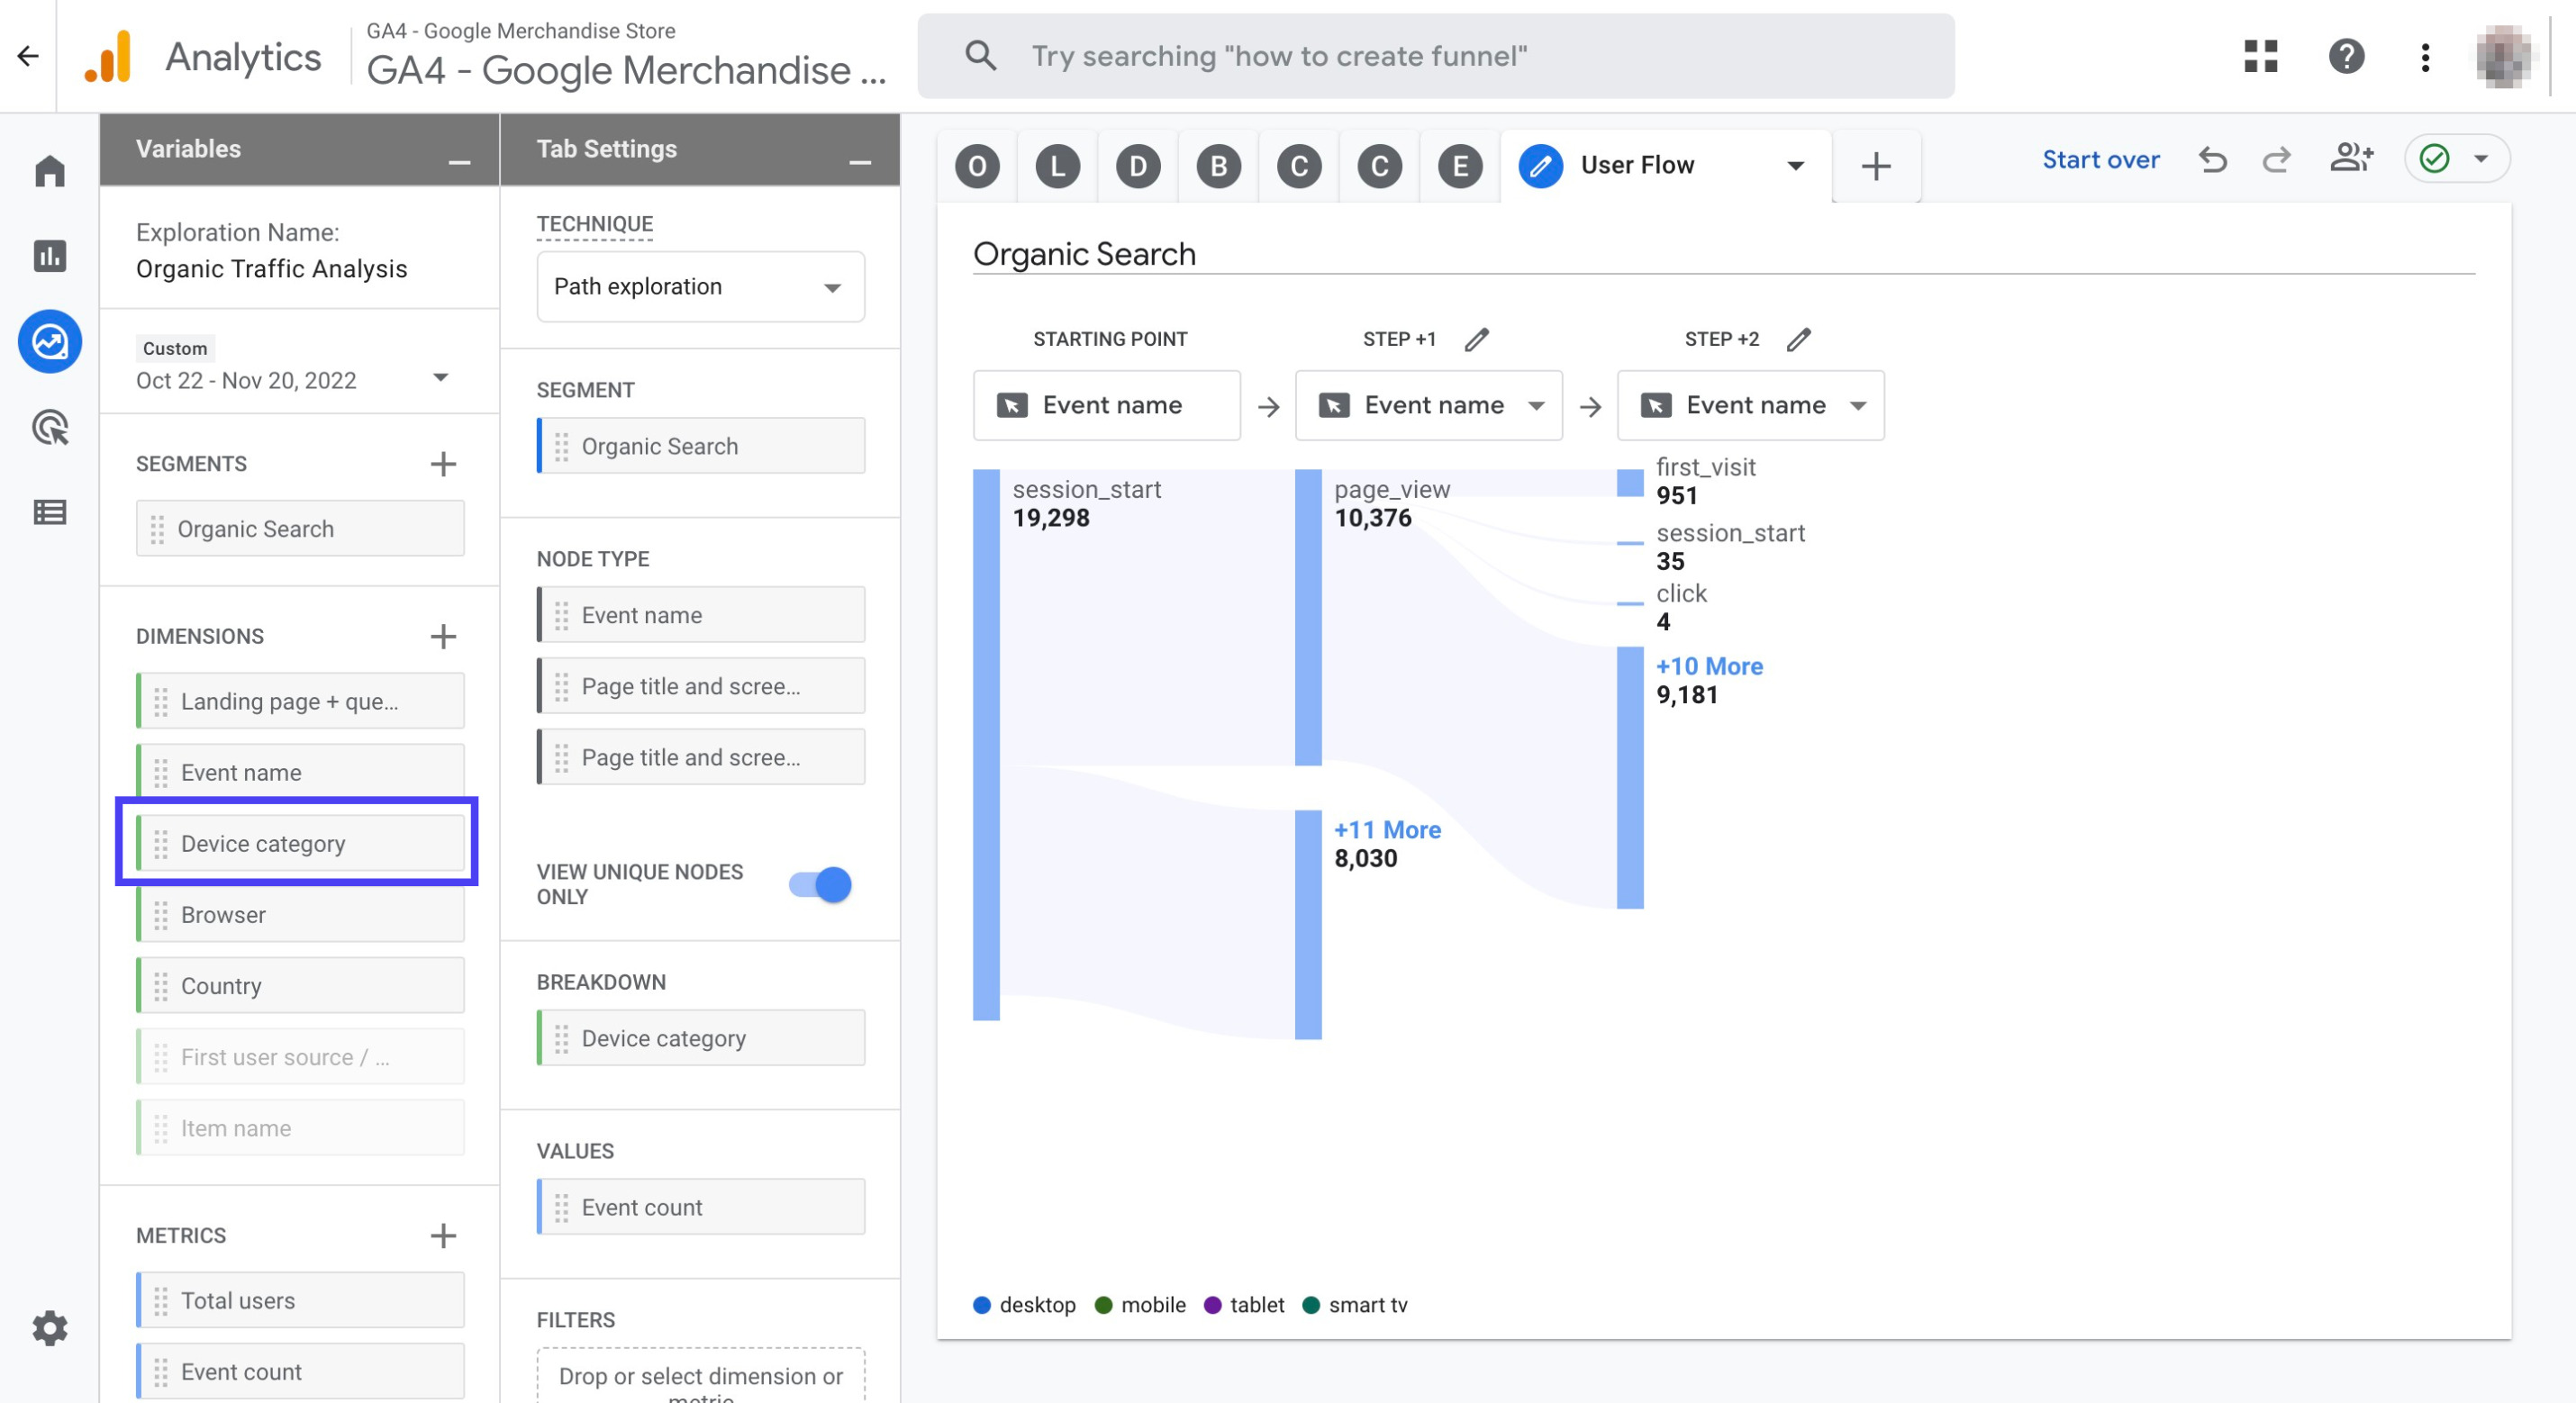
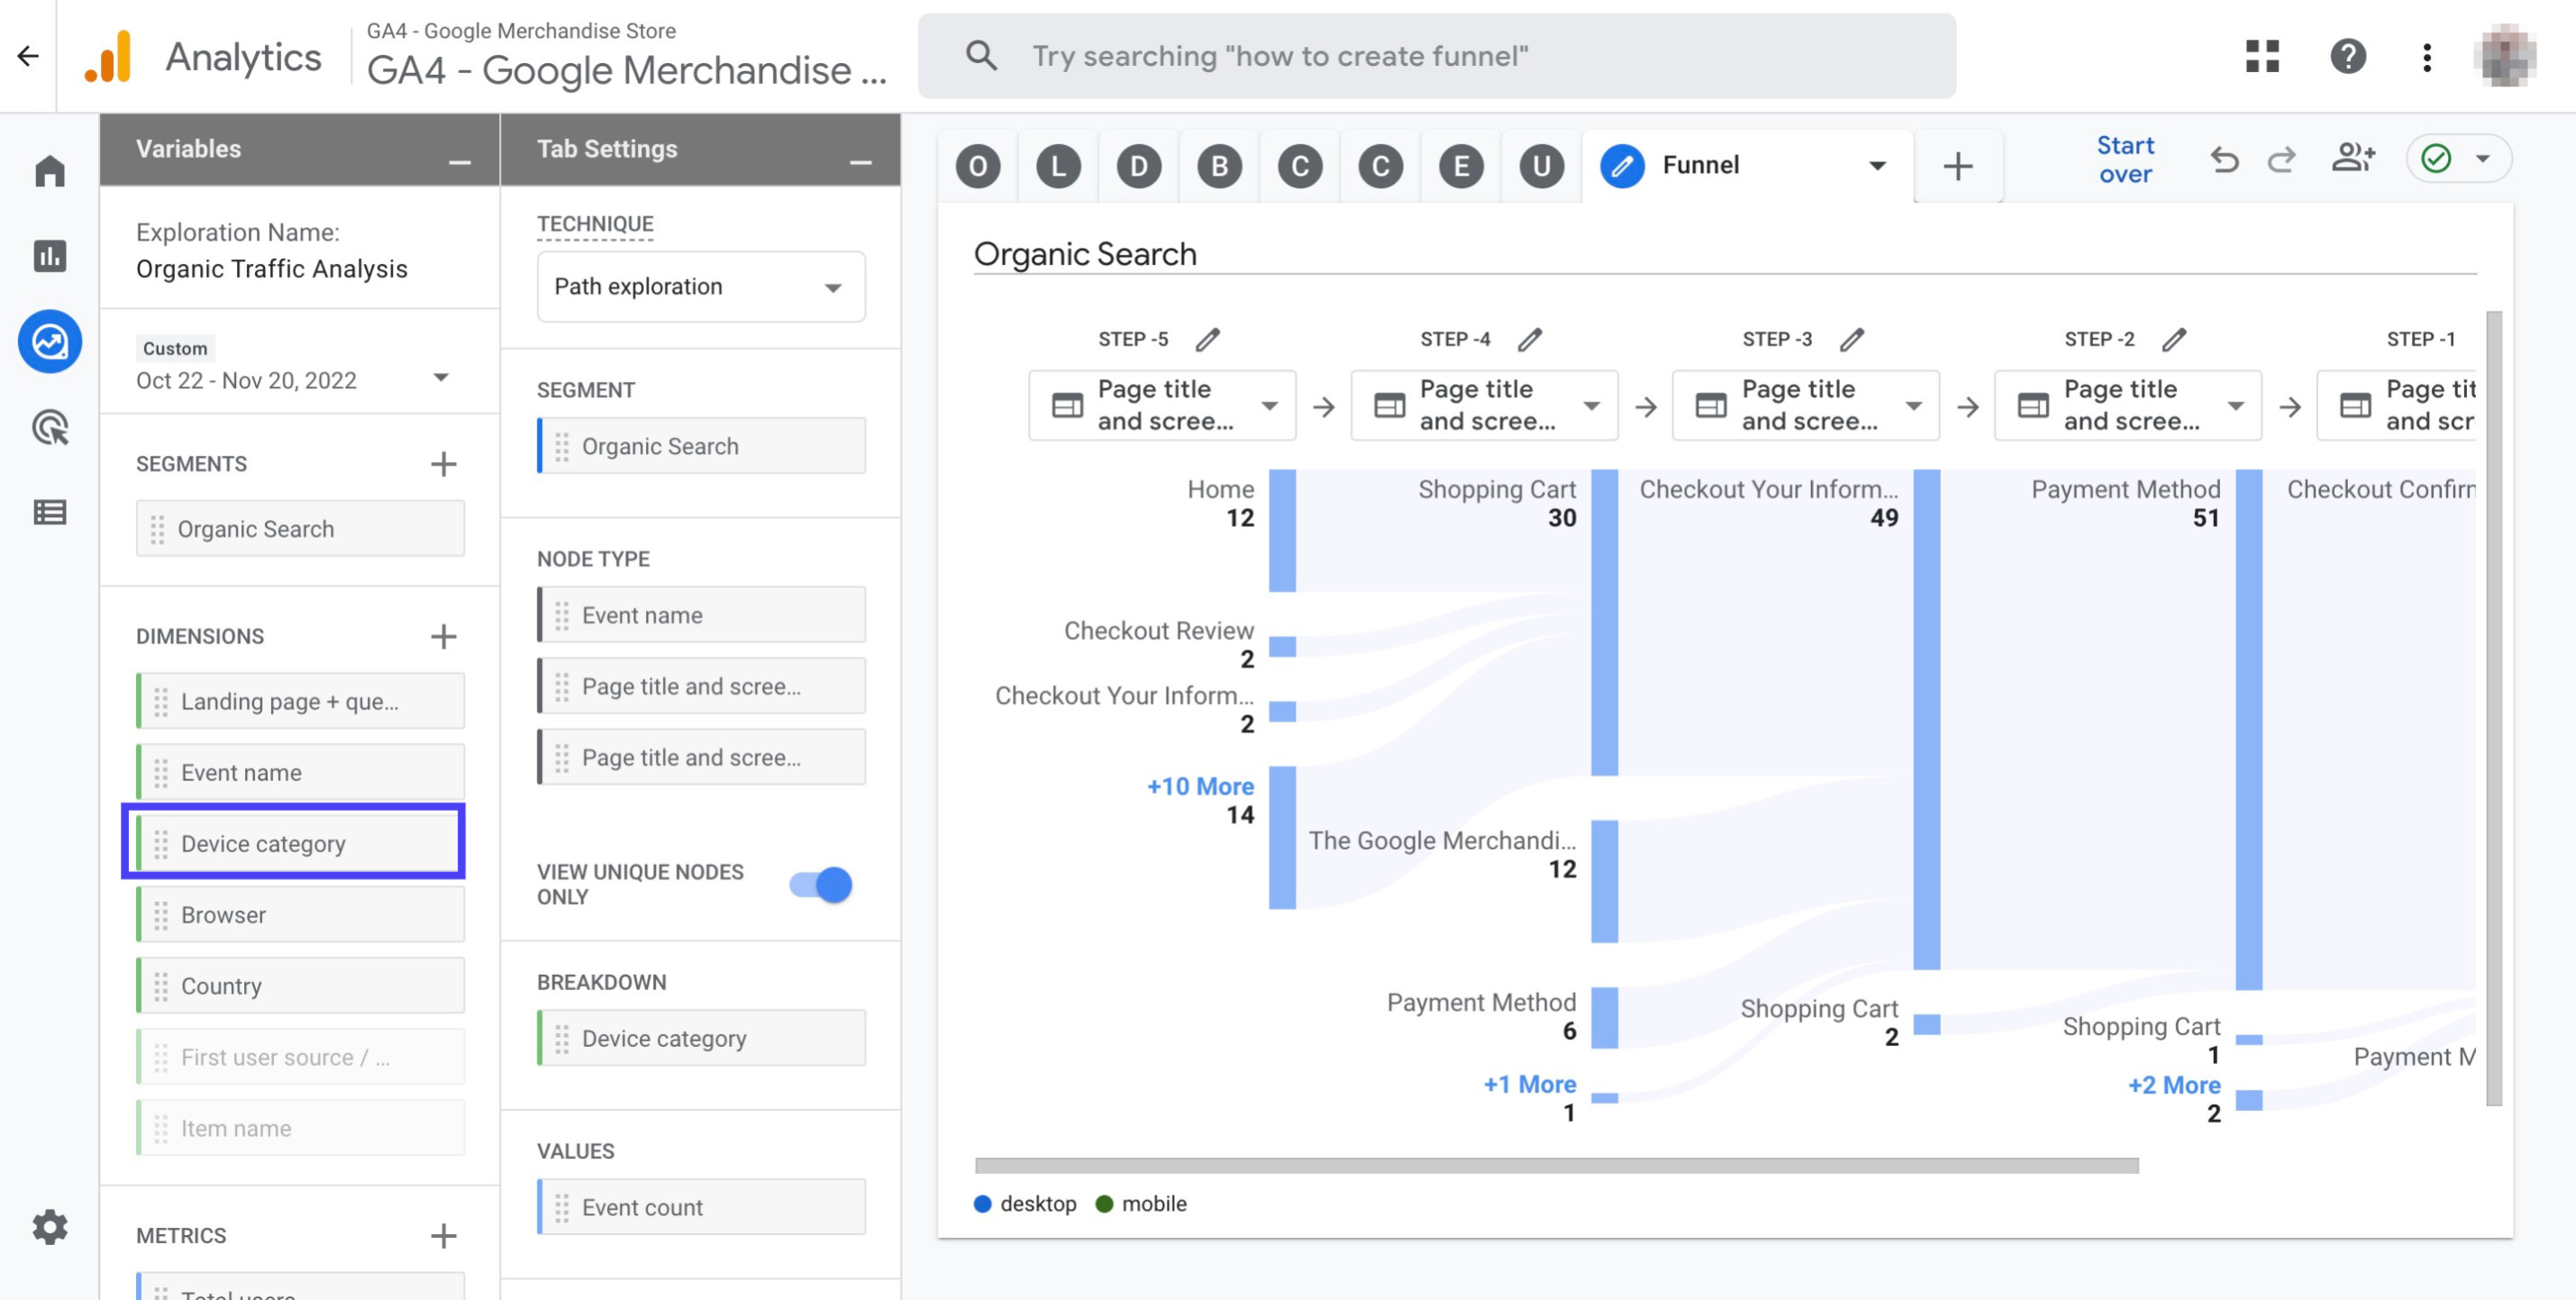
Double click the dimension 'Device category' to add it to your report
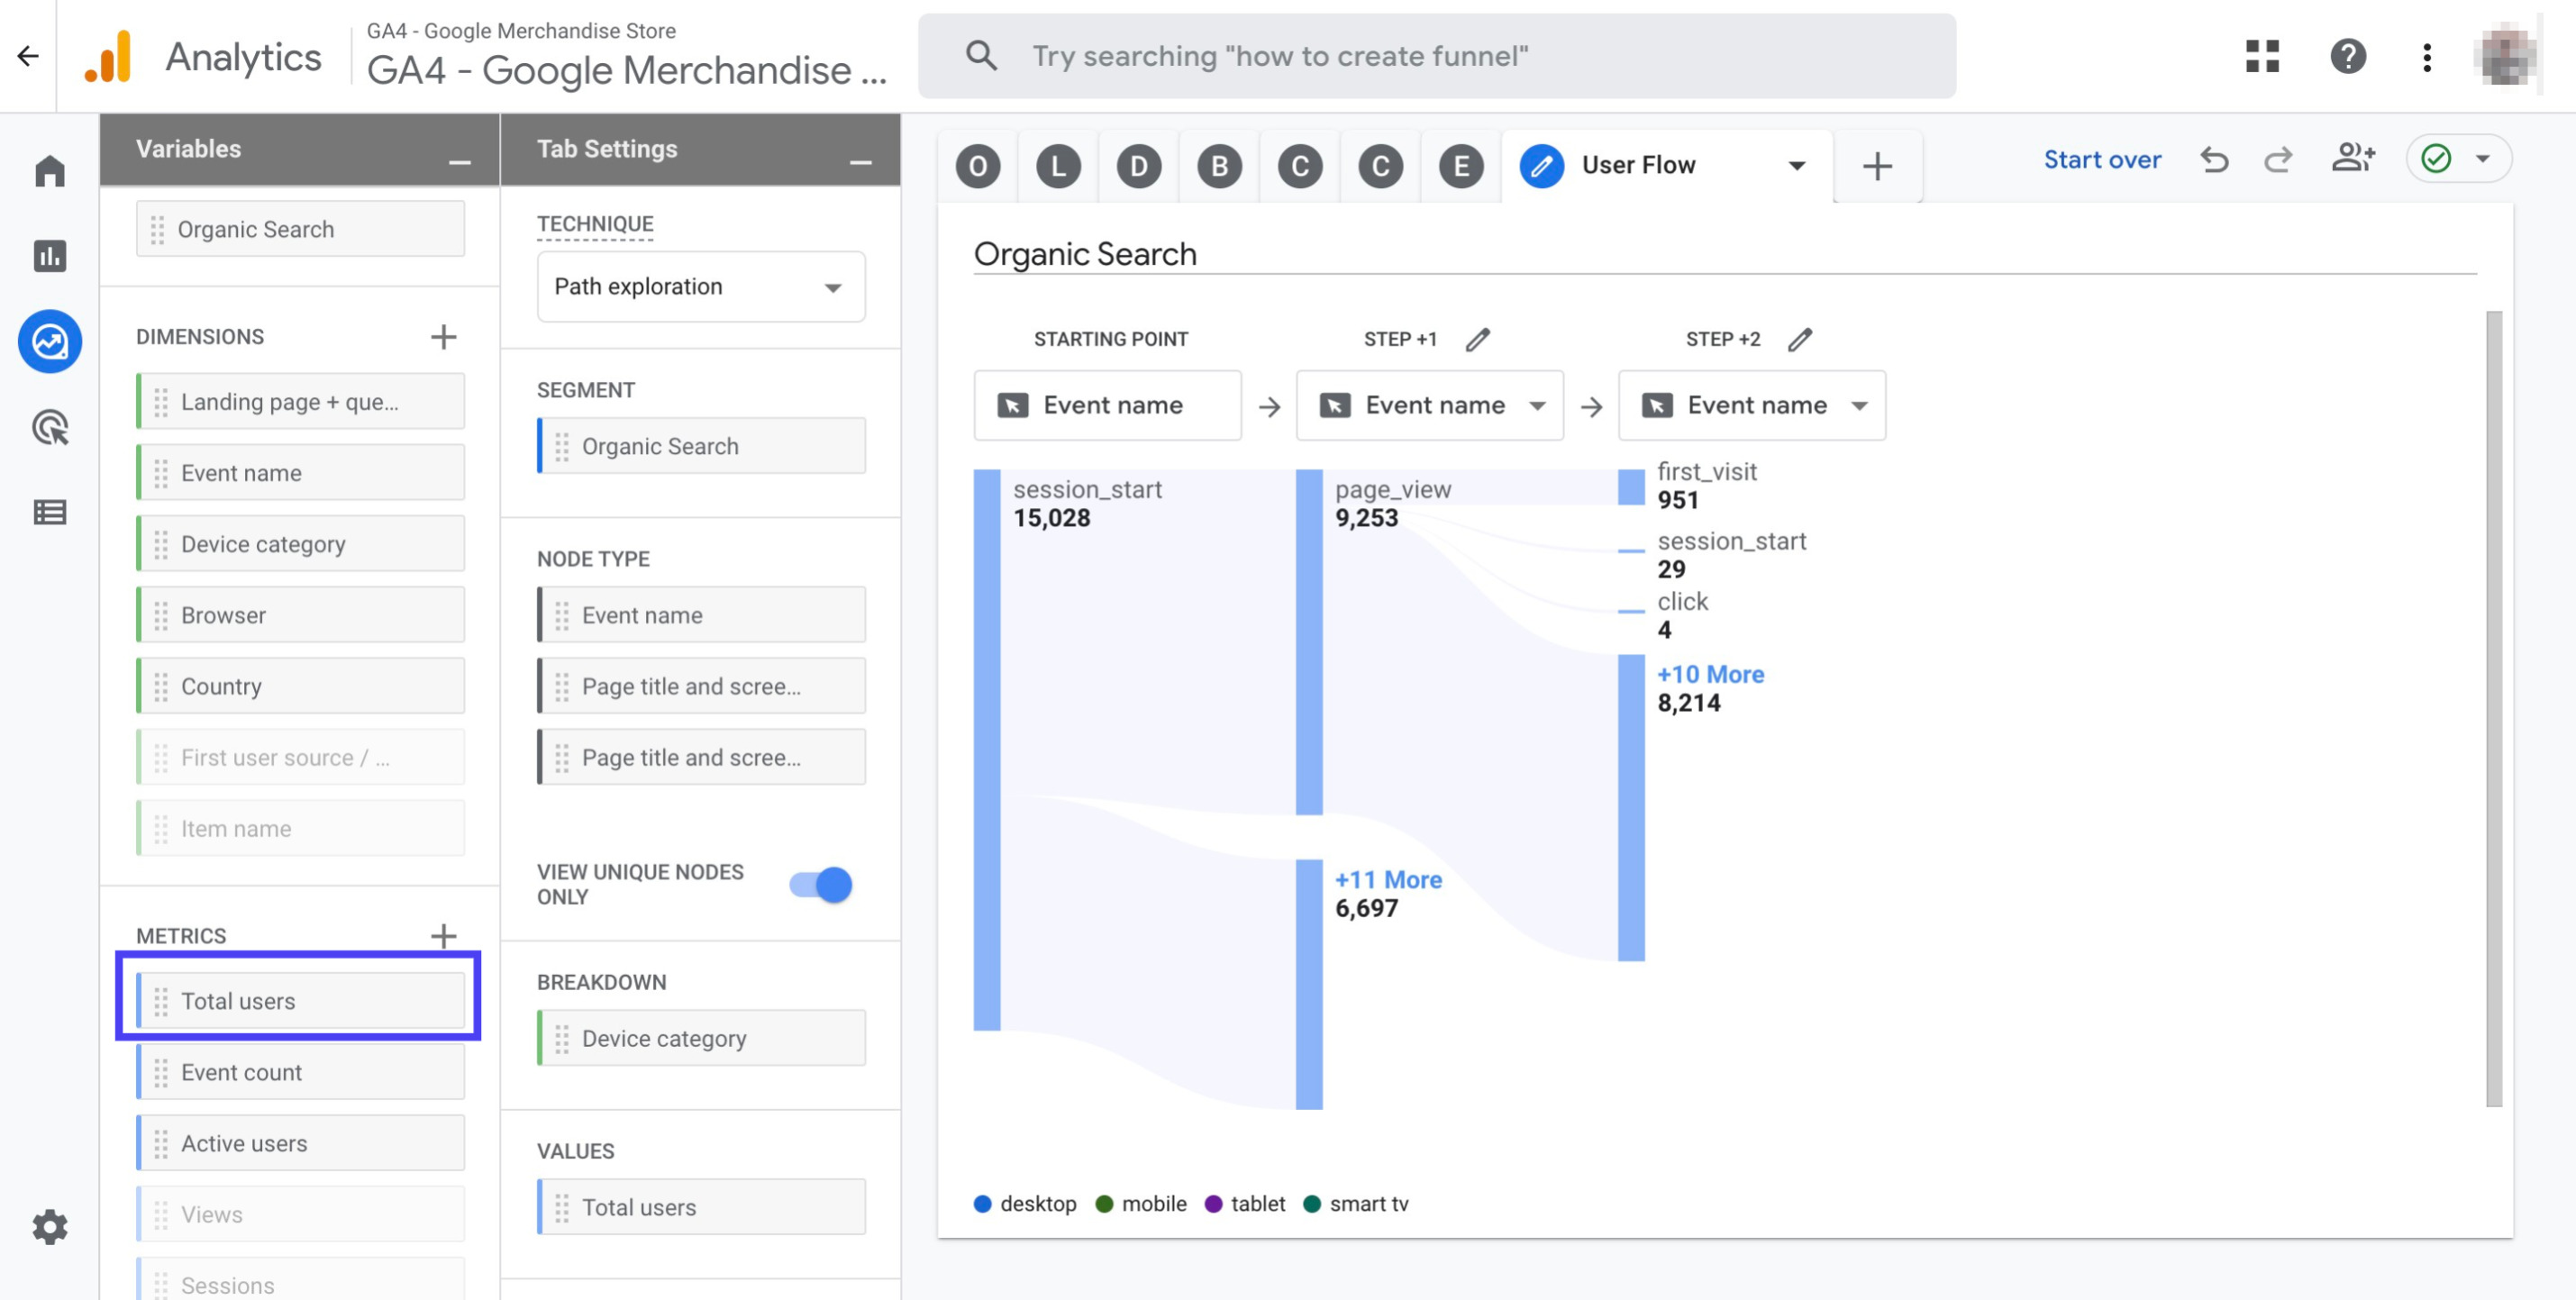
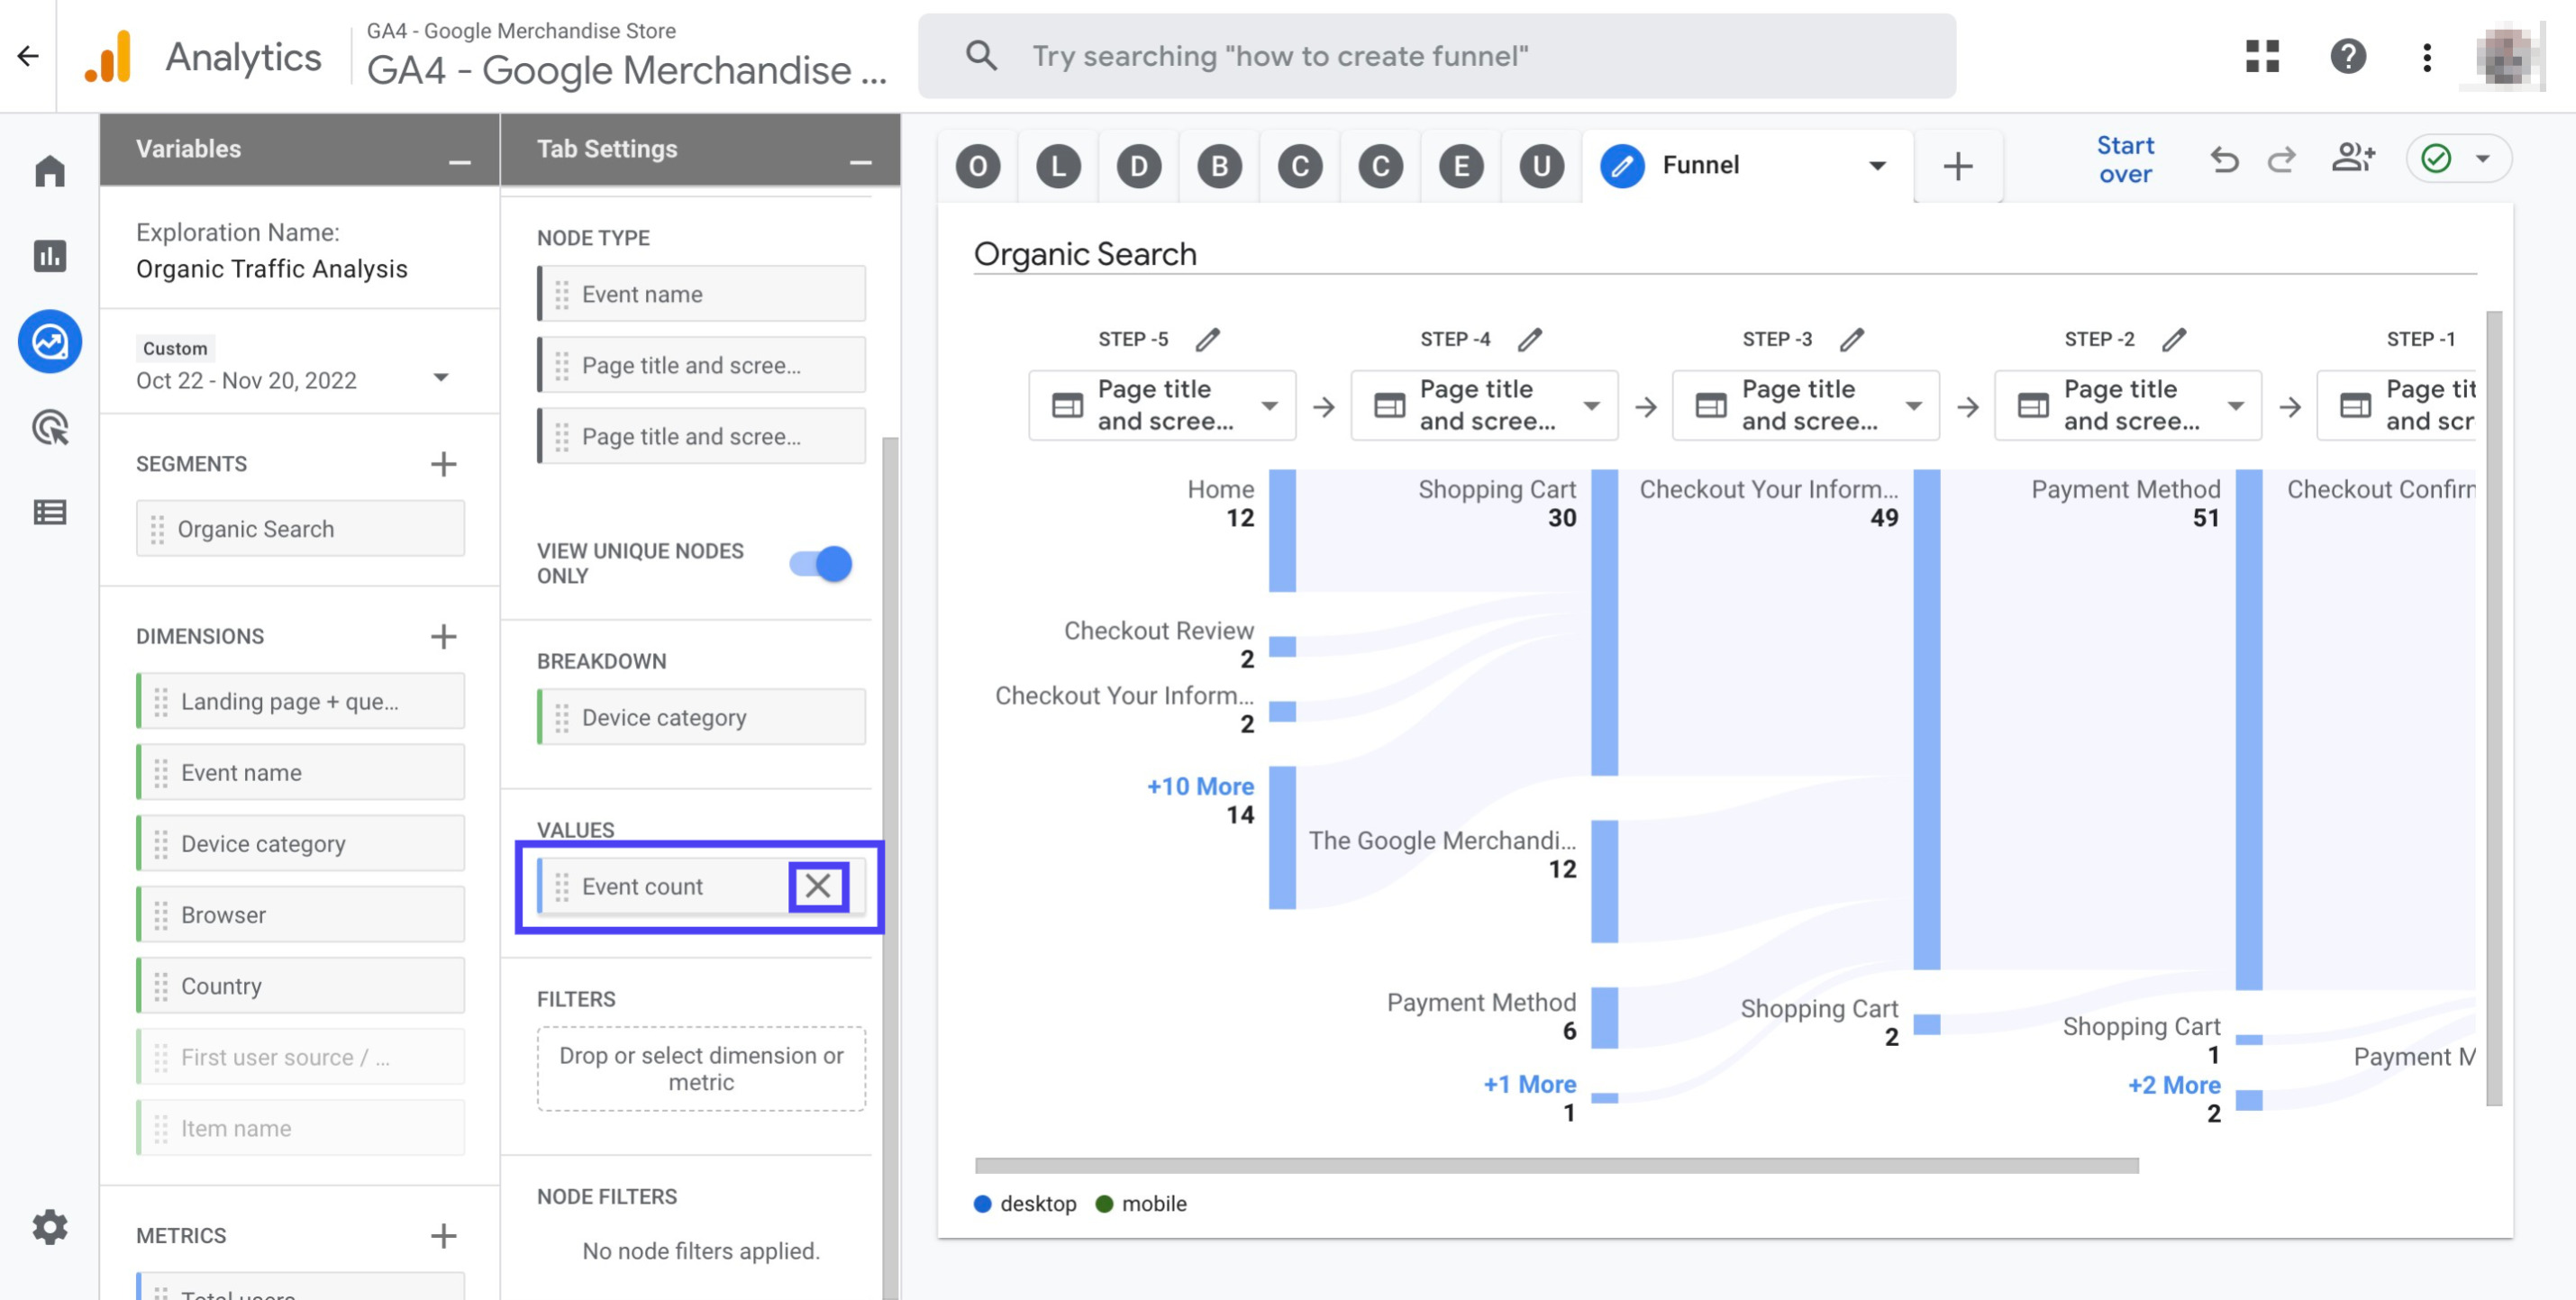
Click the cross sign next to the 'Event count' metric to remove it from the report
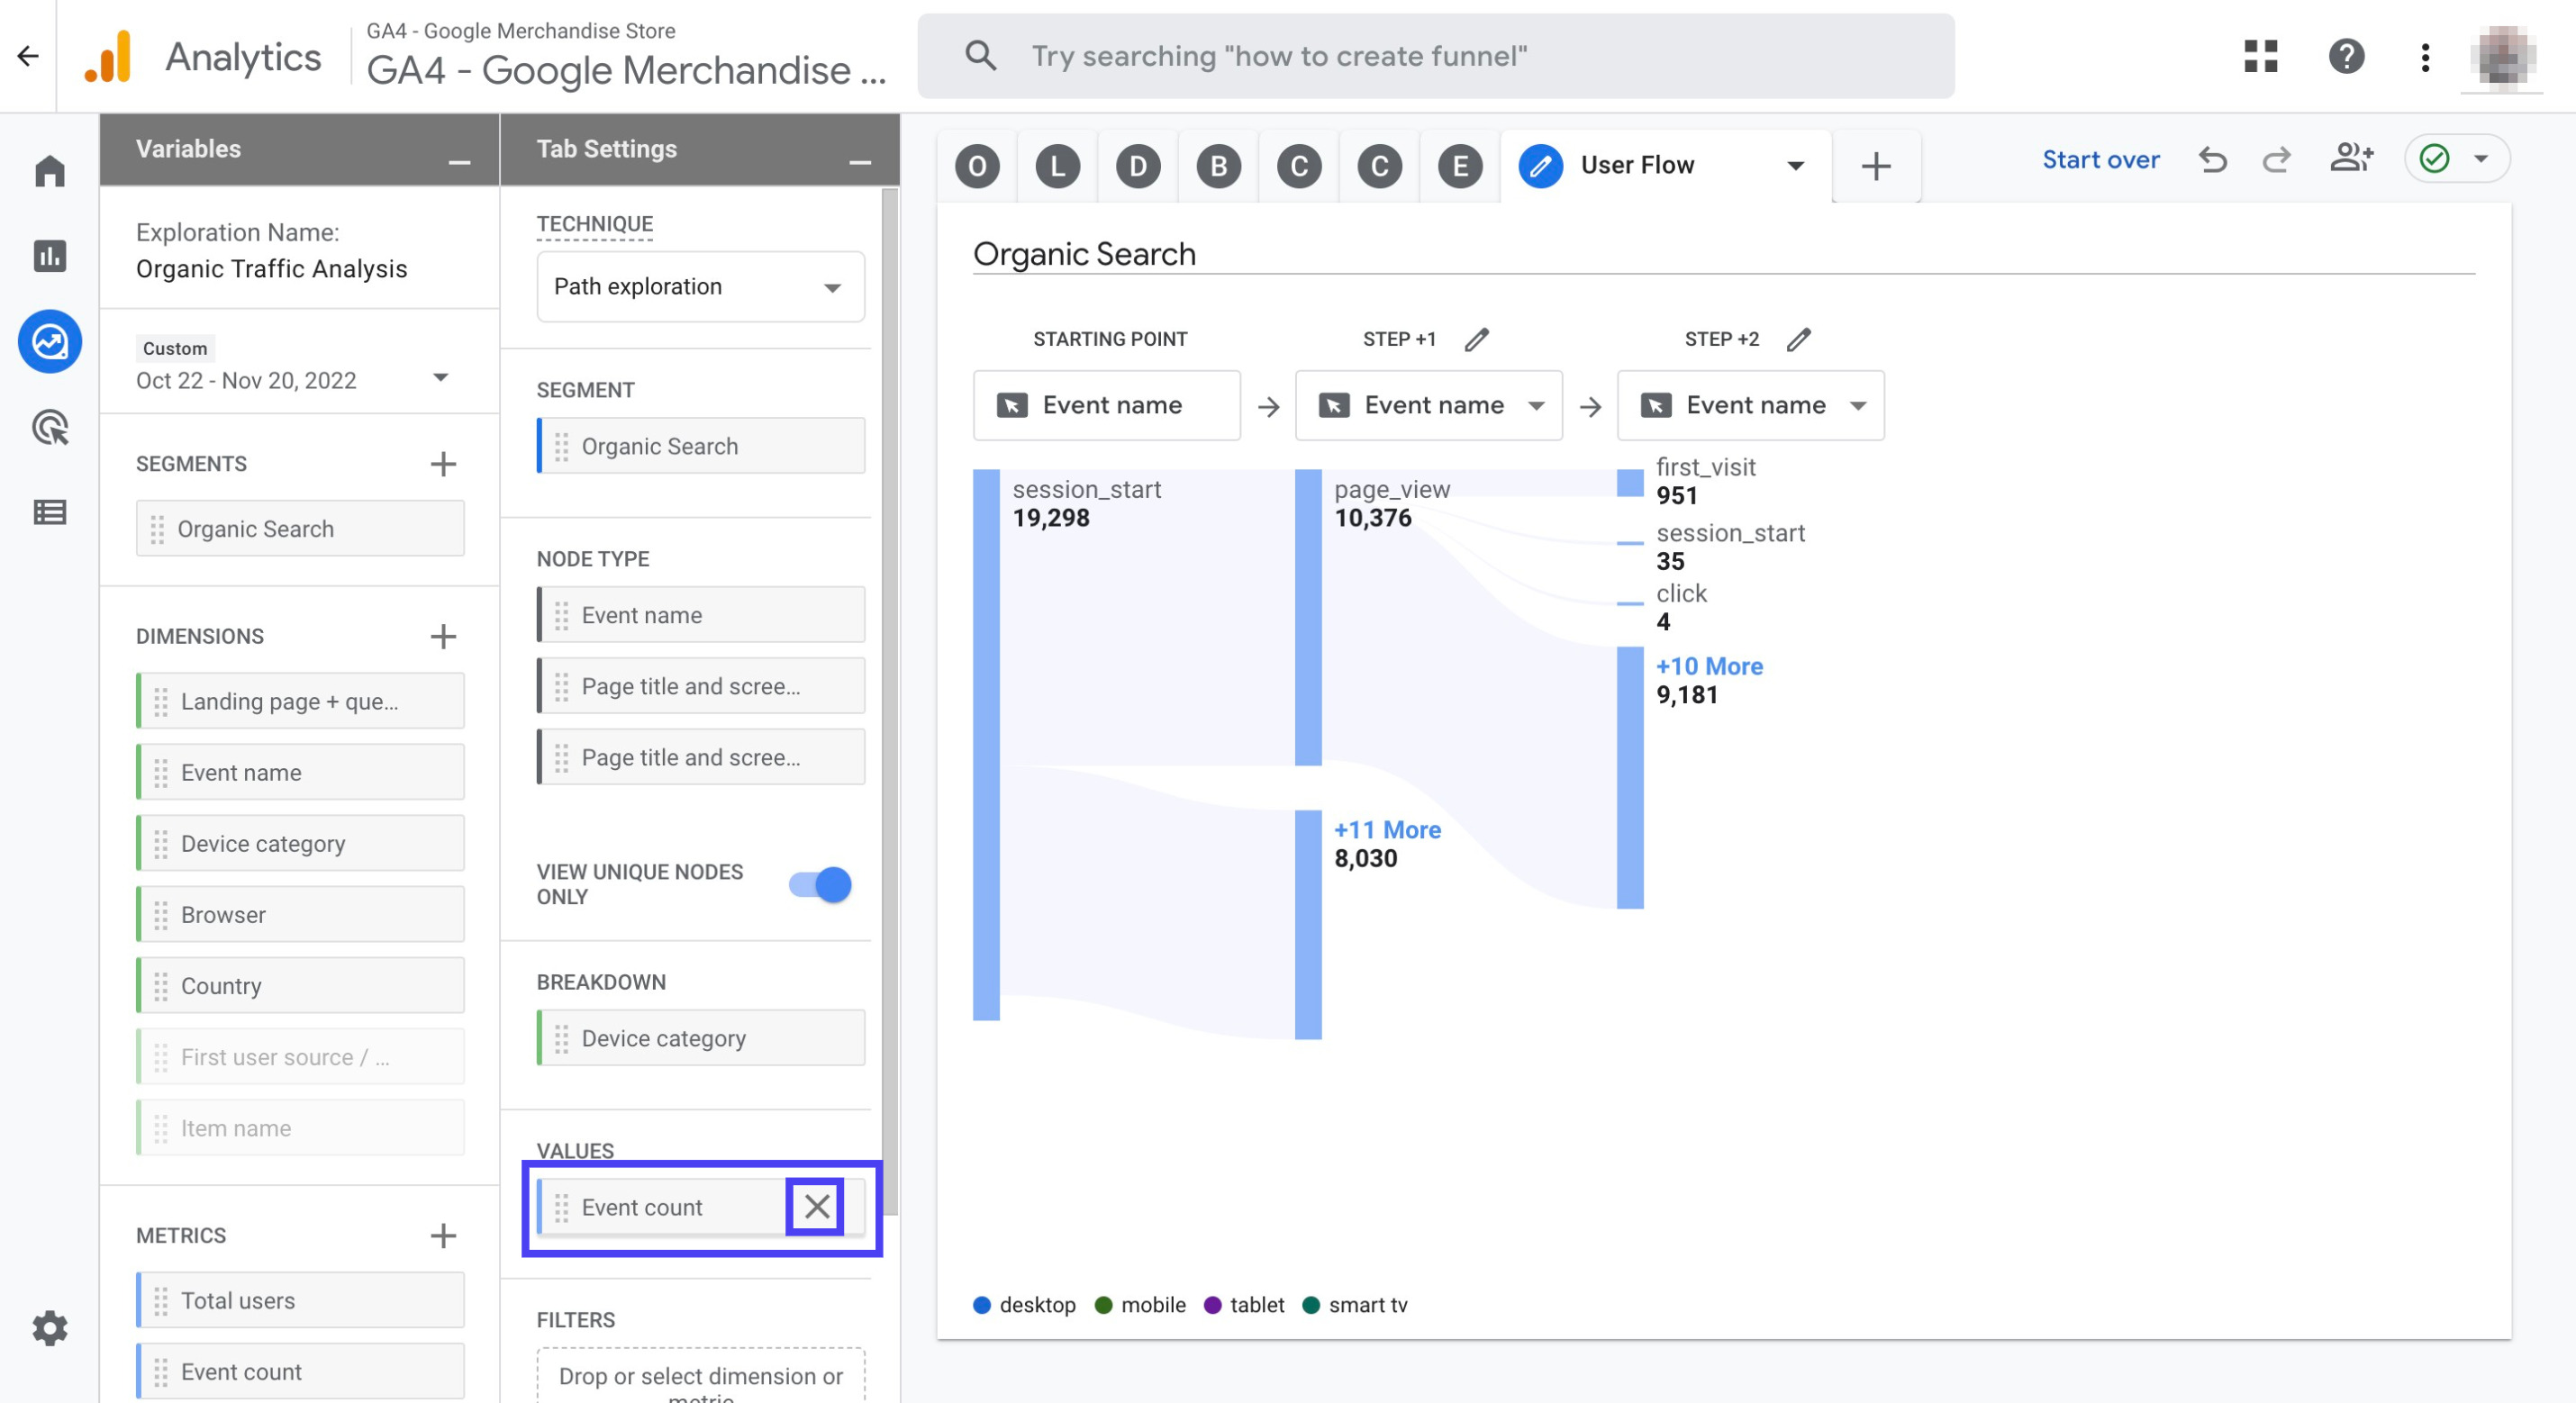
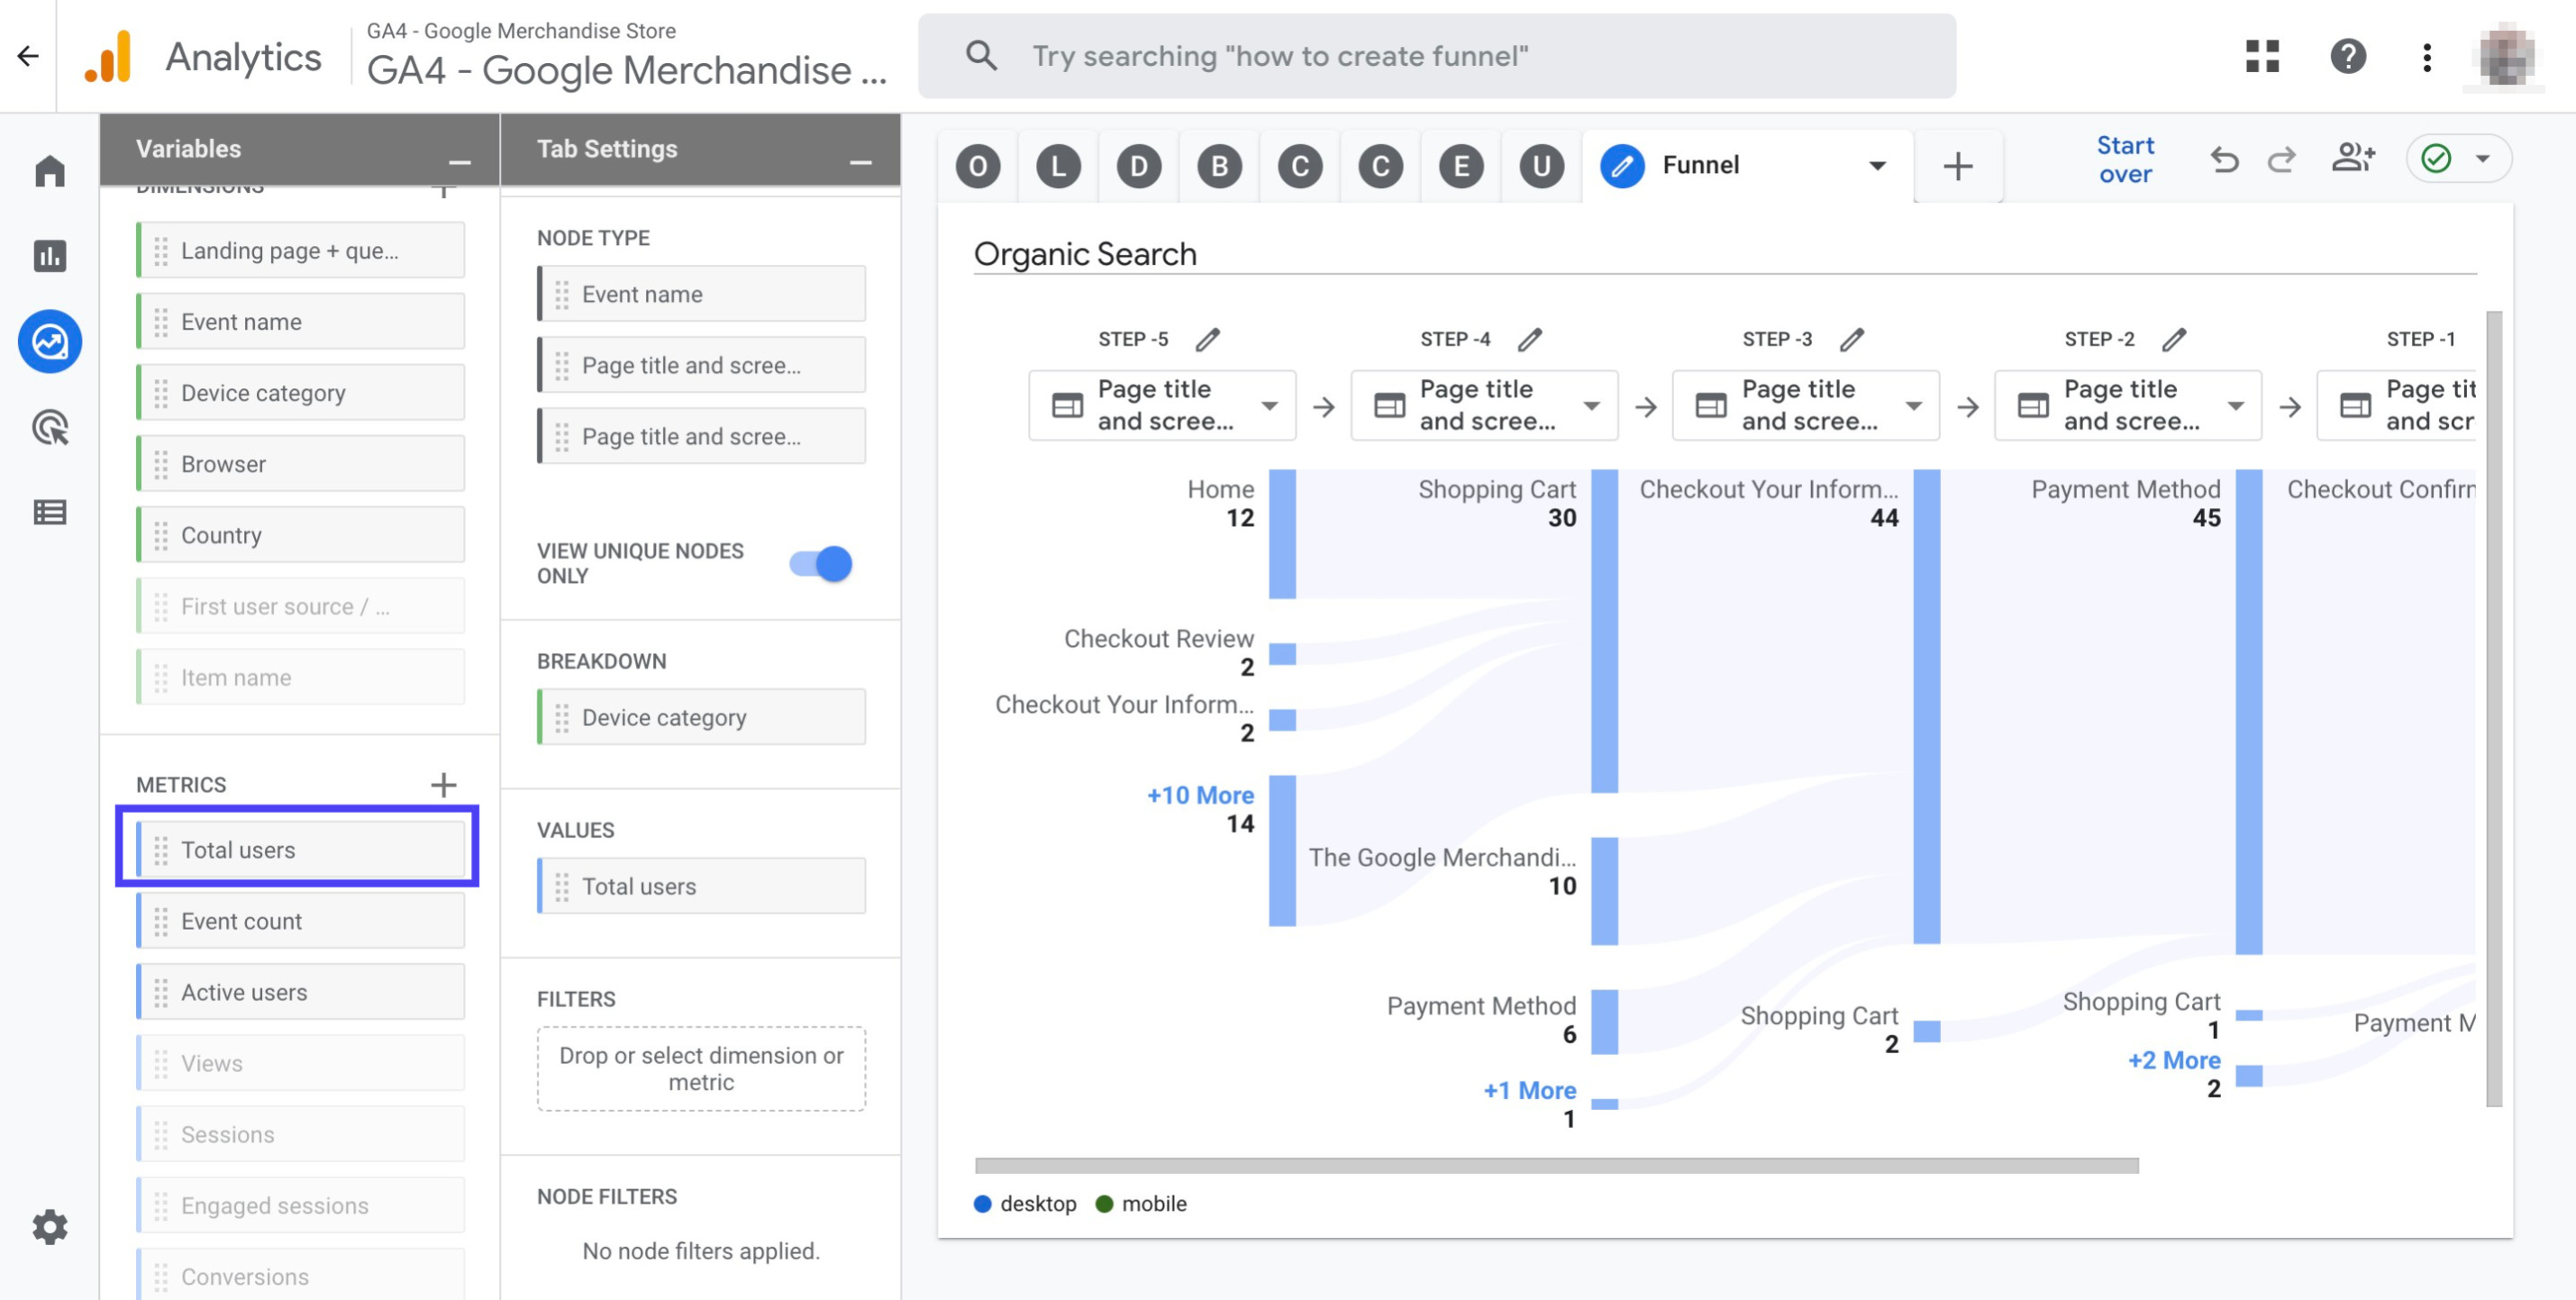
Double click the metric 'Total users' to add it to your report
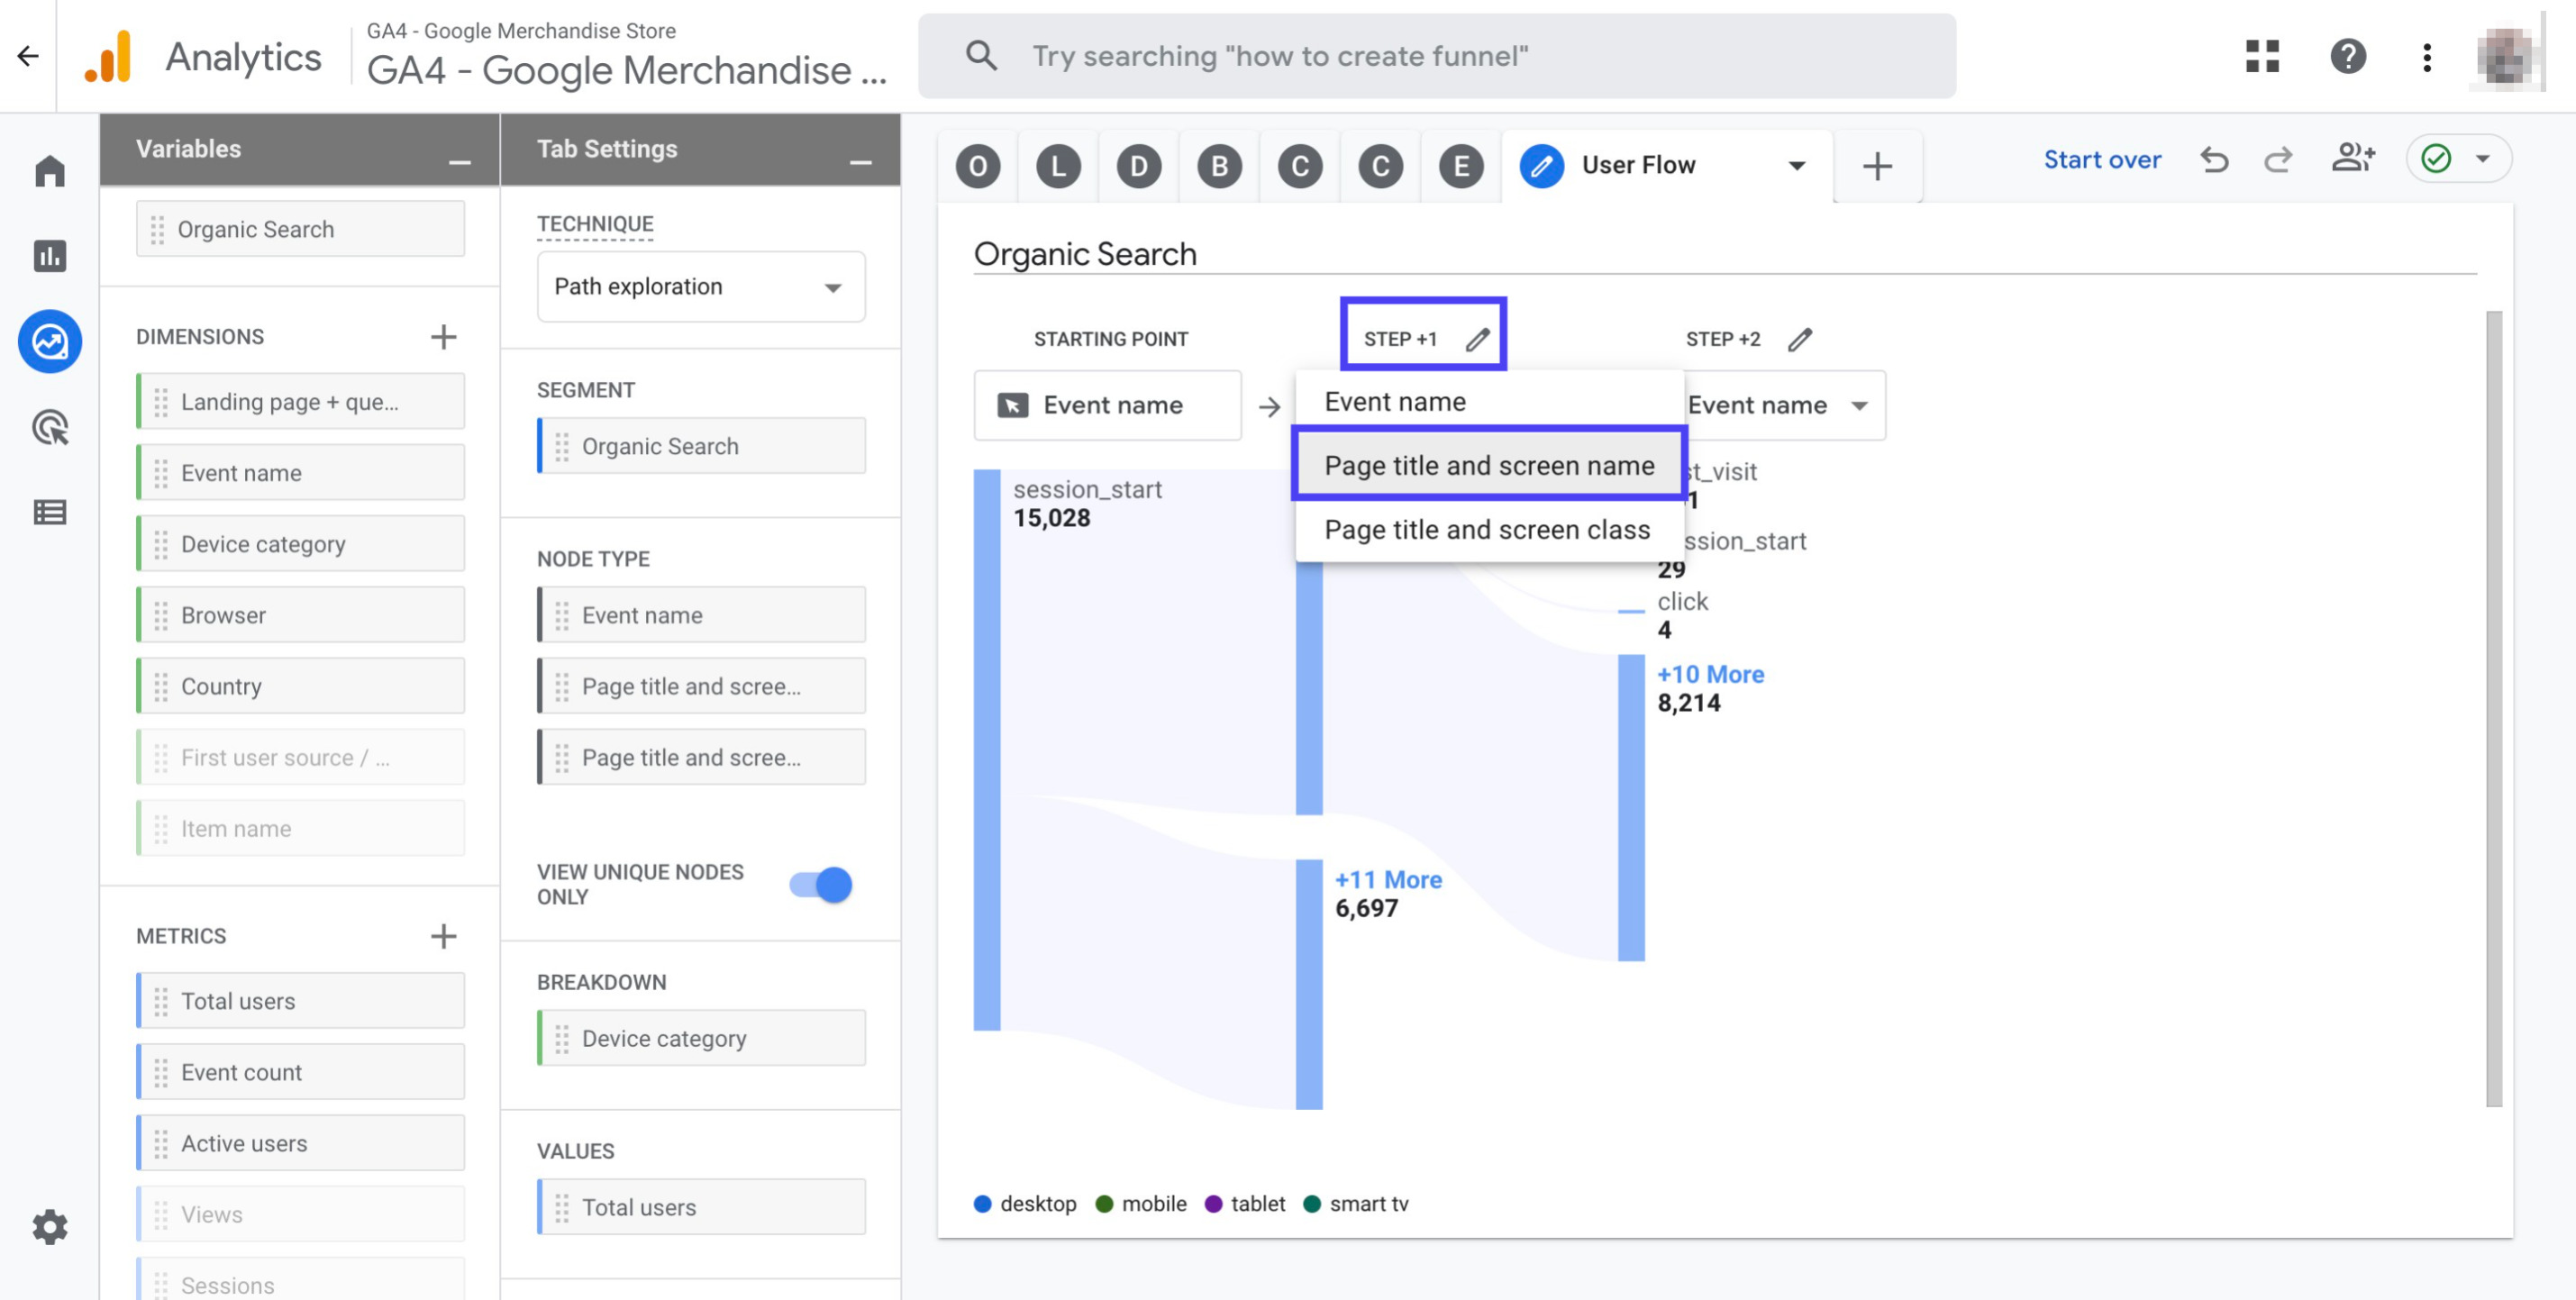
Click 'Step +1' and then choose 'Page title and screen name' from the drop down menu
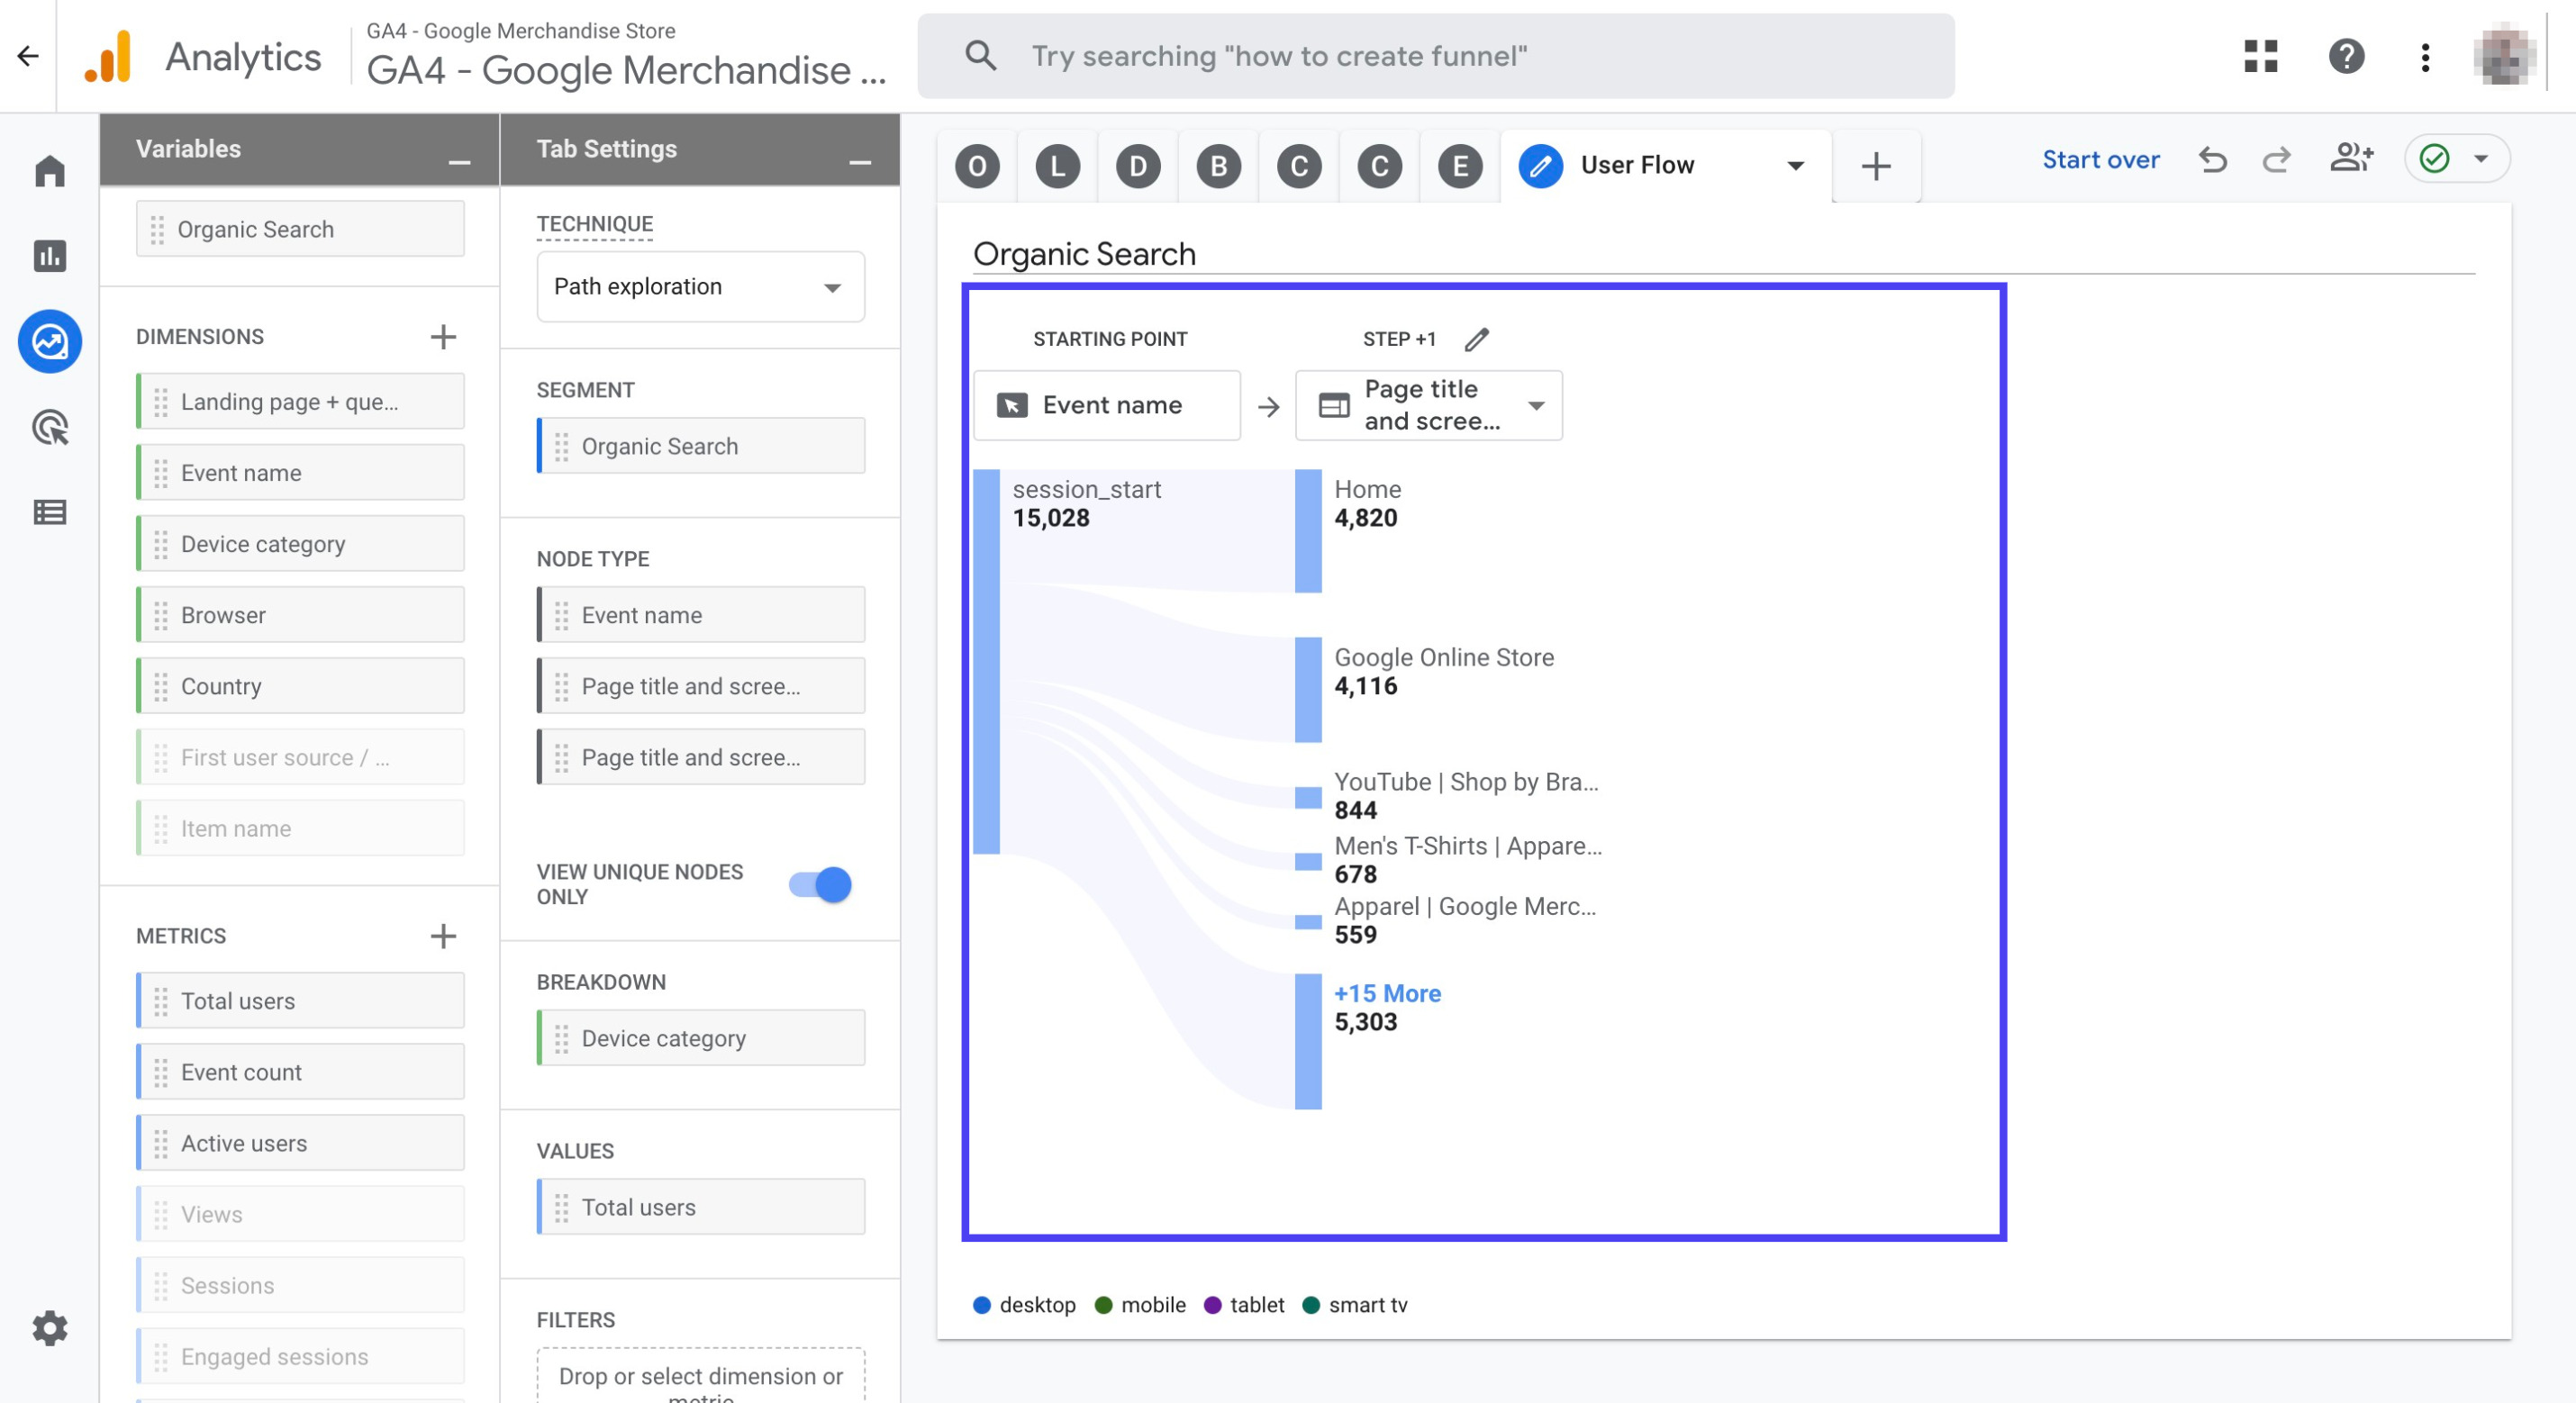
Now, you should see your report as shown in the graphic below. You can hover your mouse over blue bars to see more details
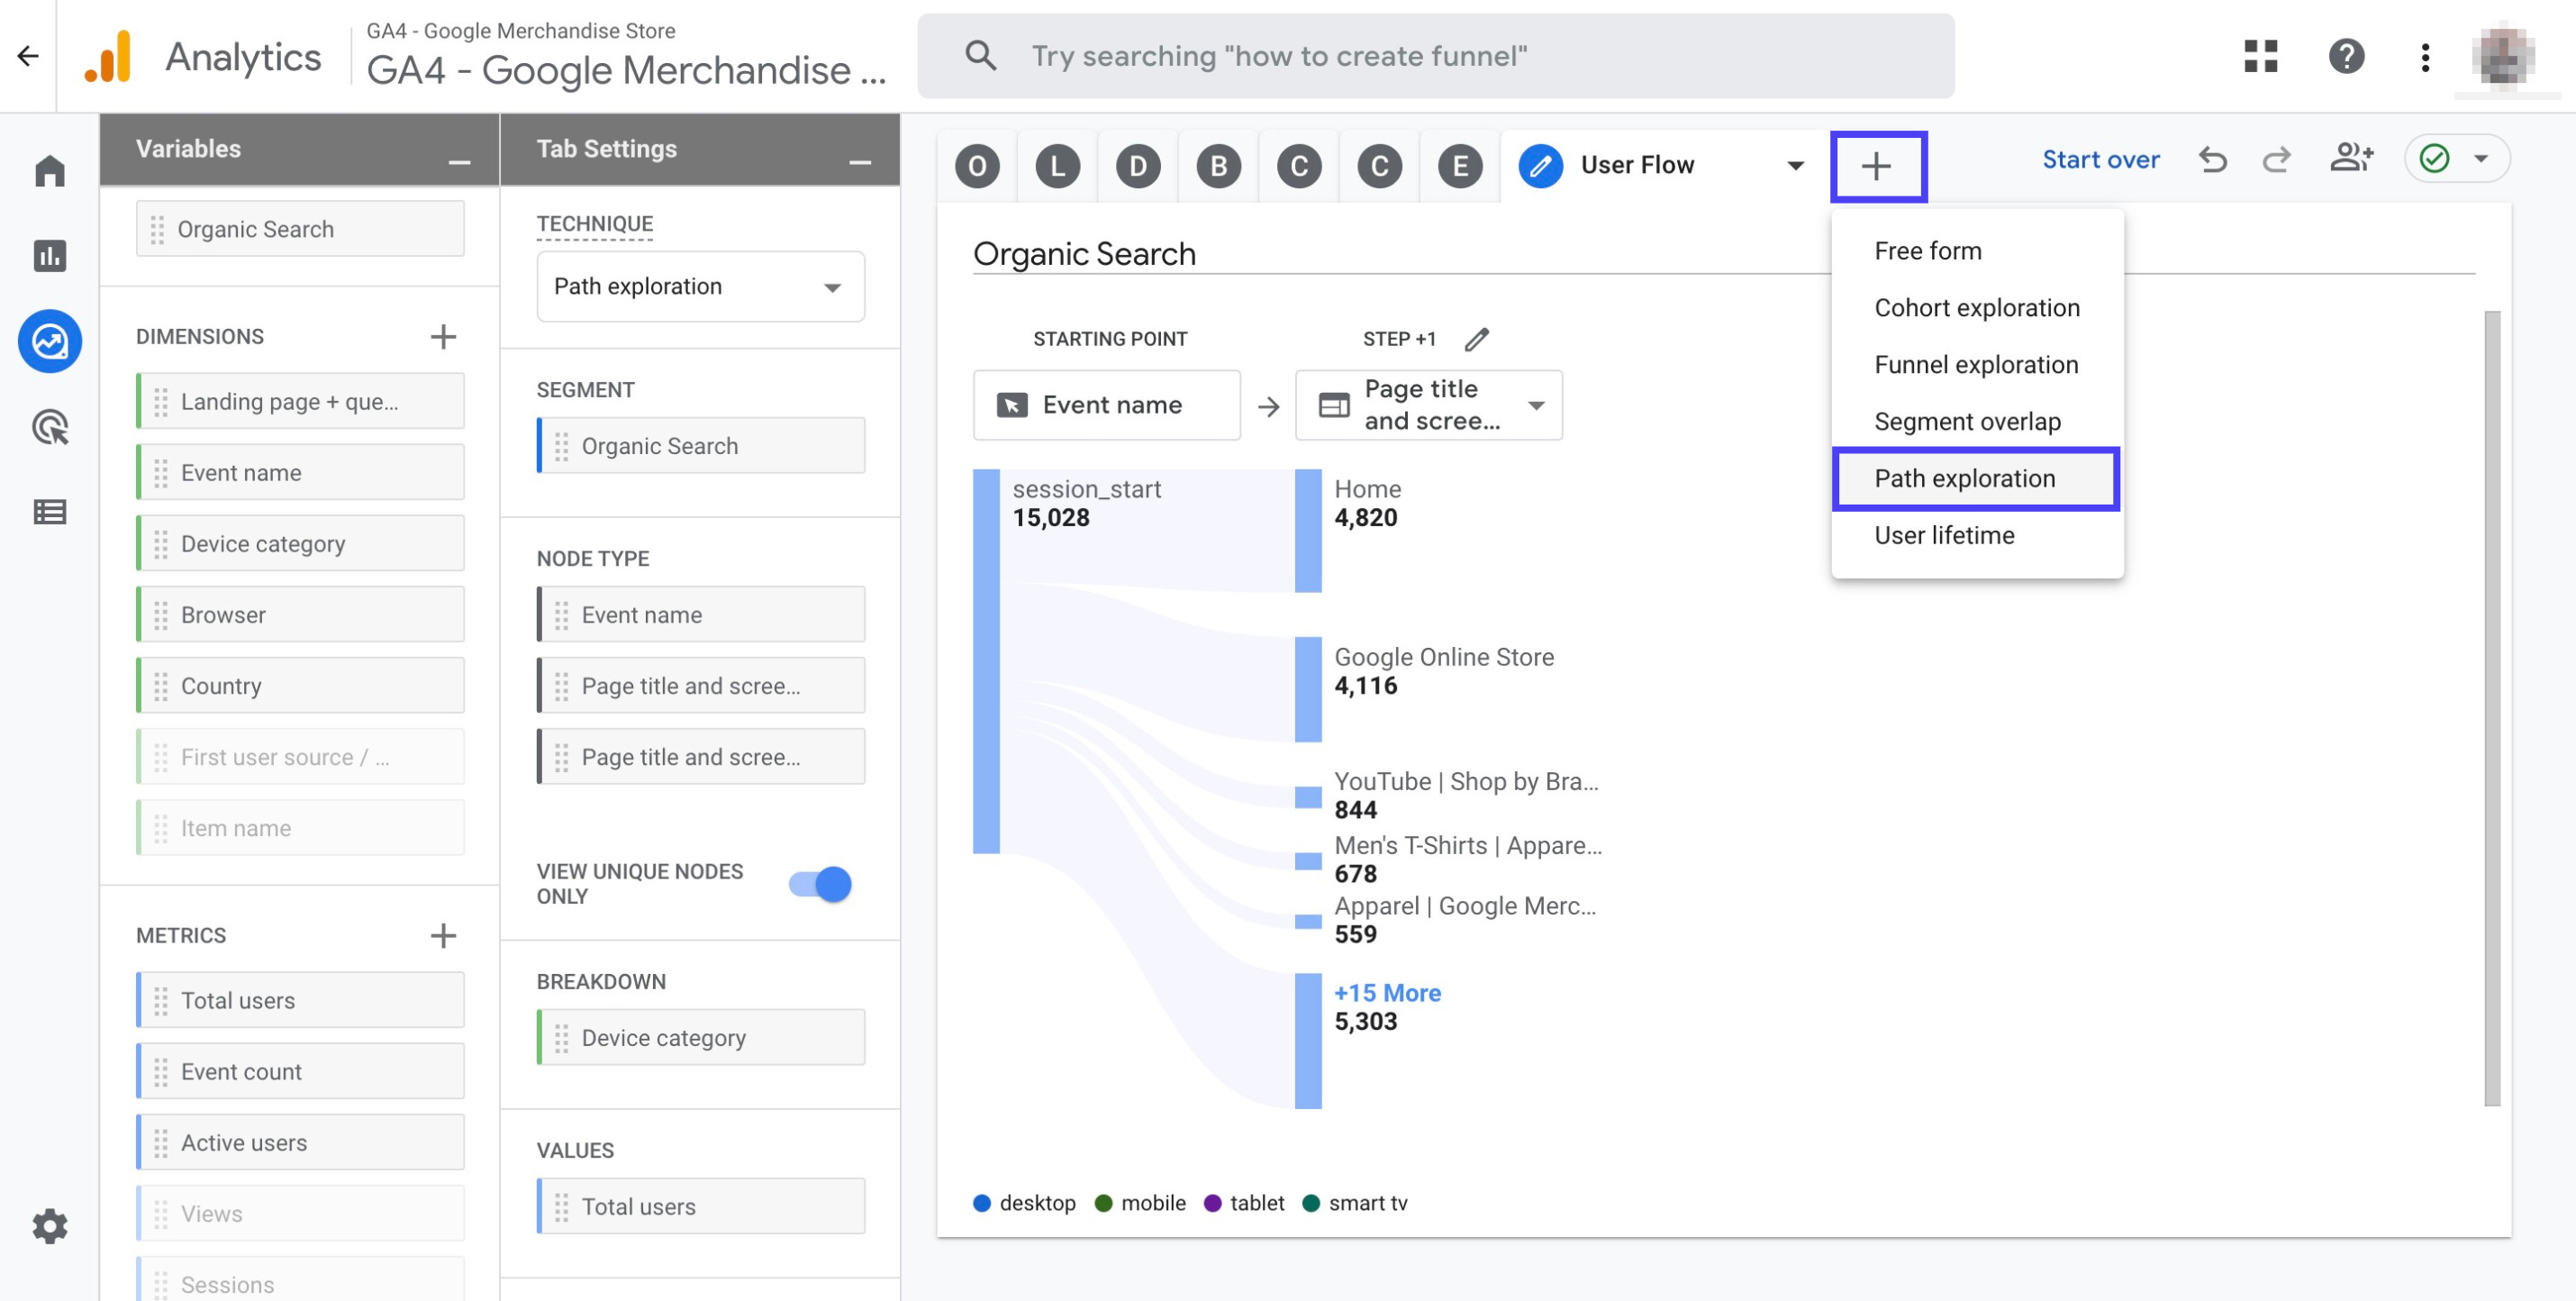
Click the '+' sign right next to the 'User Flow' tab. Then, click on 'Path Exploration'
Name the new tab as 'Funnel'
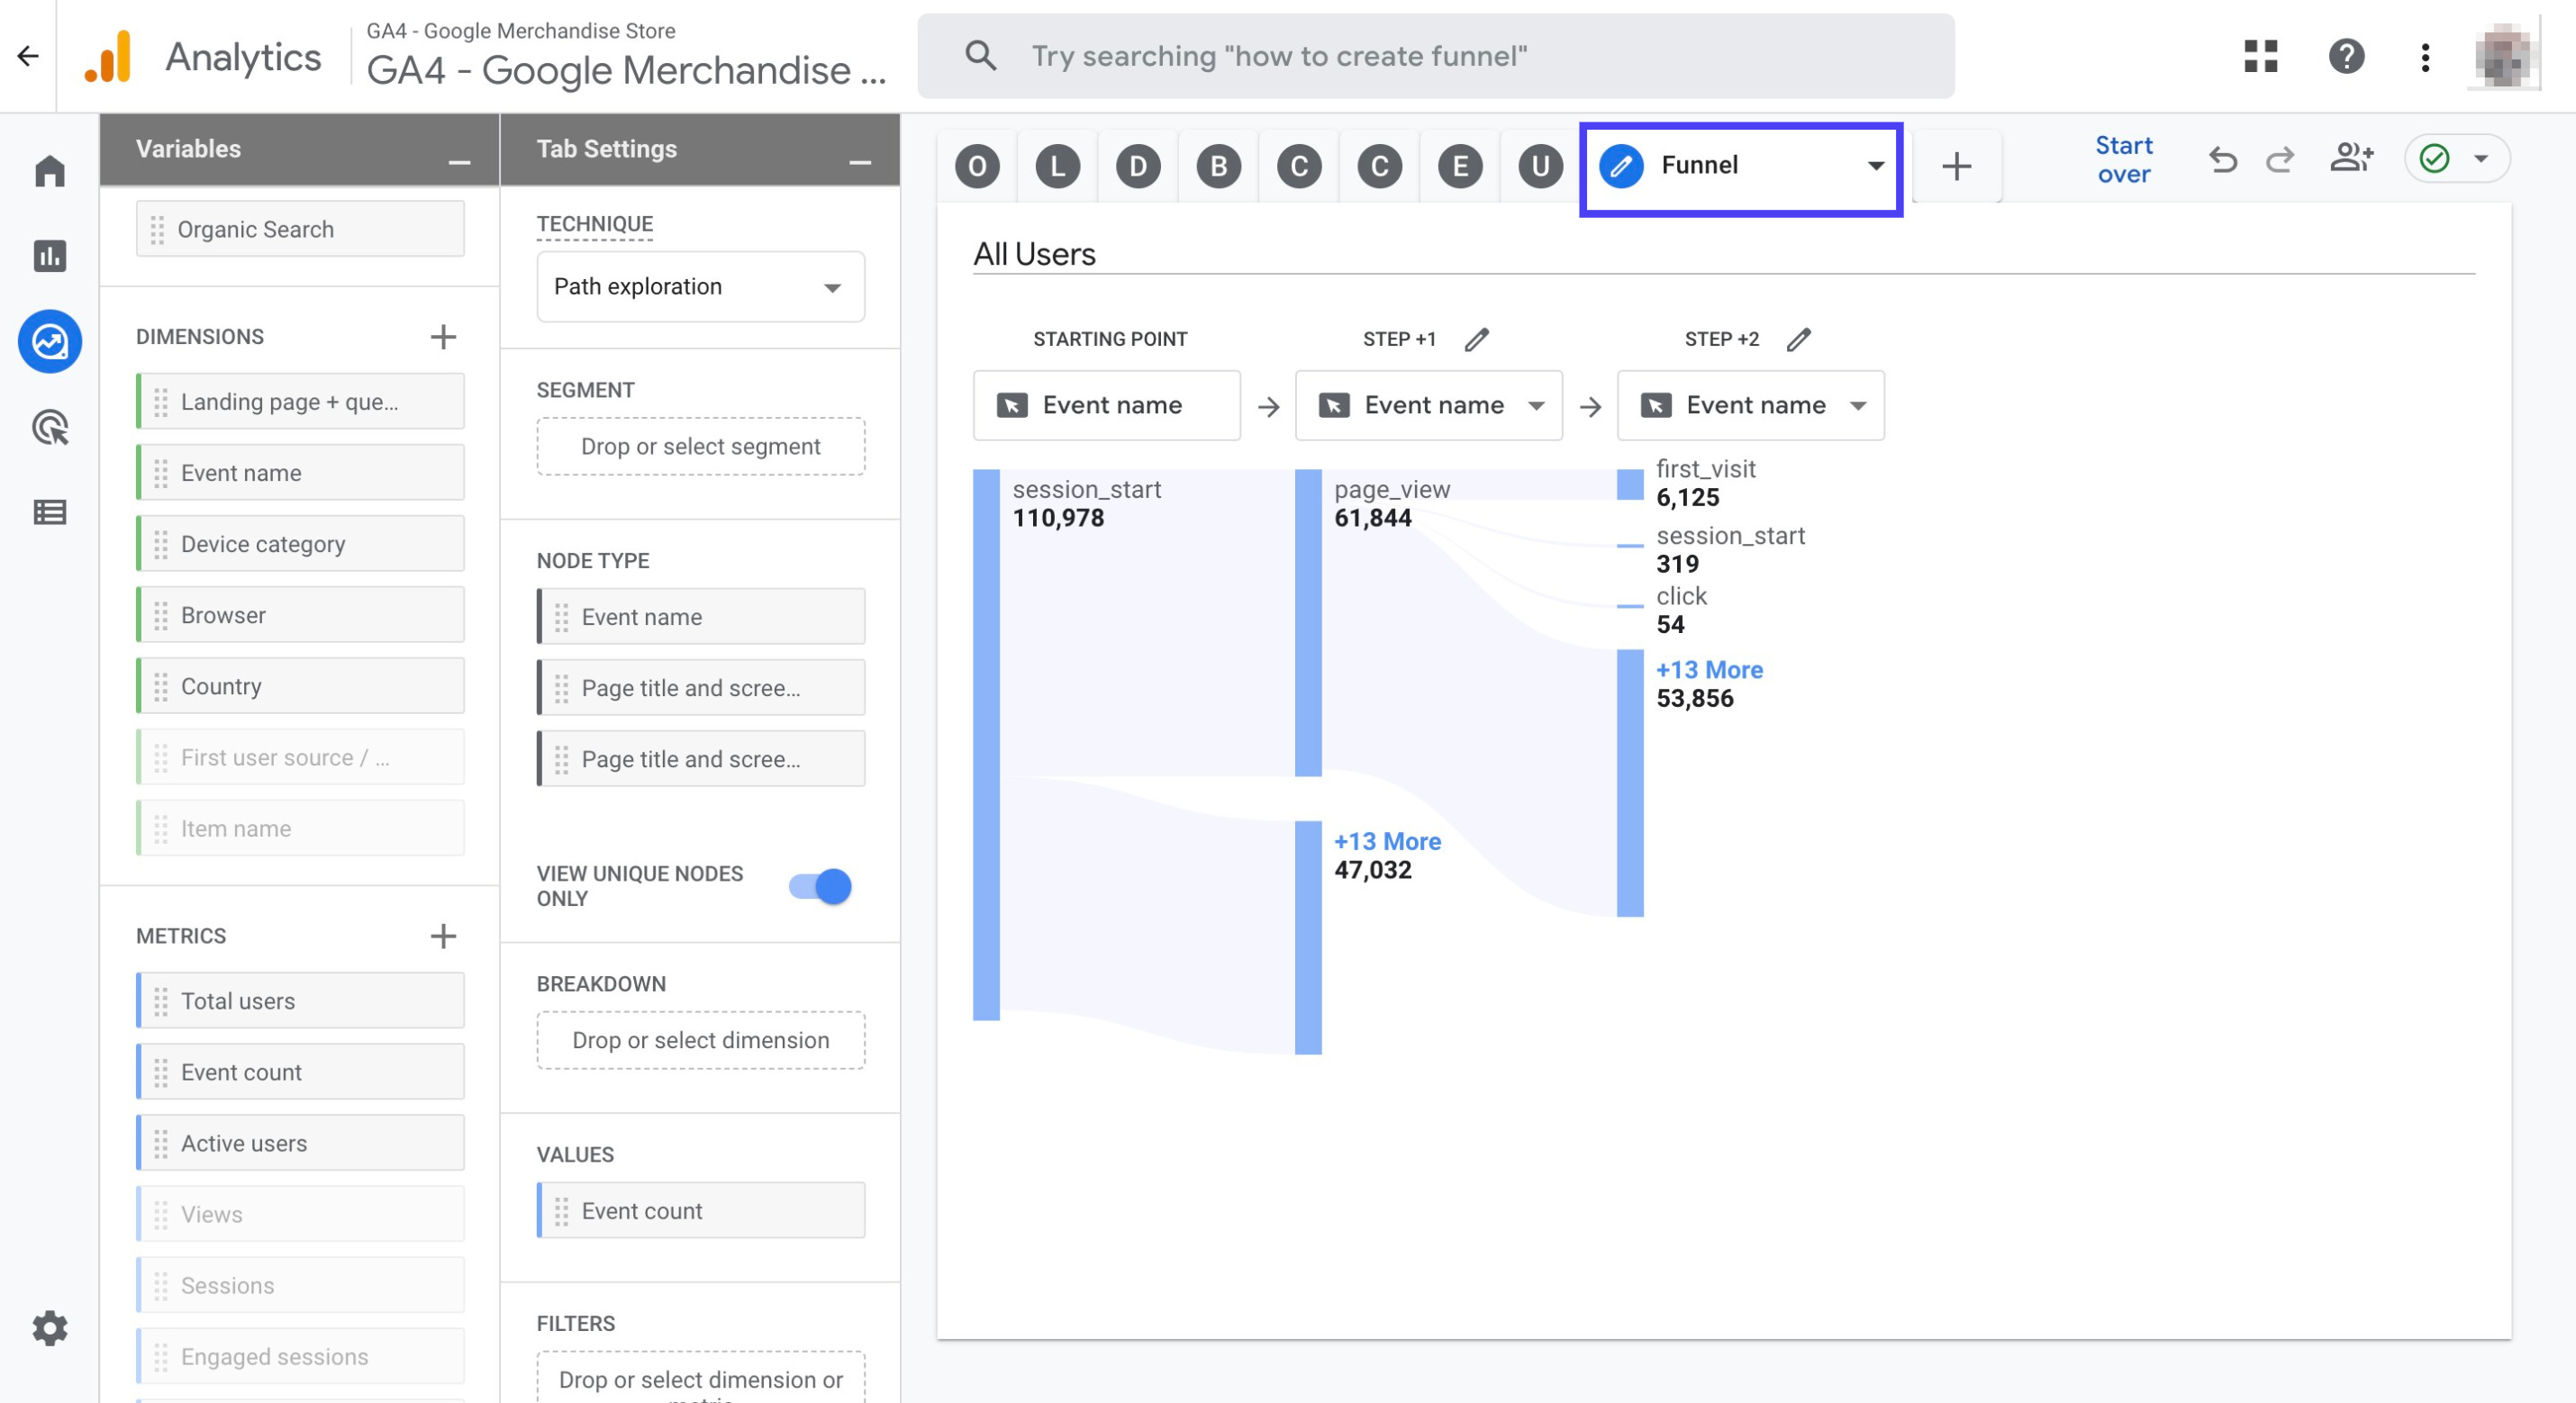
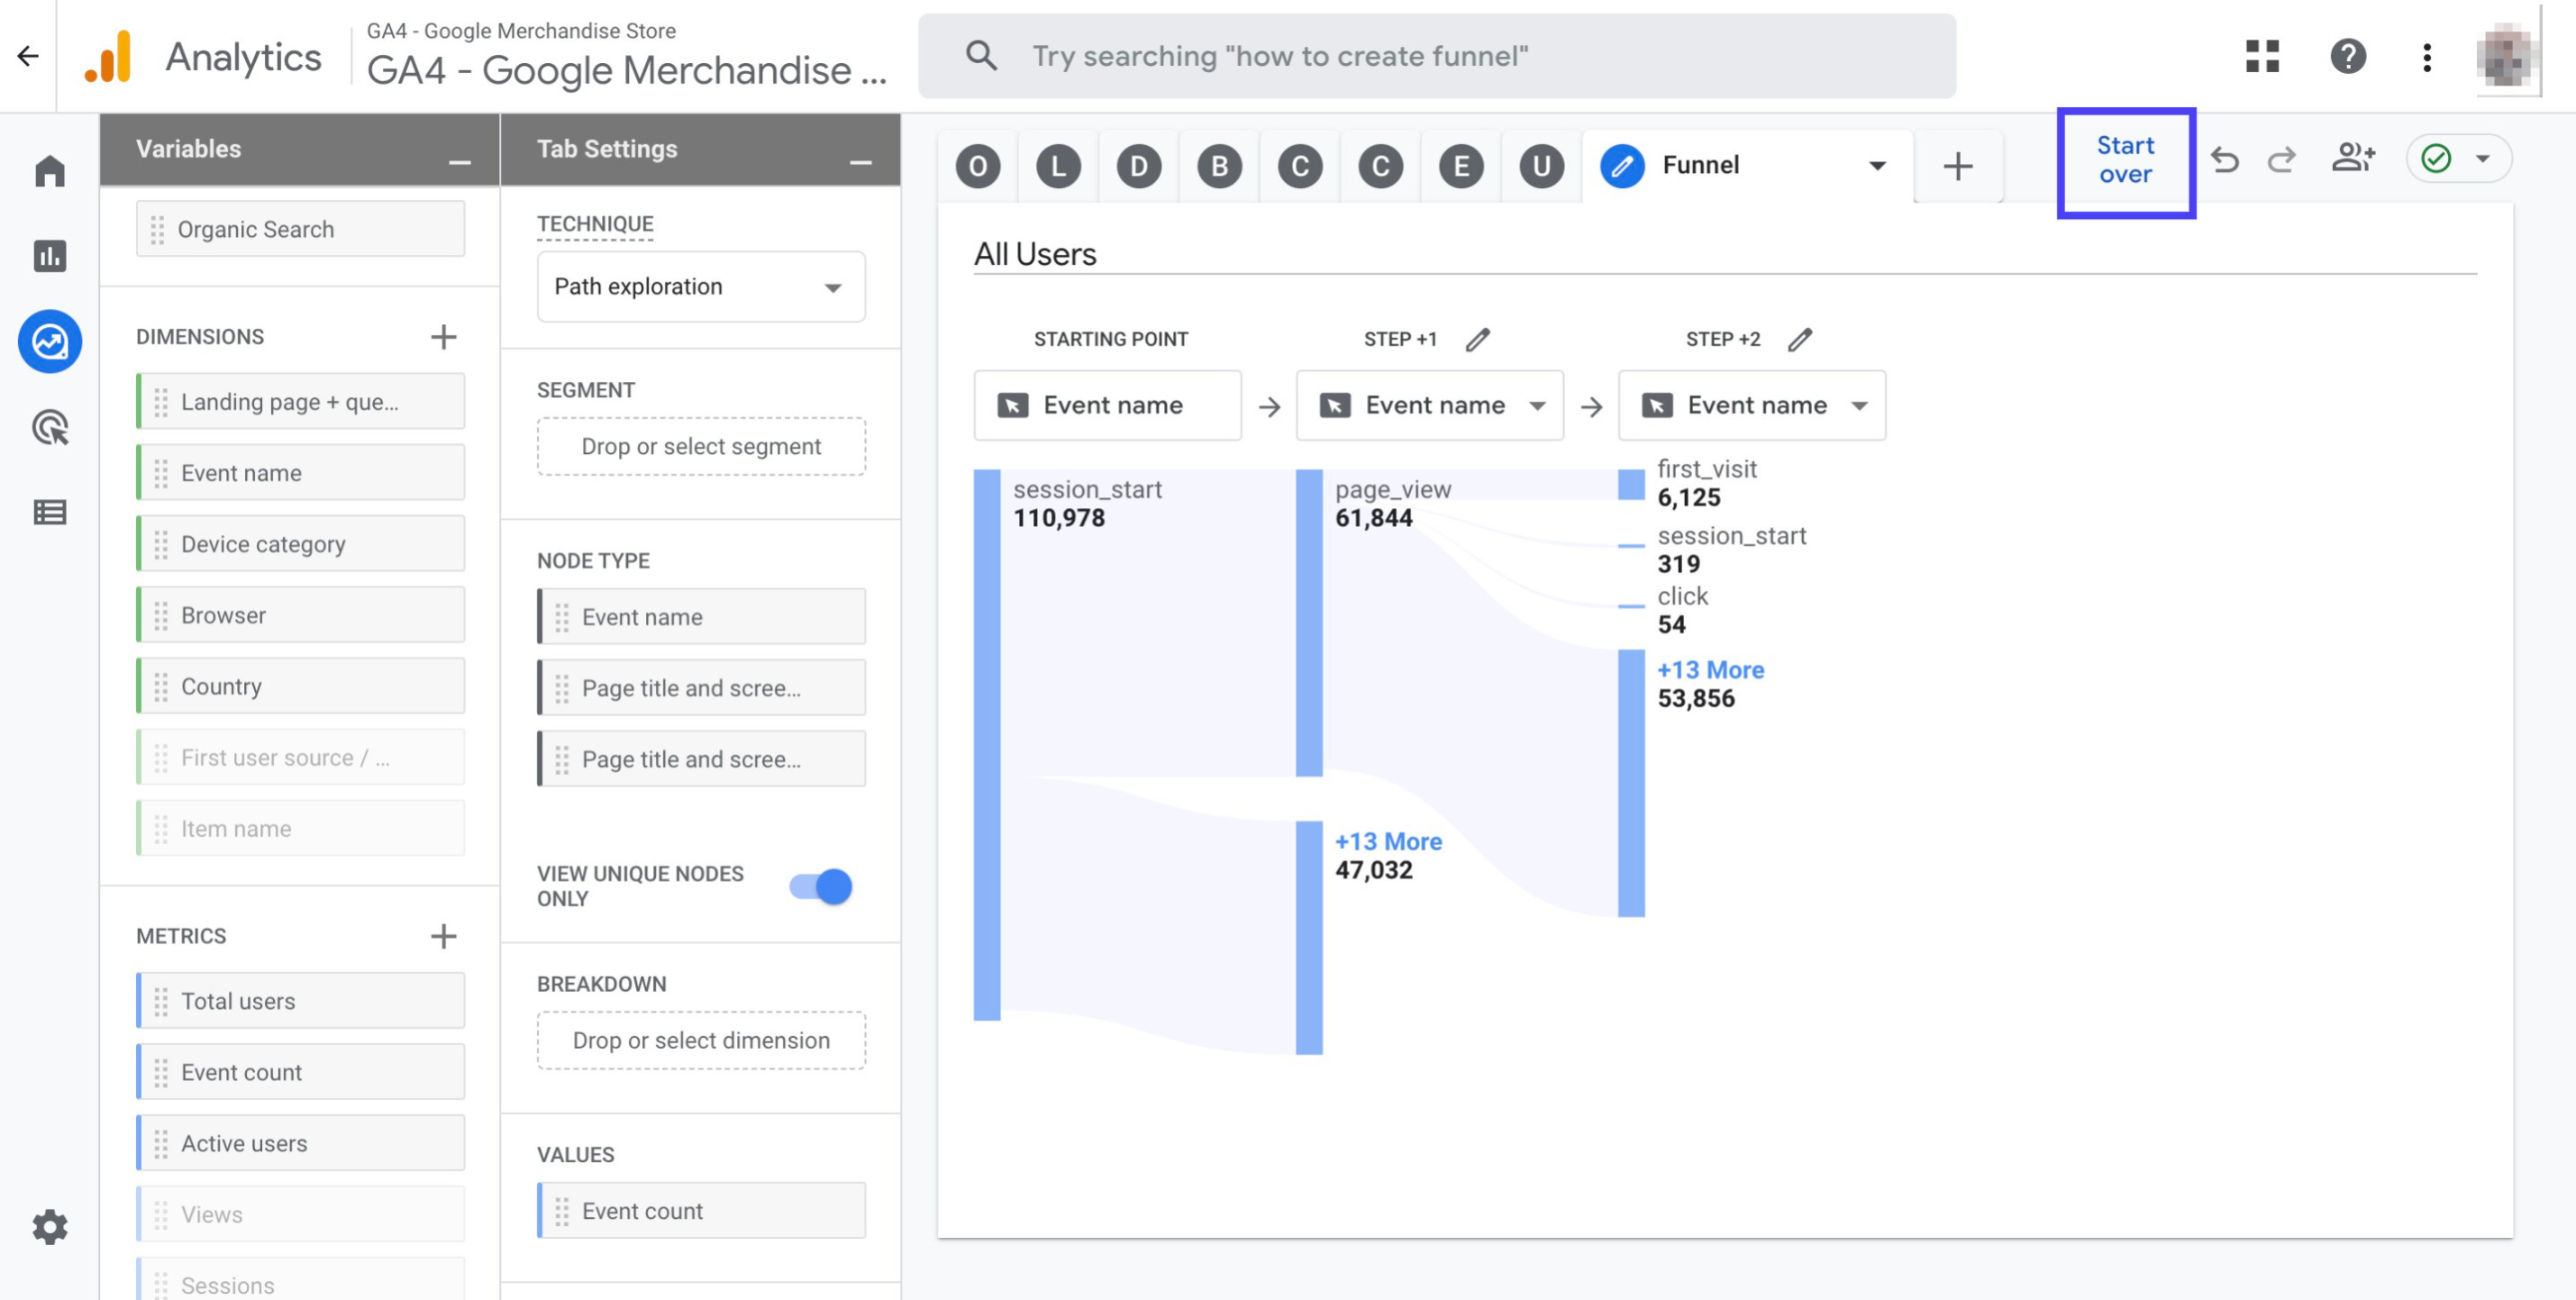
Click on 'Start over' as seen below
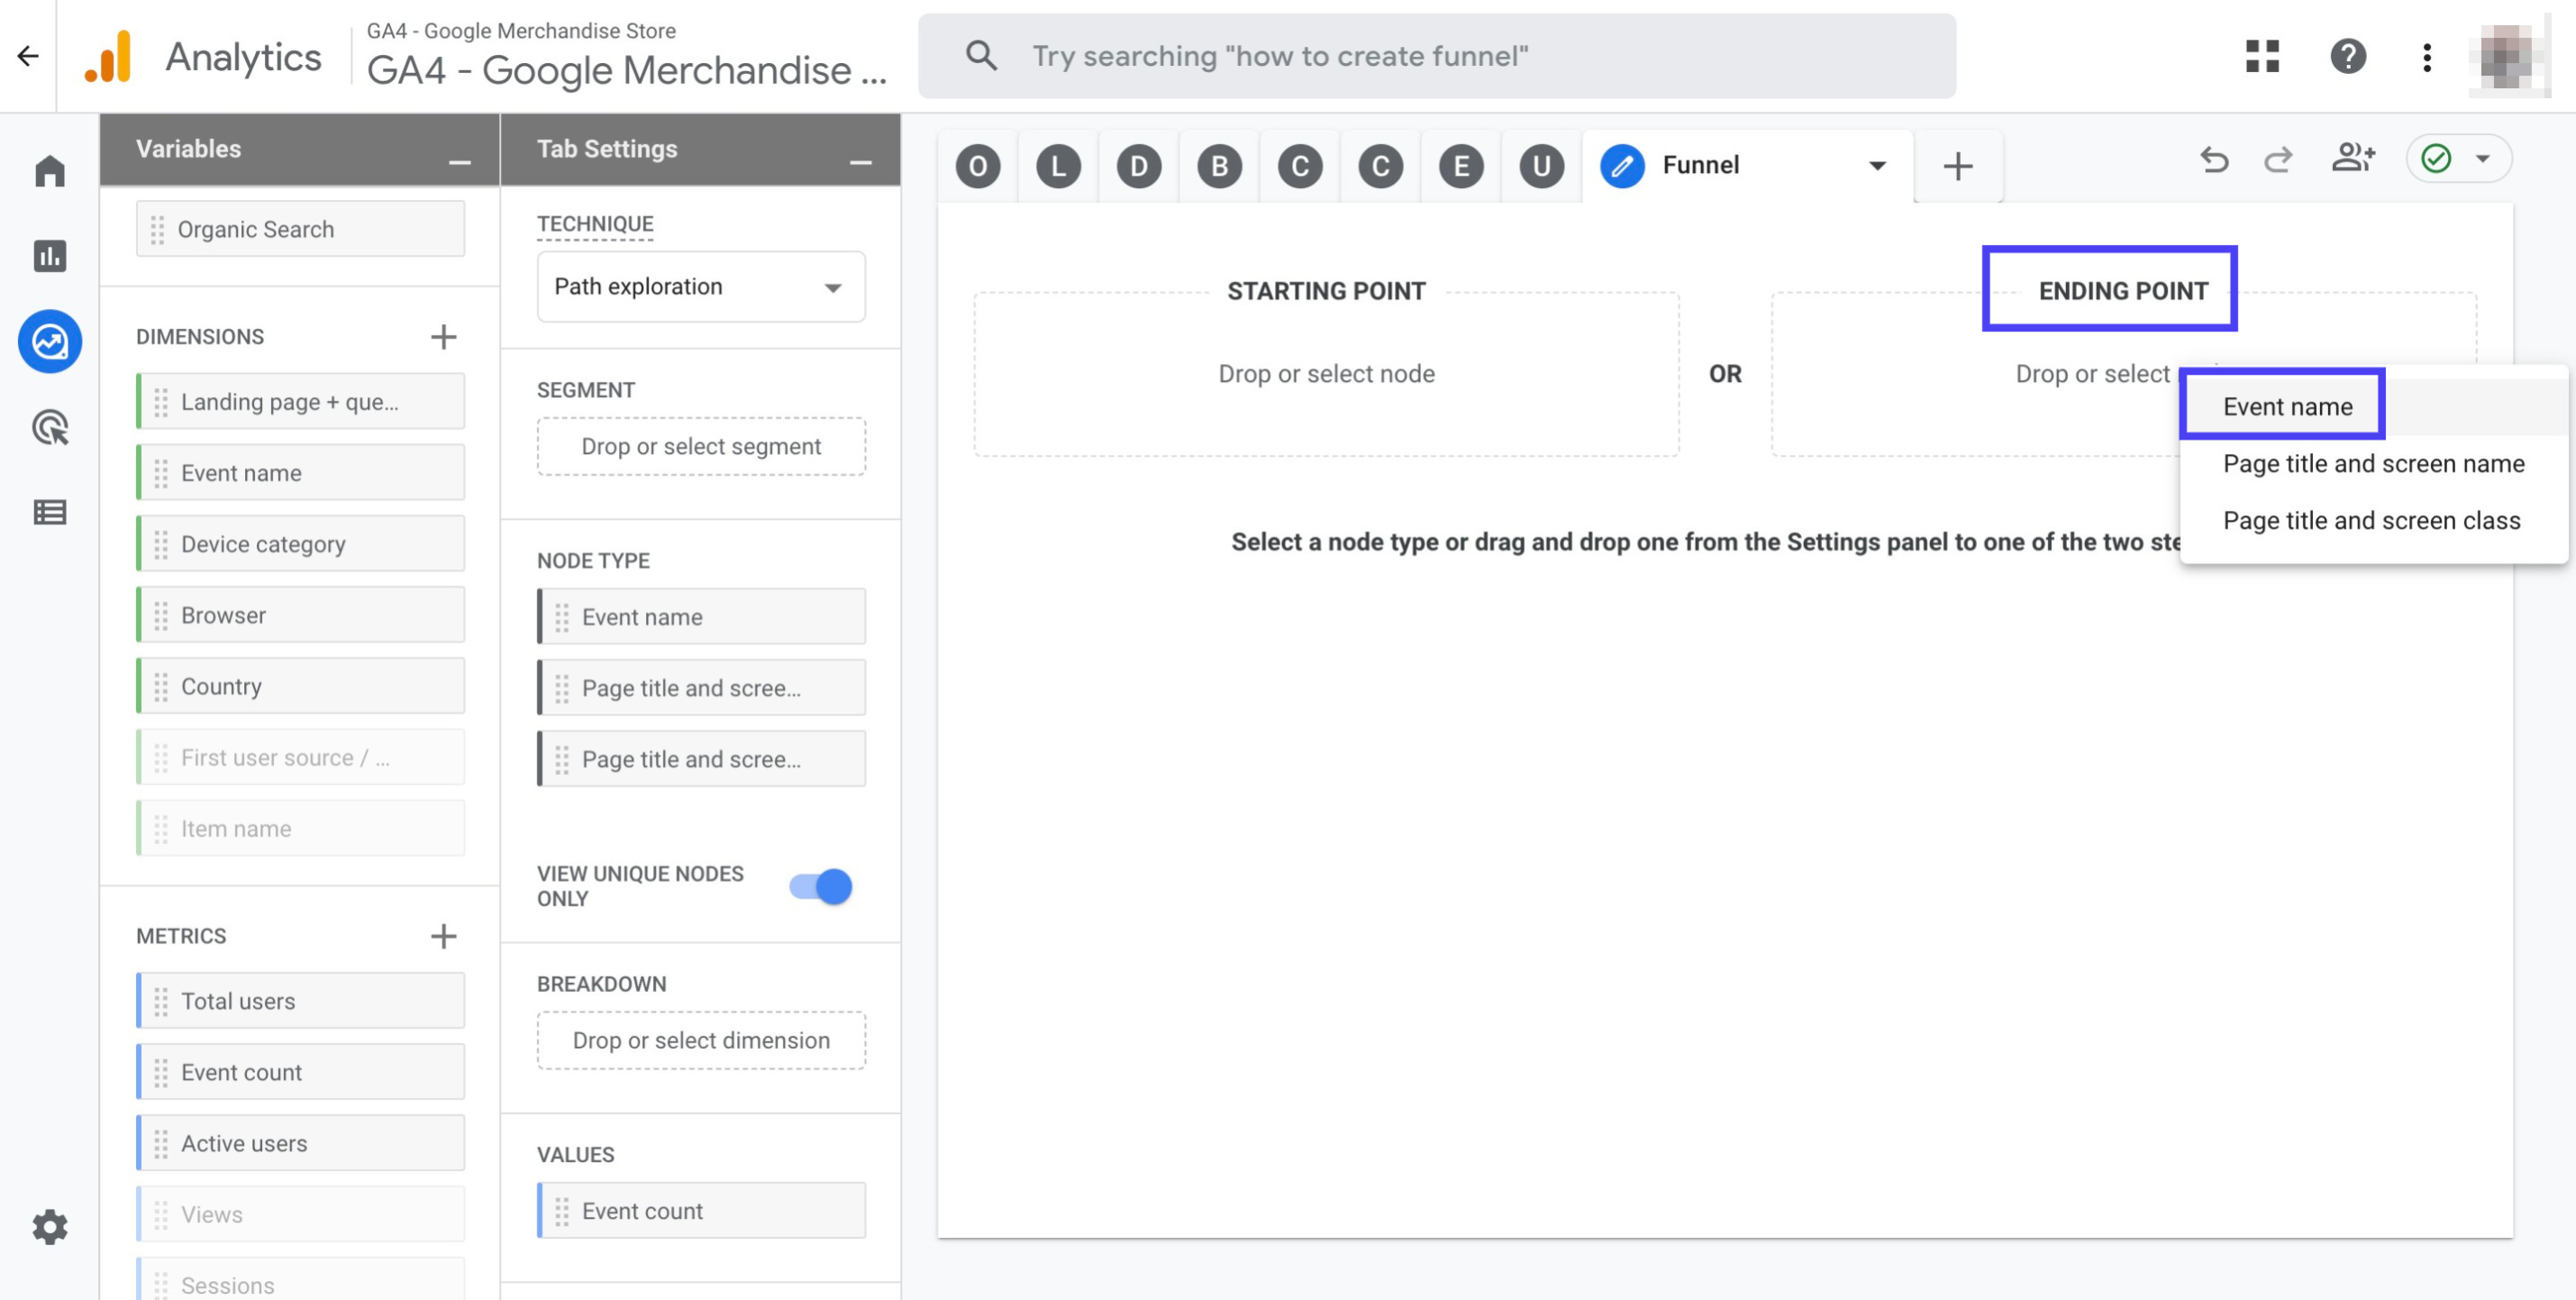
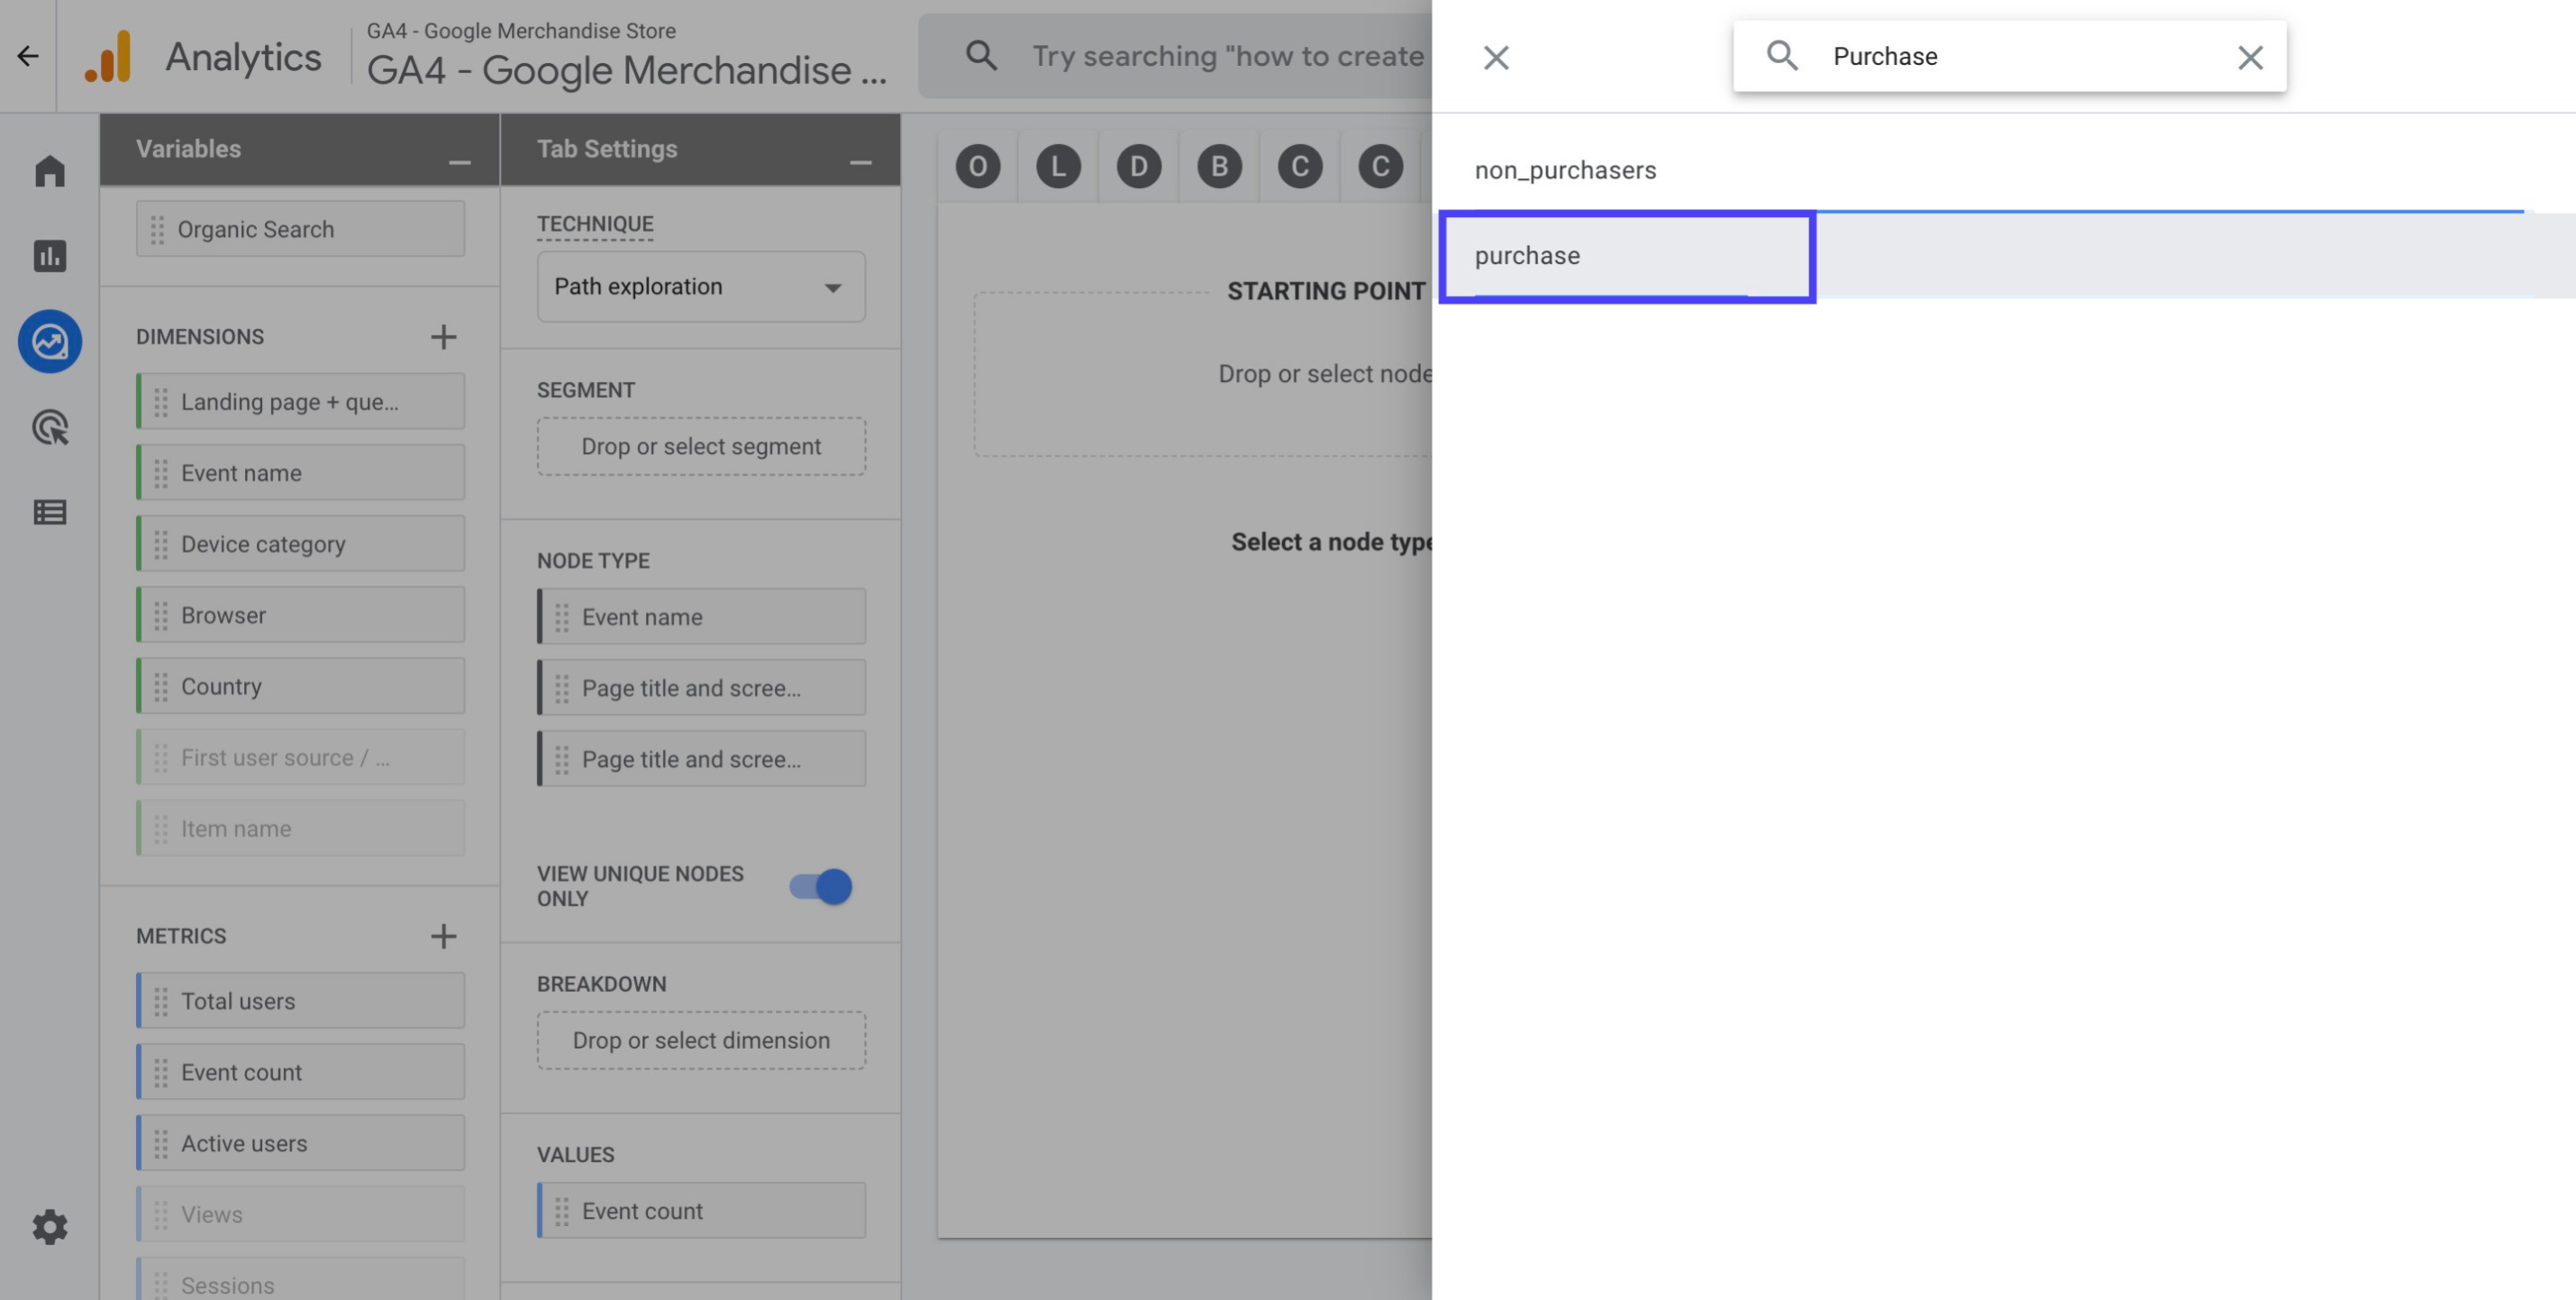
Click 'Drop or select node' under 'Ending Point', then choose 'Event name'
Click the magnifying glass icon and then search for 'Purchase'
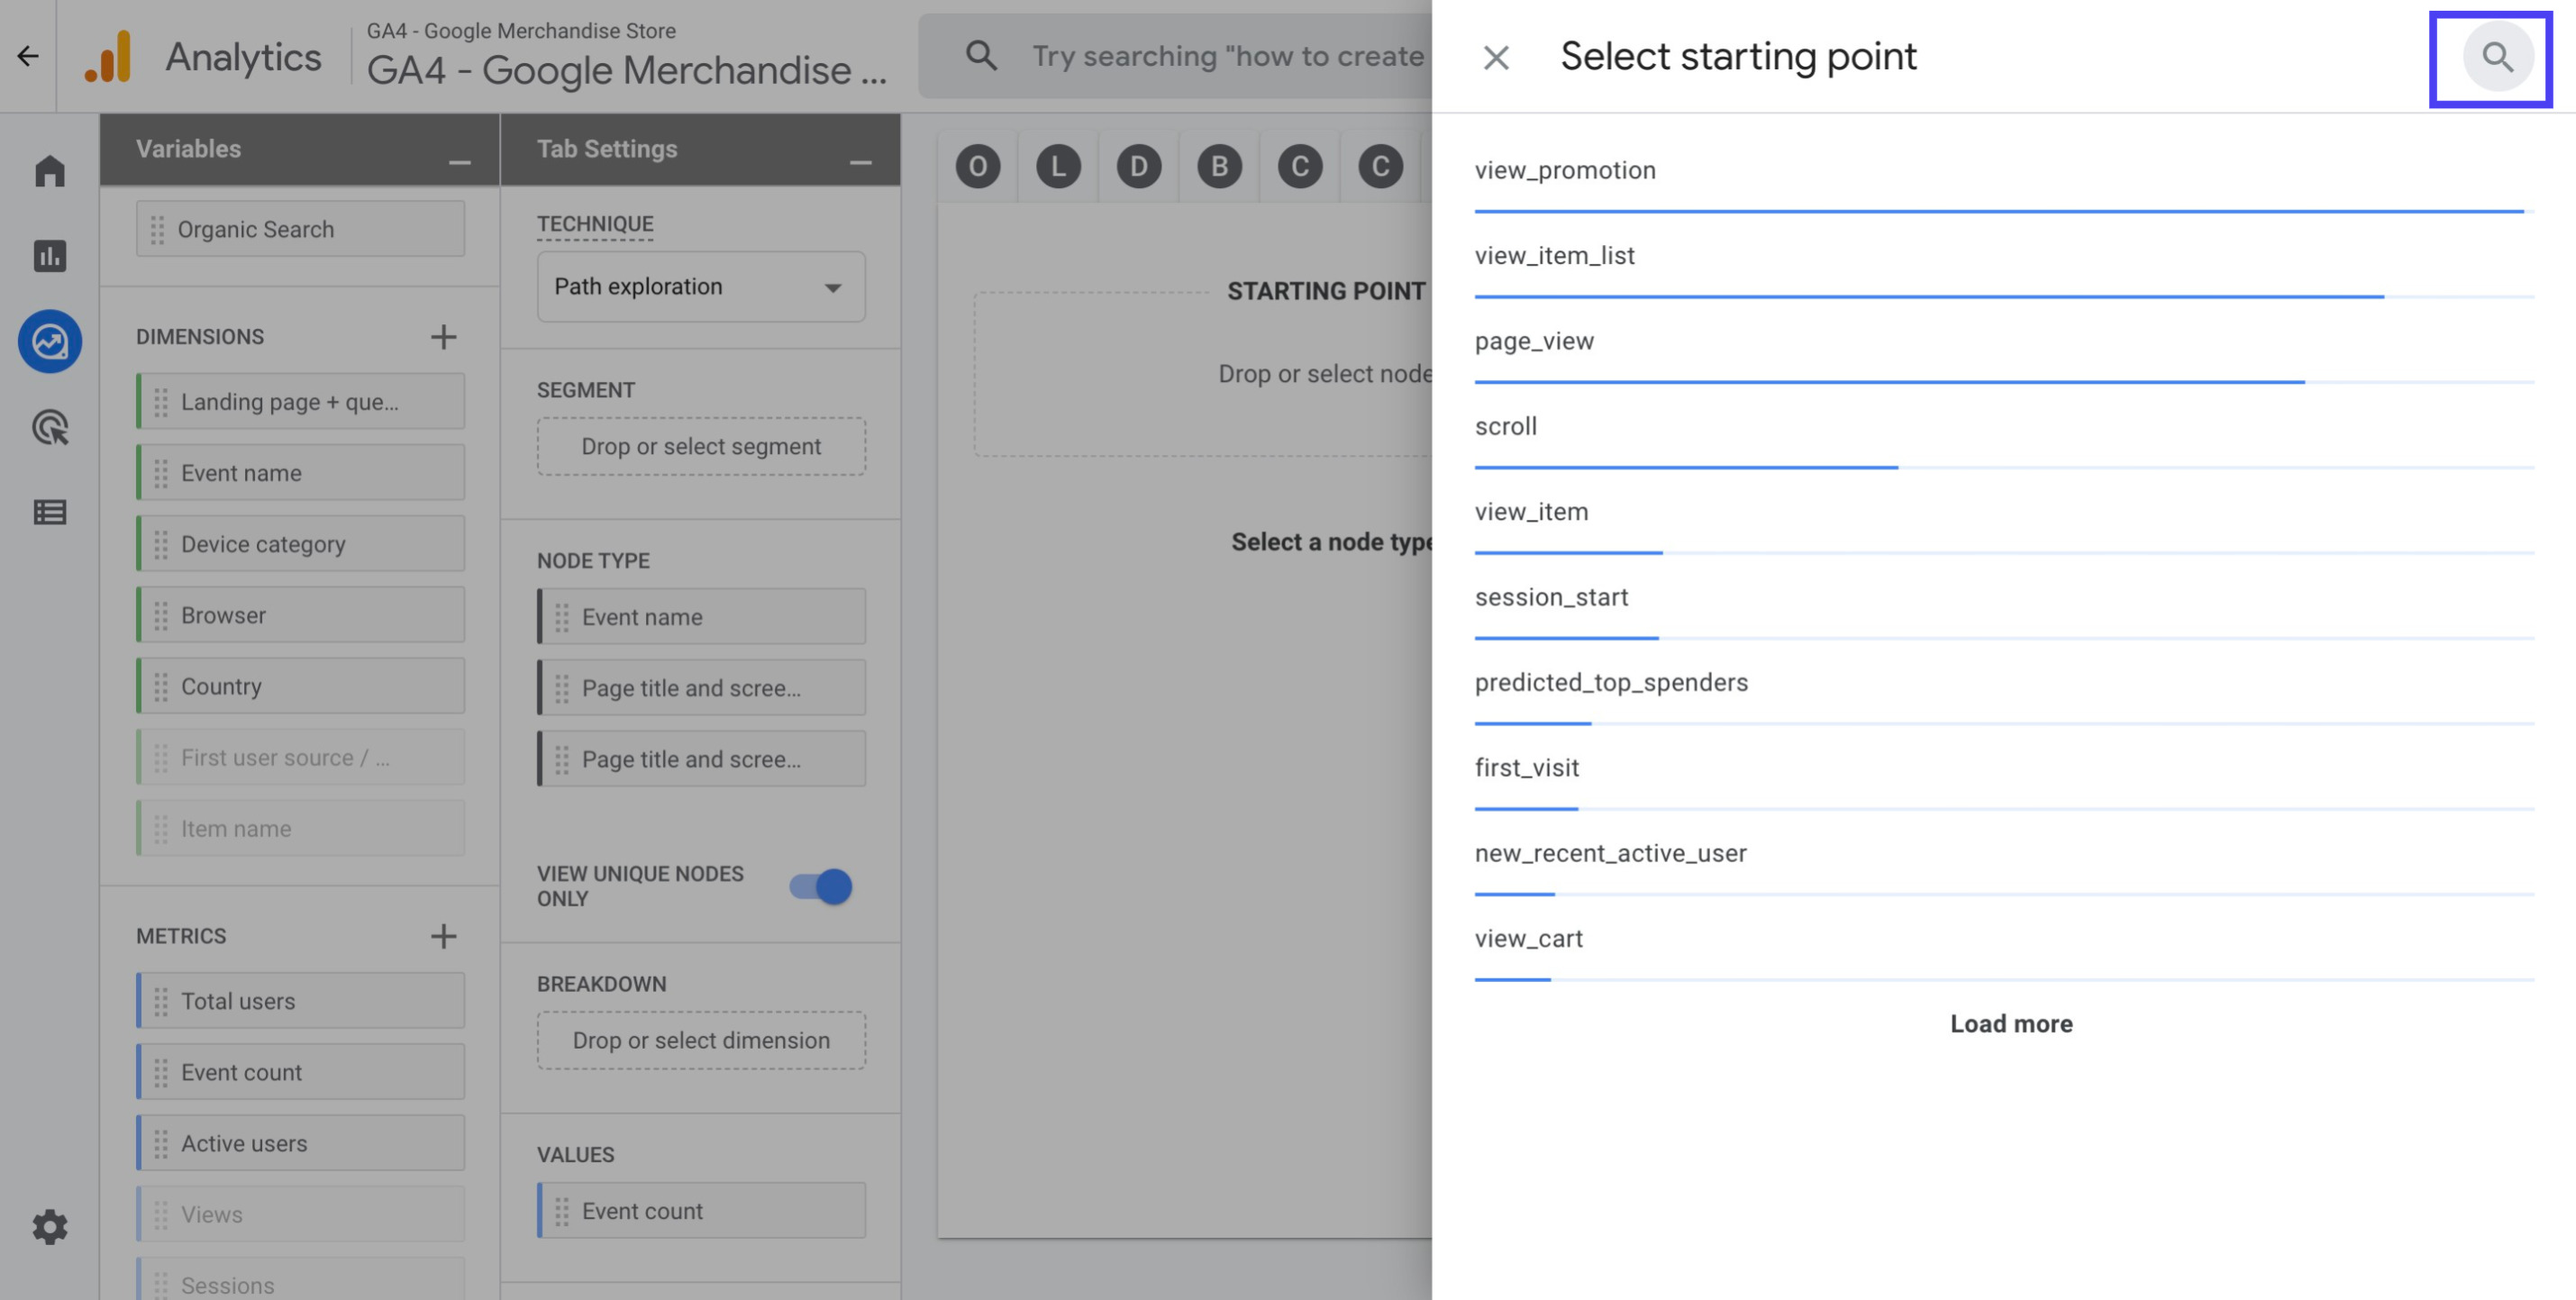
Choose 'Purchase' from the search results
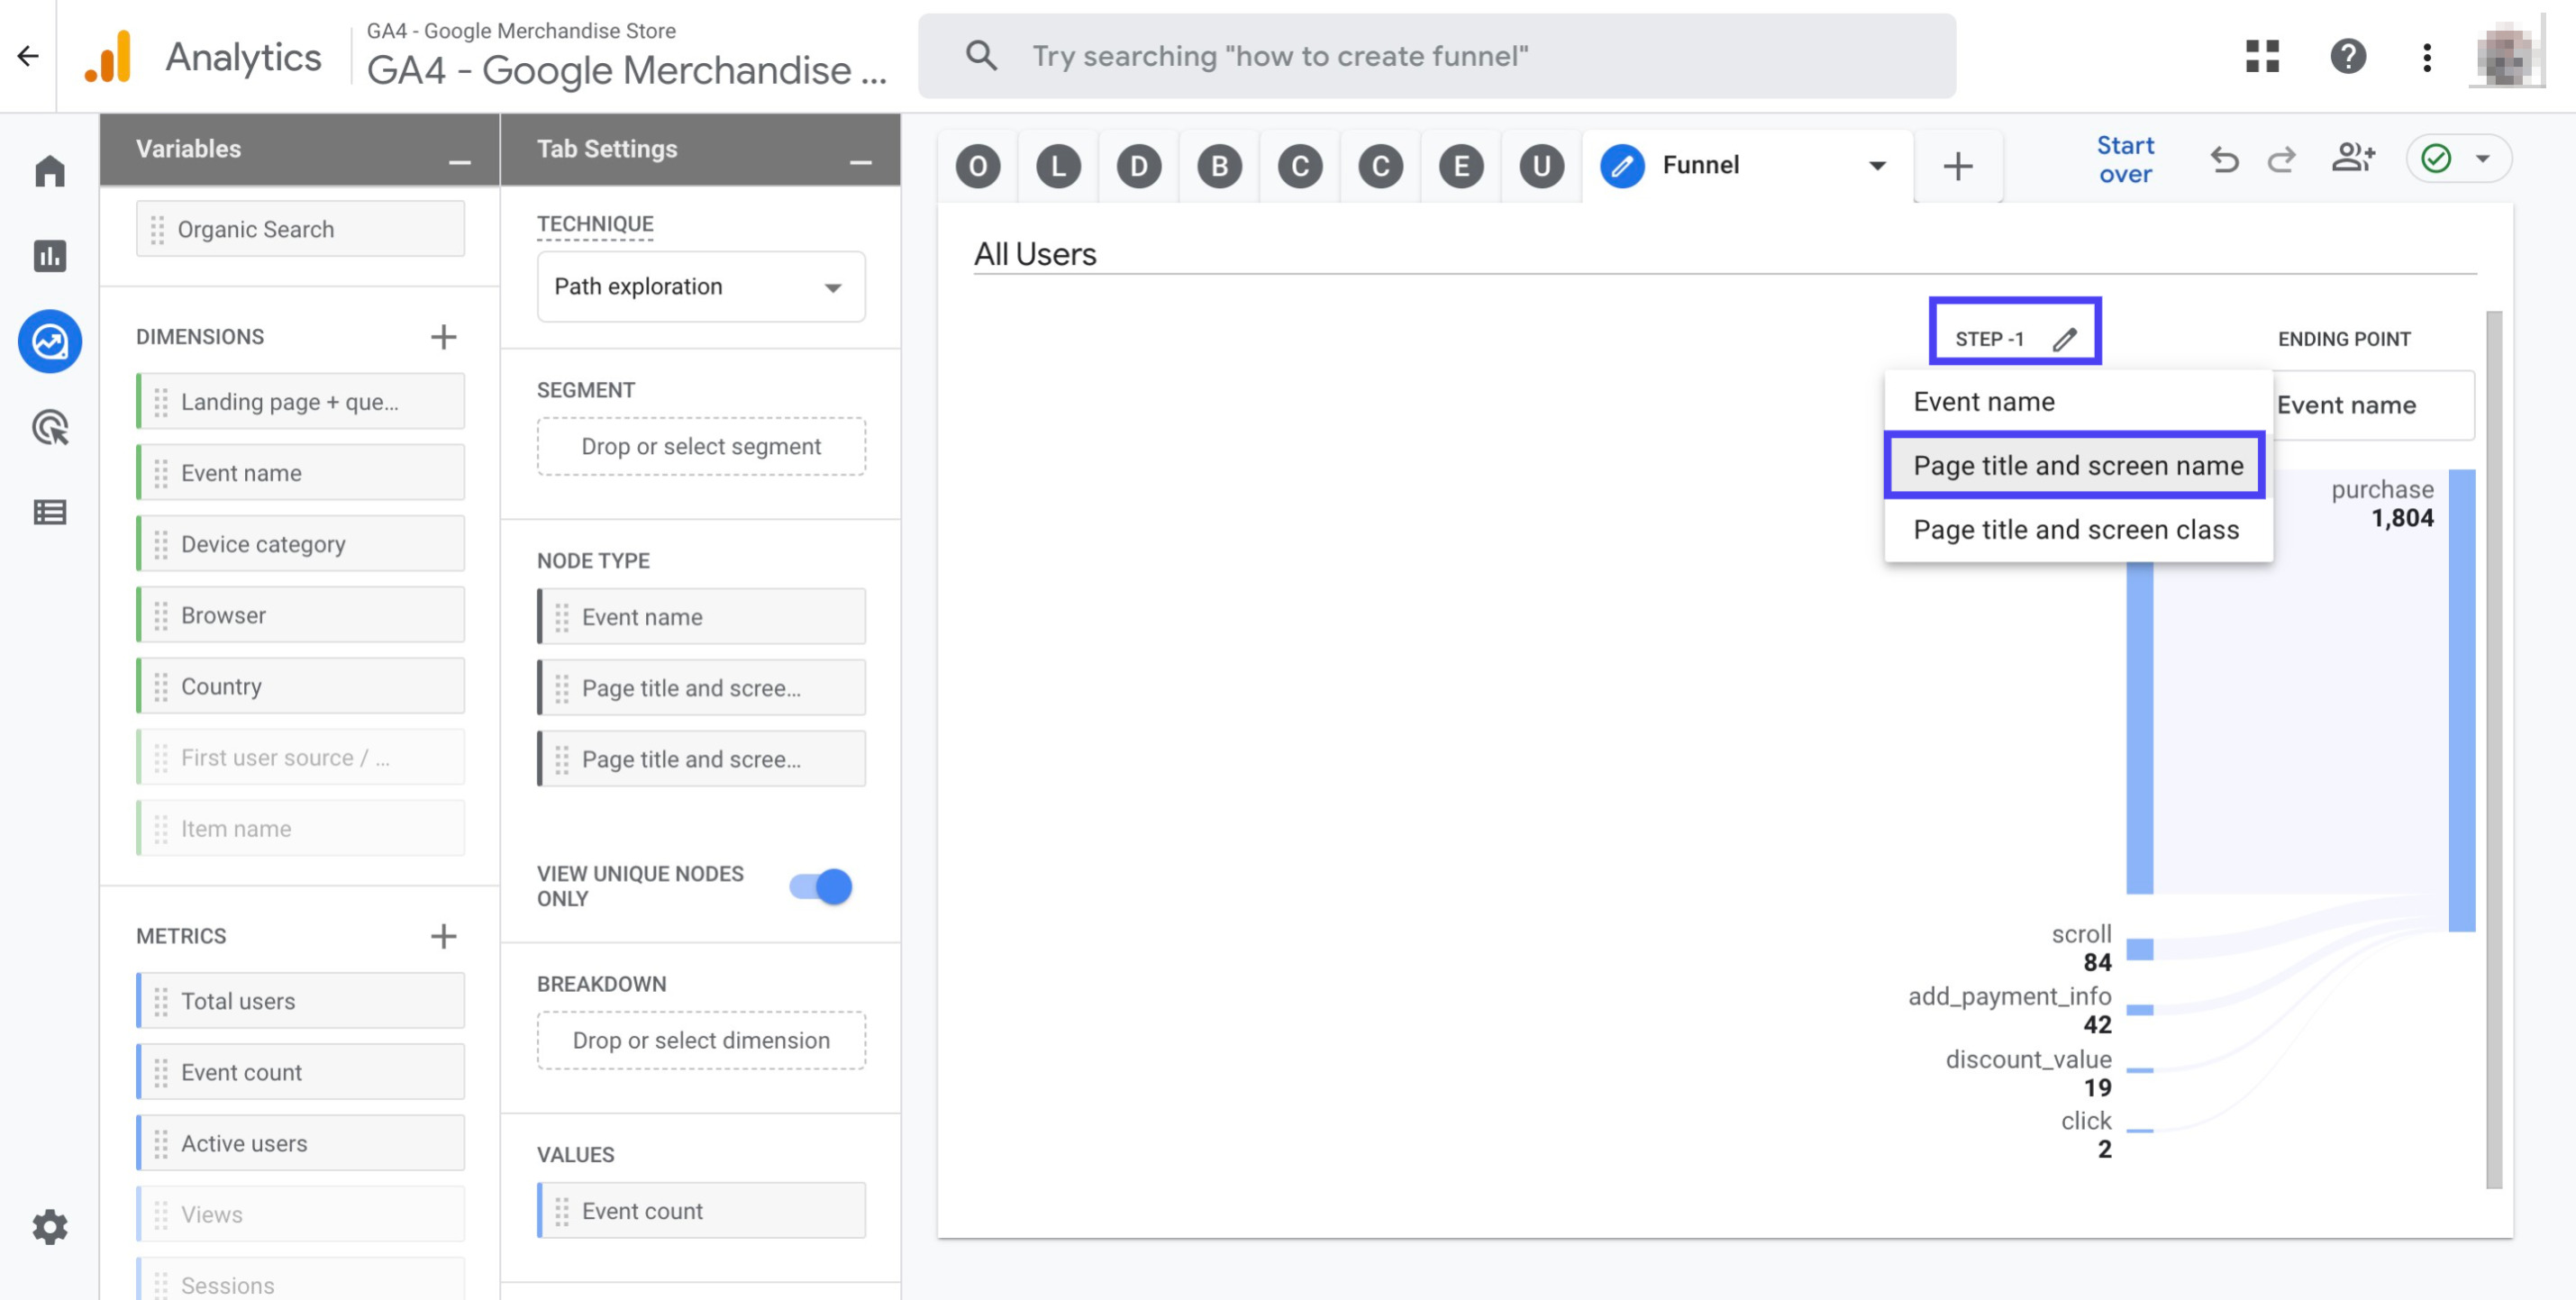
Click 'Page title and screen name' from the drop down menu that you can see under Step-1
Click on the blue bar found under Step - 1 to create Step - 2. Then you should click Step - 3 to generate other steps
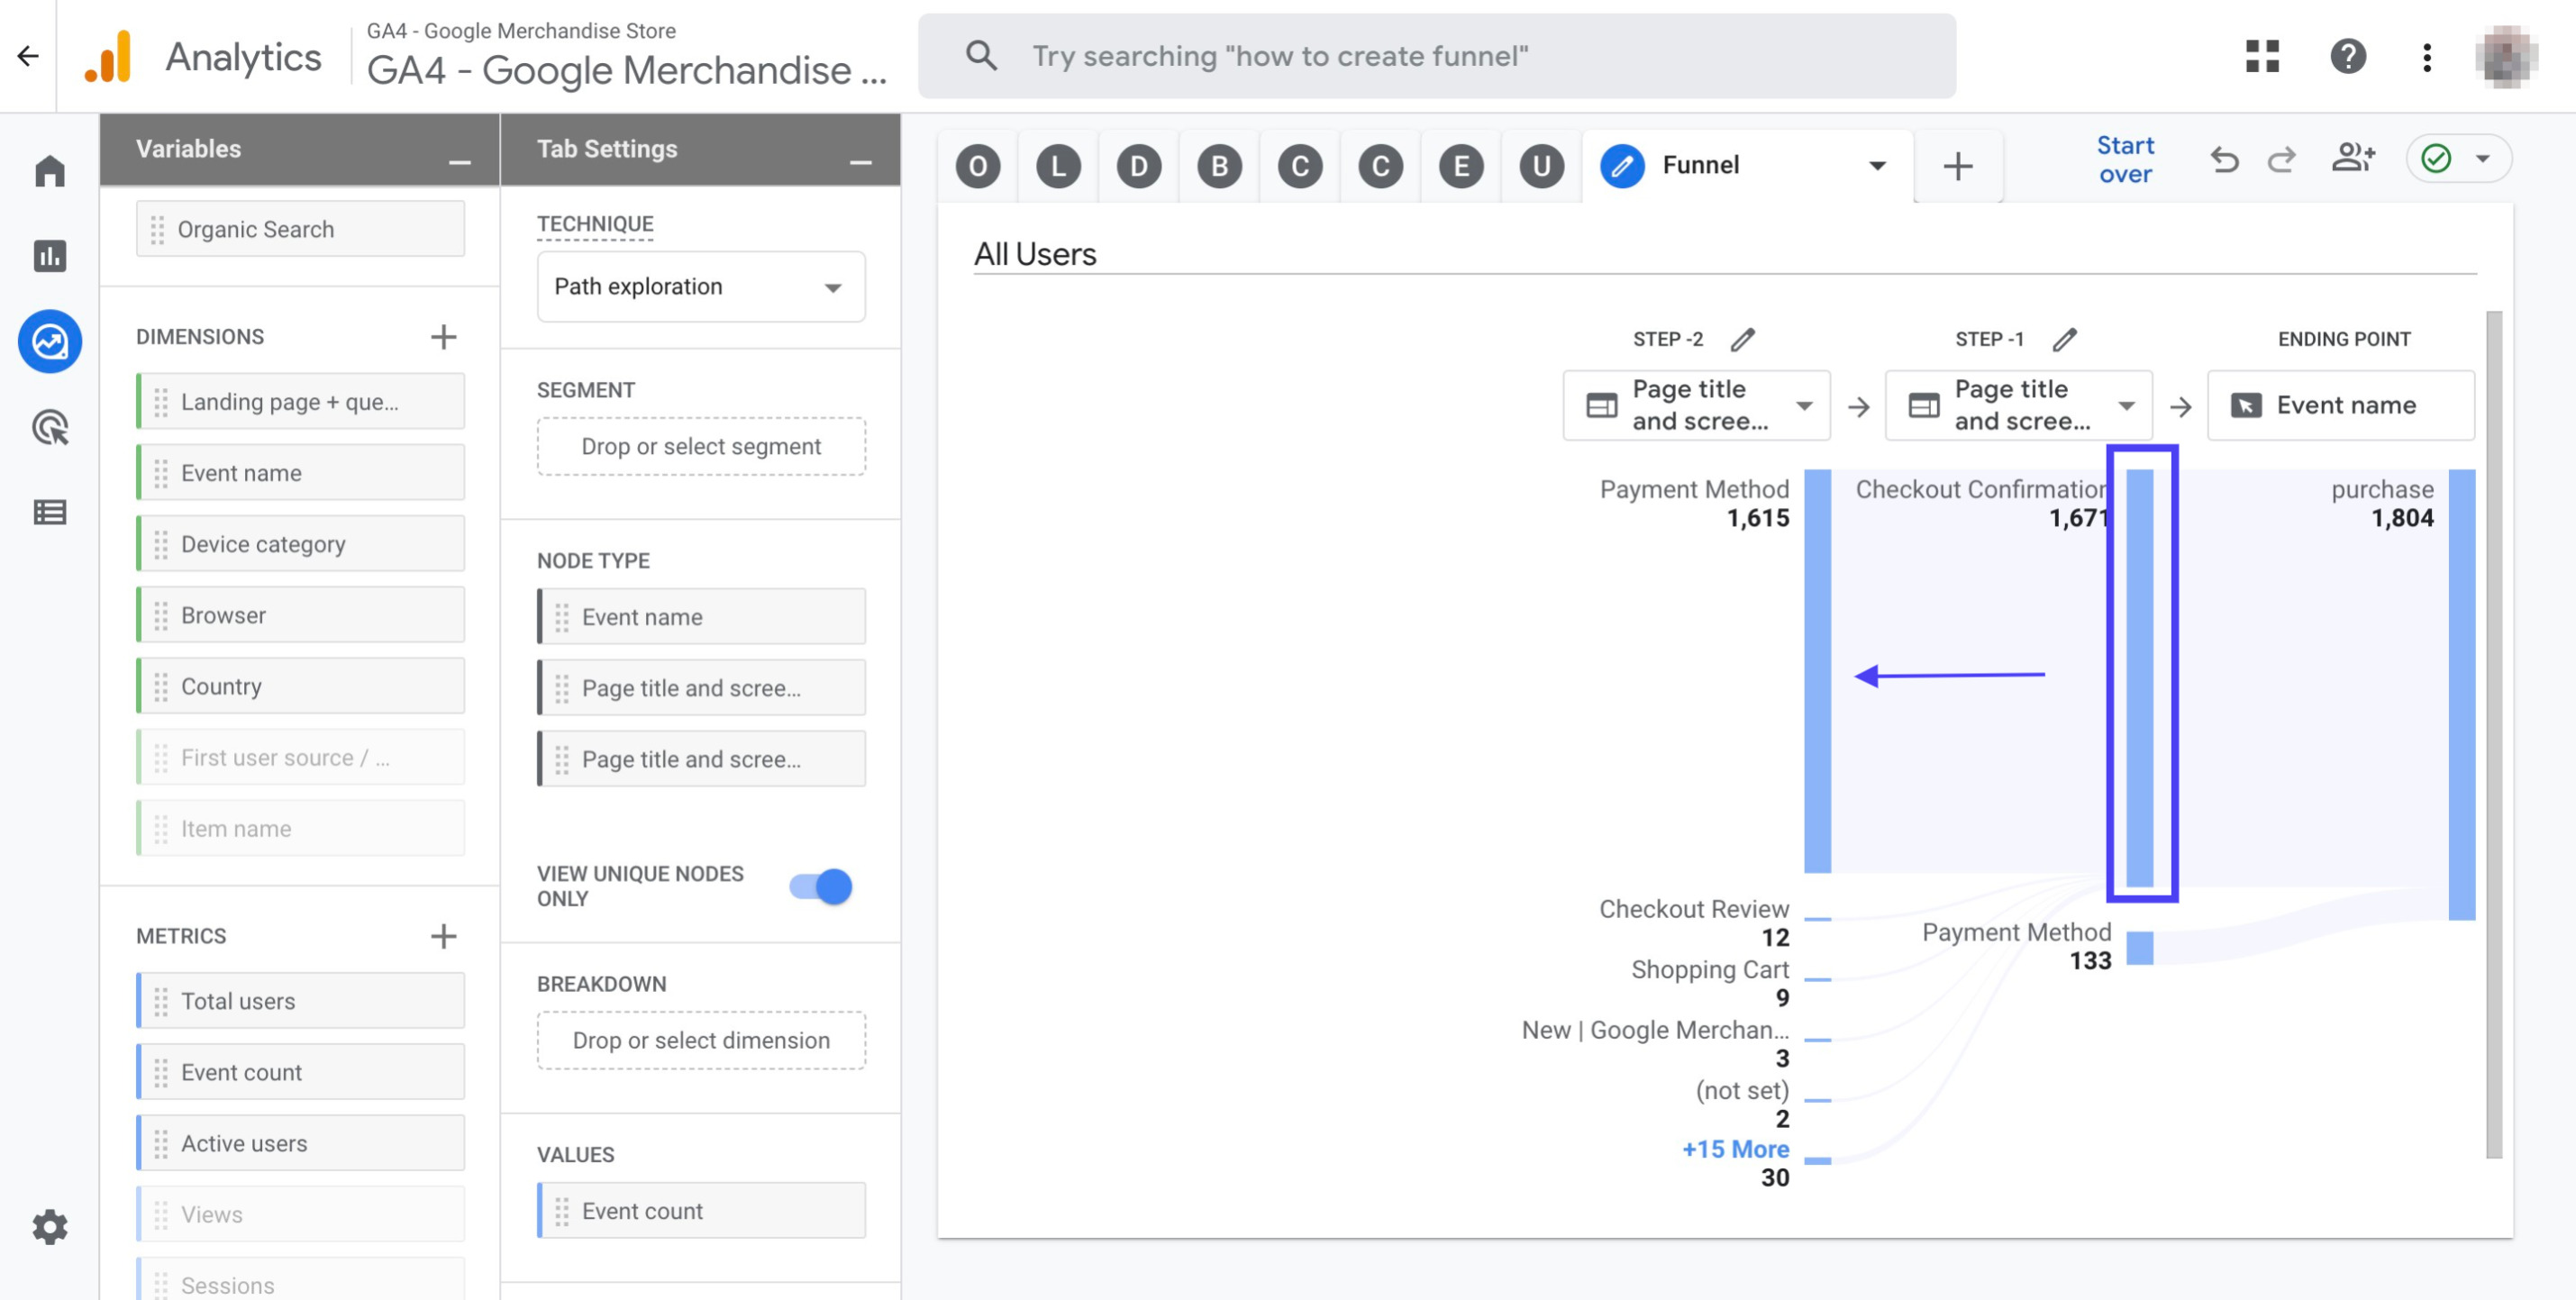
After you create steps as seen in the graphic, double click 'Organic search' to add it to your report
Double click the dimension 'Device category' to add it to your report
Remove the metric 'Event Count' by clicking the cross sign right next to it
Double click the metric 'Total users' to add it to your report
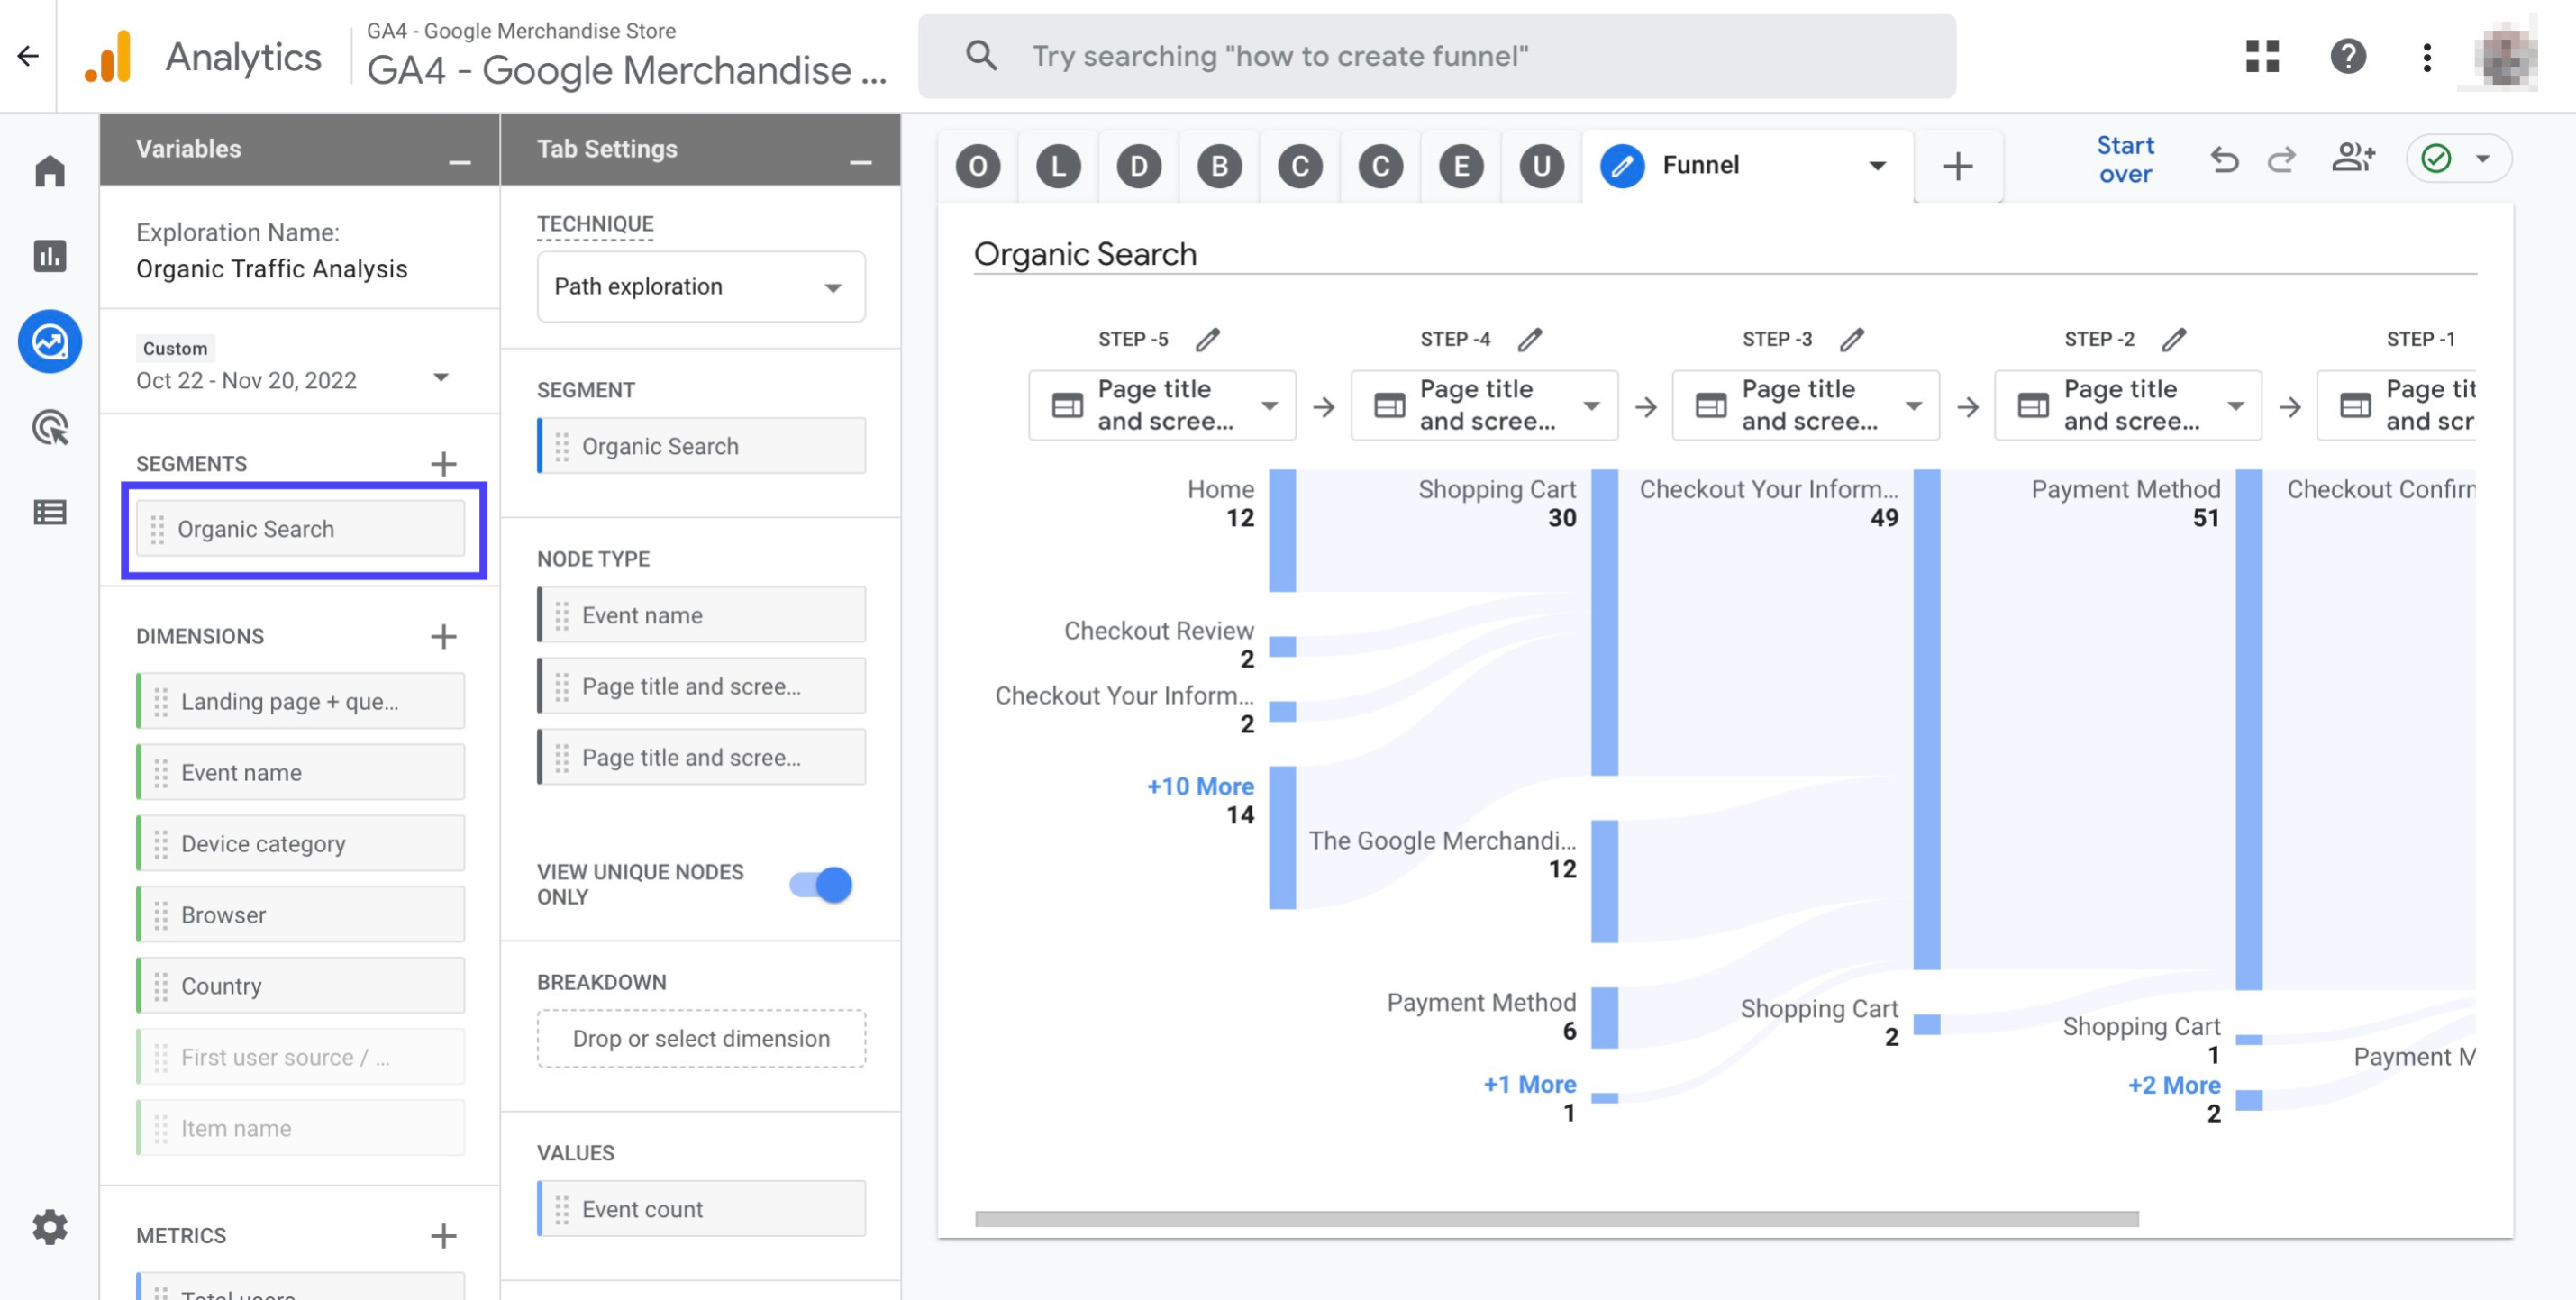
Now that you have created a set of reports for Organic Traffic Analysis under Exploration, you should be able to see it as shown in the graphic below:
Now, follow the steps below to create email tracking reports in Google Analytics 4:
Navigate to your Google Analytics 4 property, and find 'Explore' on the left menu.
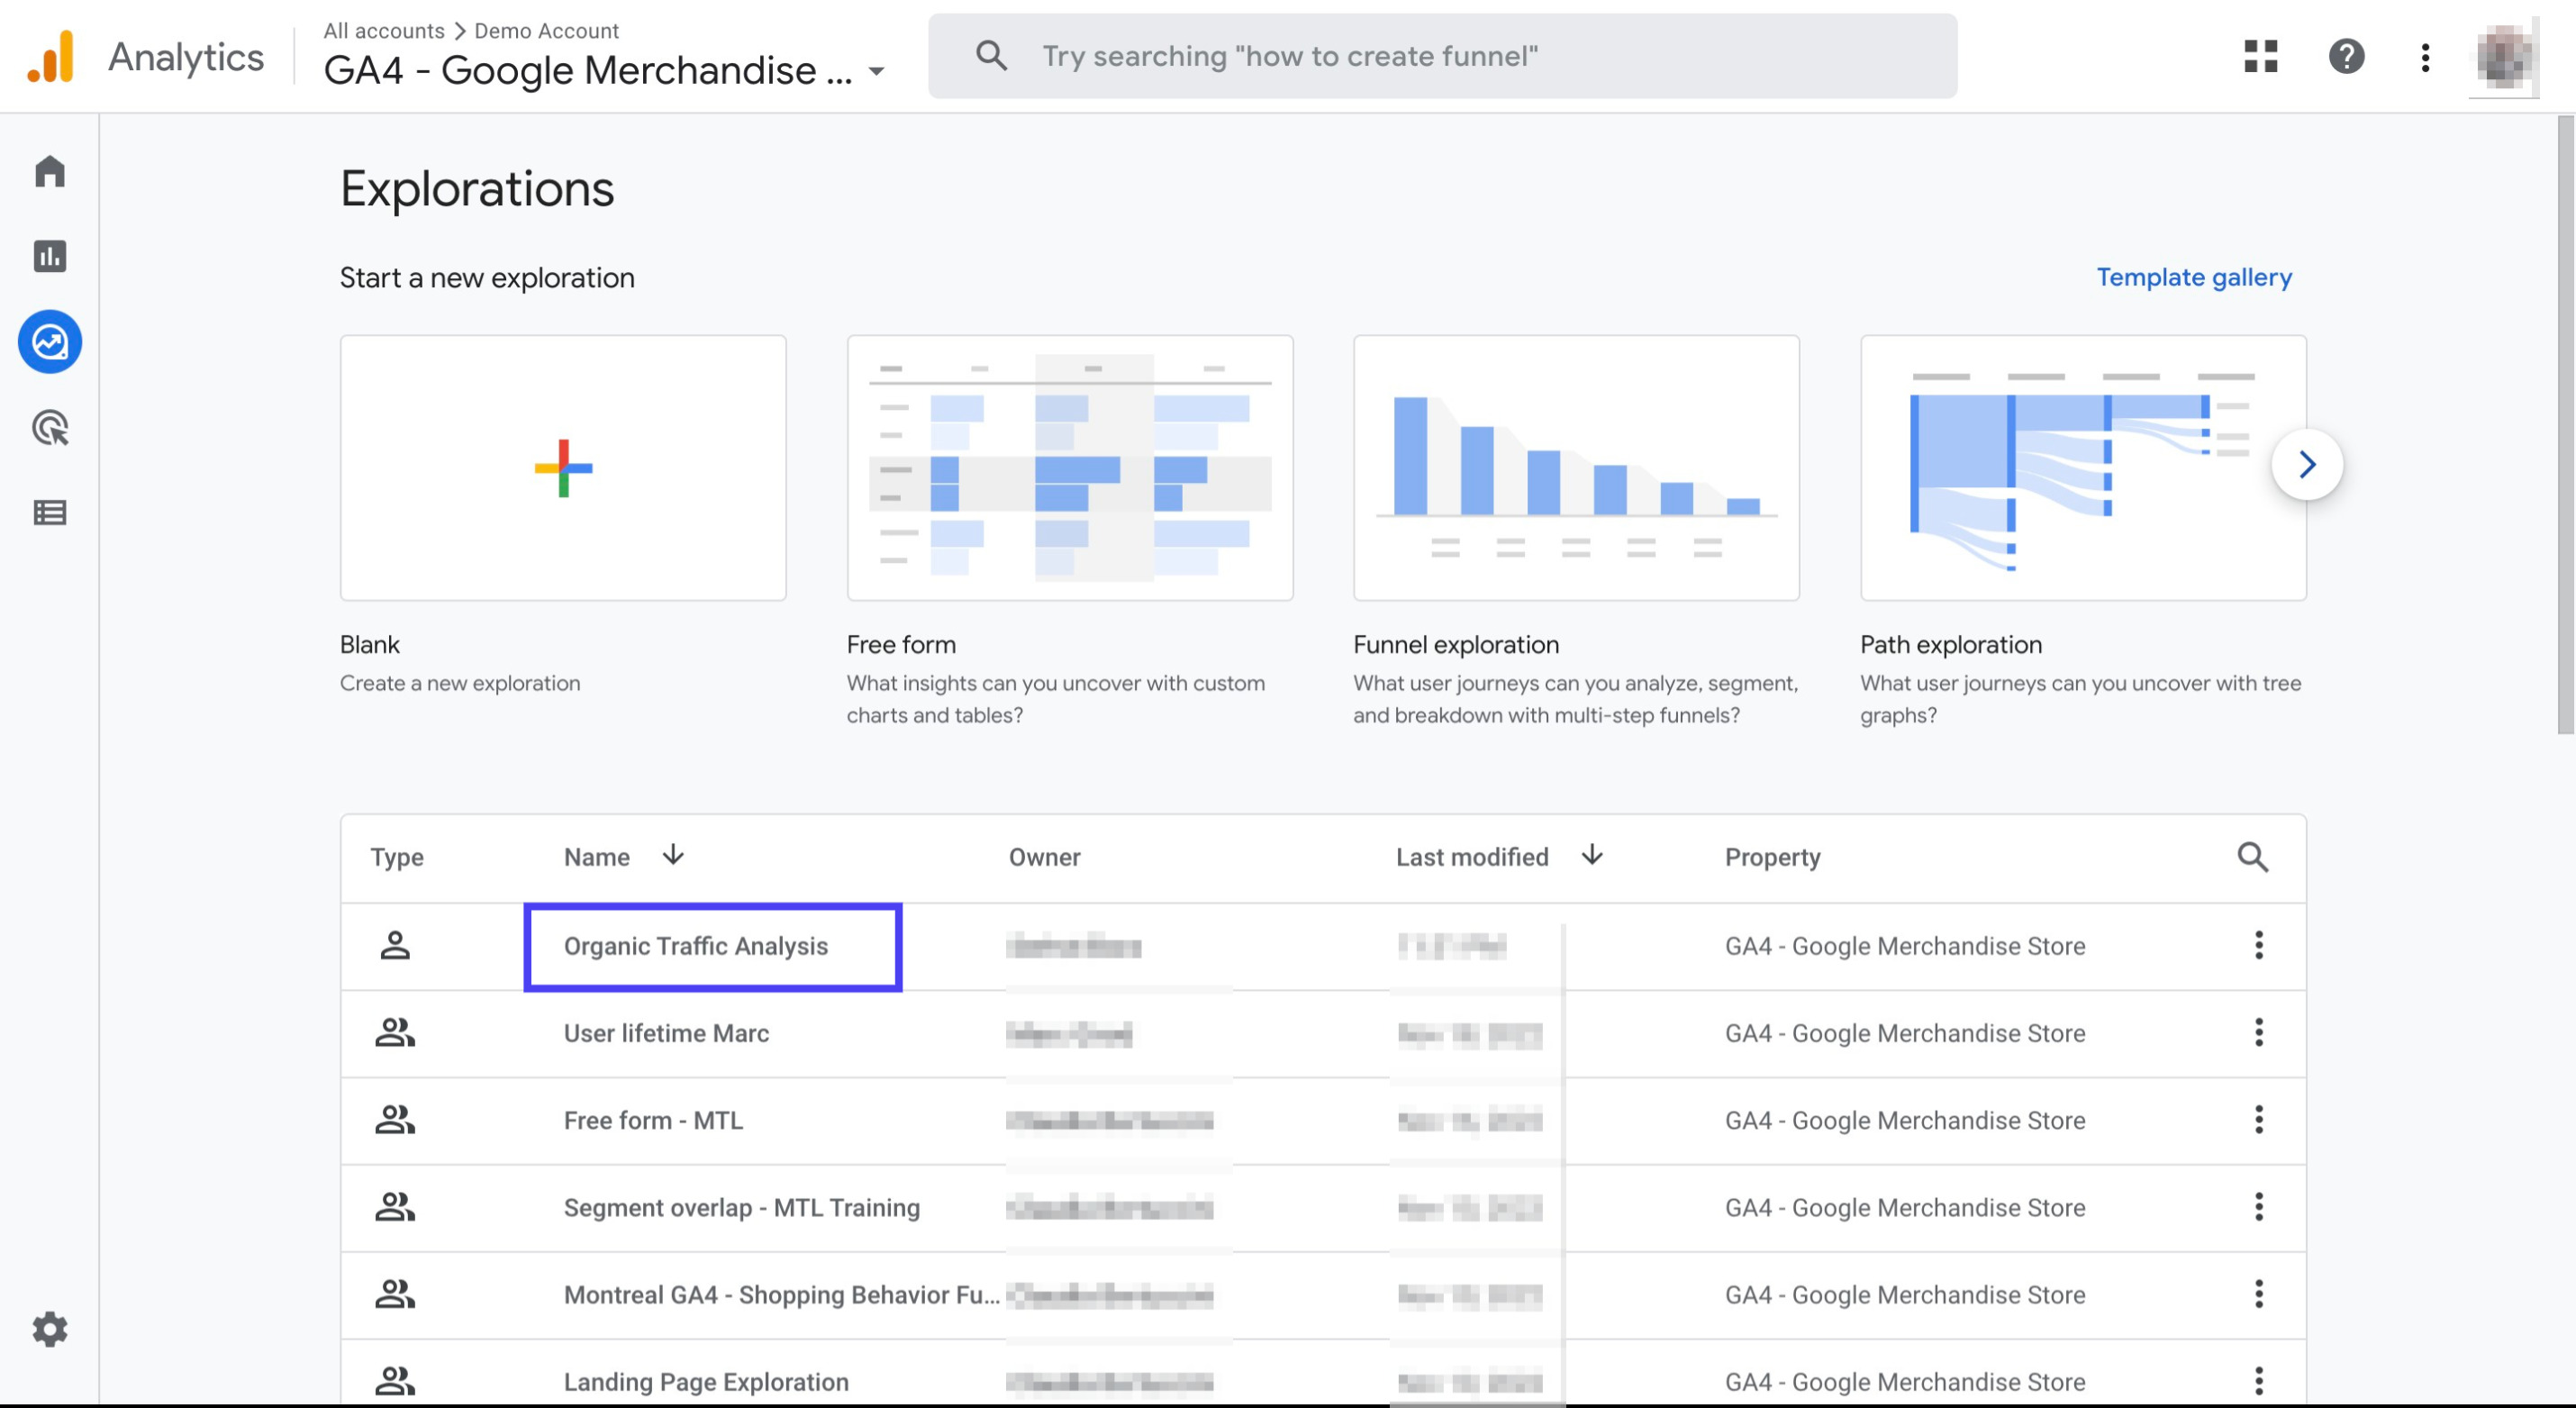
Scroll down and find the report 'Organic Traffic Analysis' that you've just created
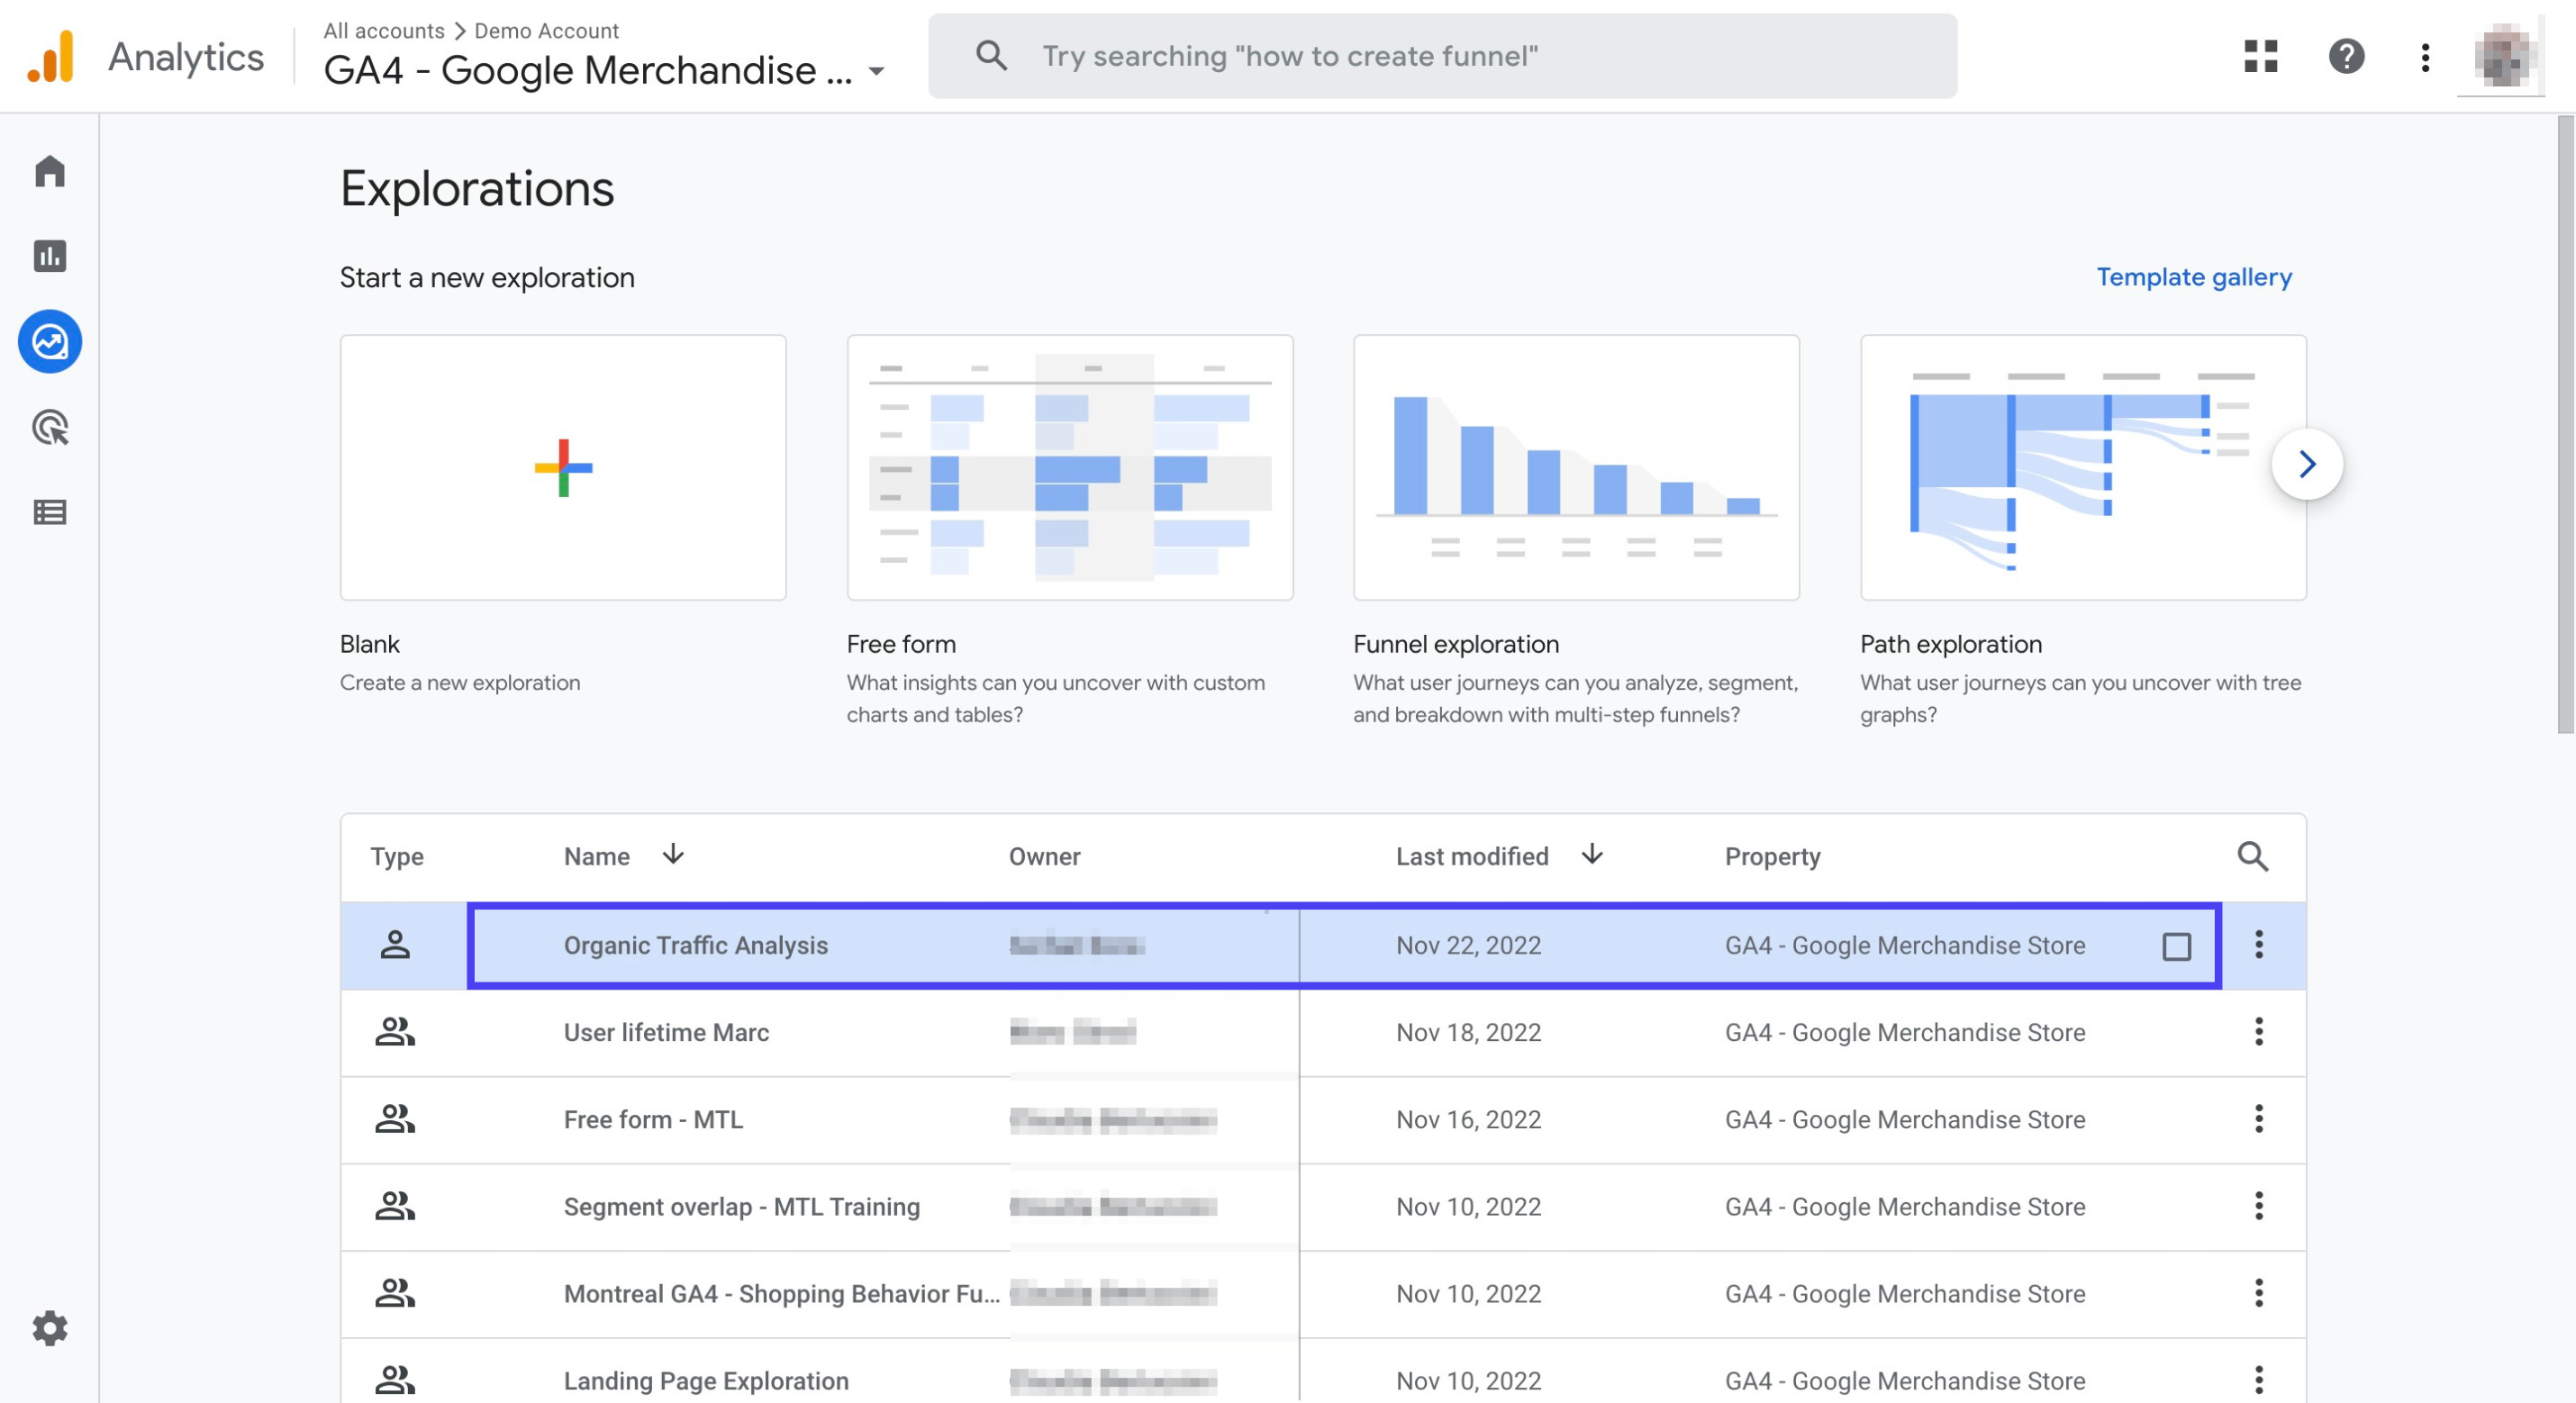
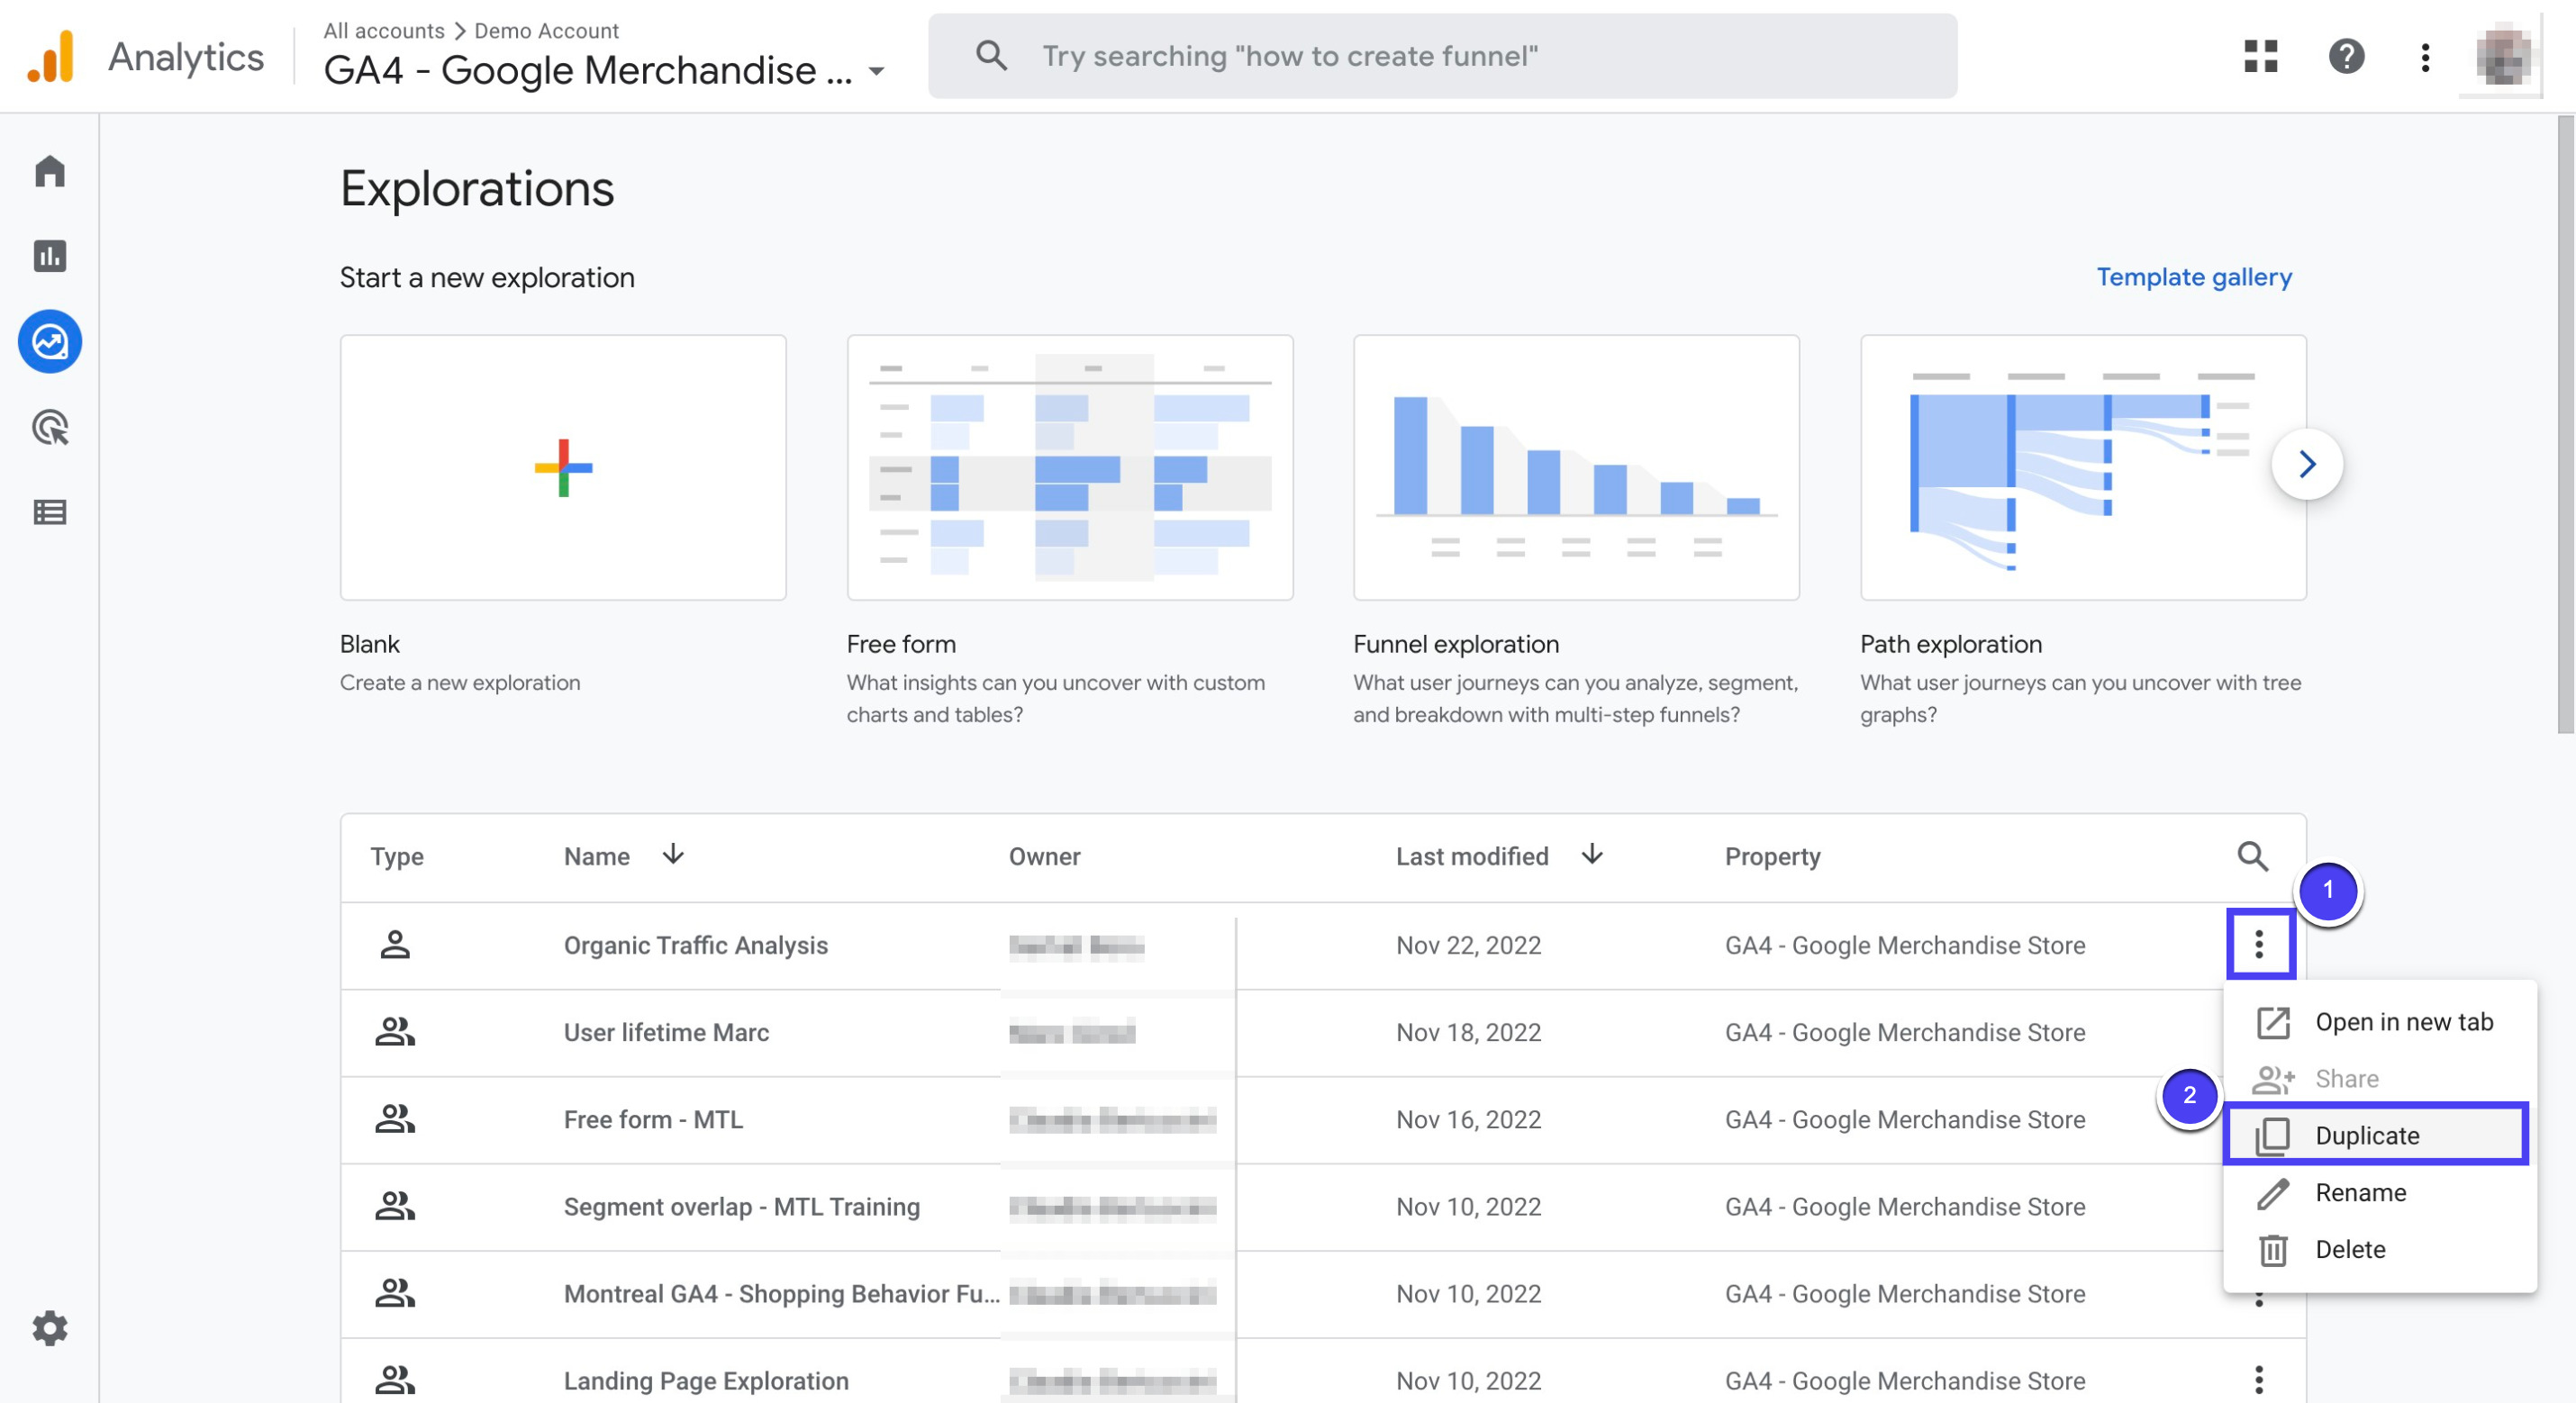
Click on the three dots and select 'Duplicate'. Then, click on the duplicated report to open it
Rename the report as 'Email Traffic Analysis'
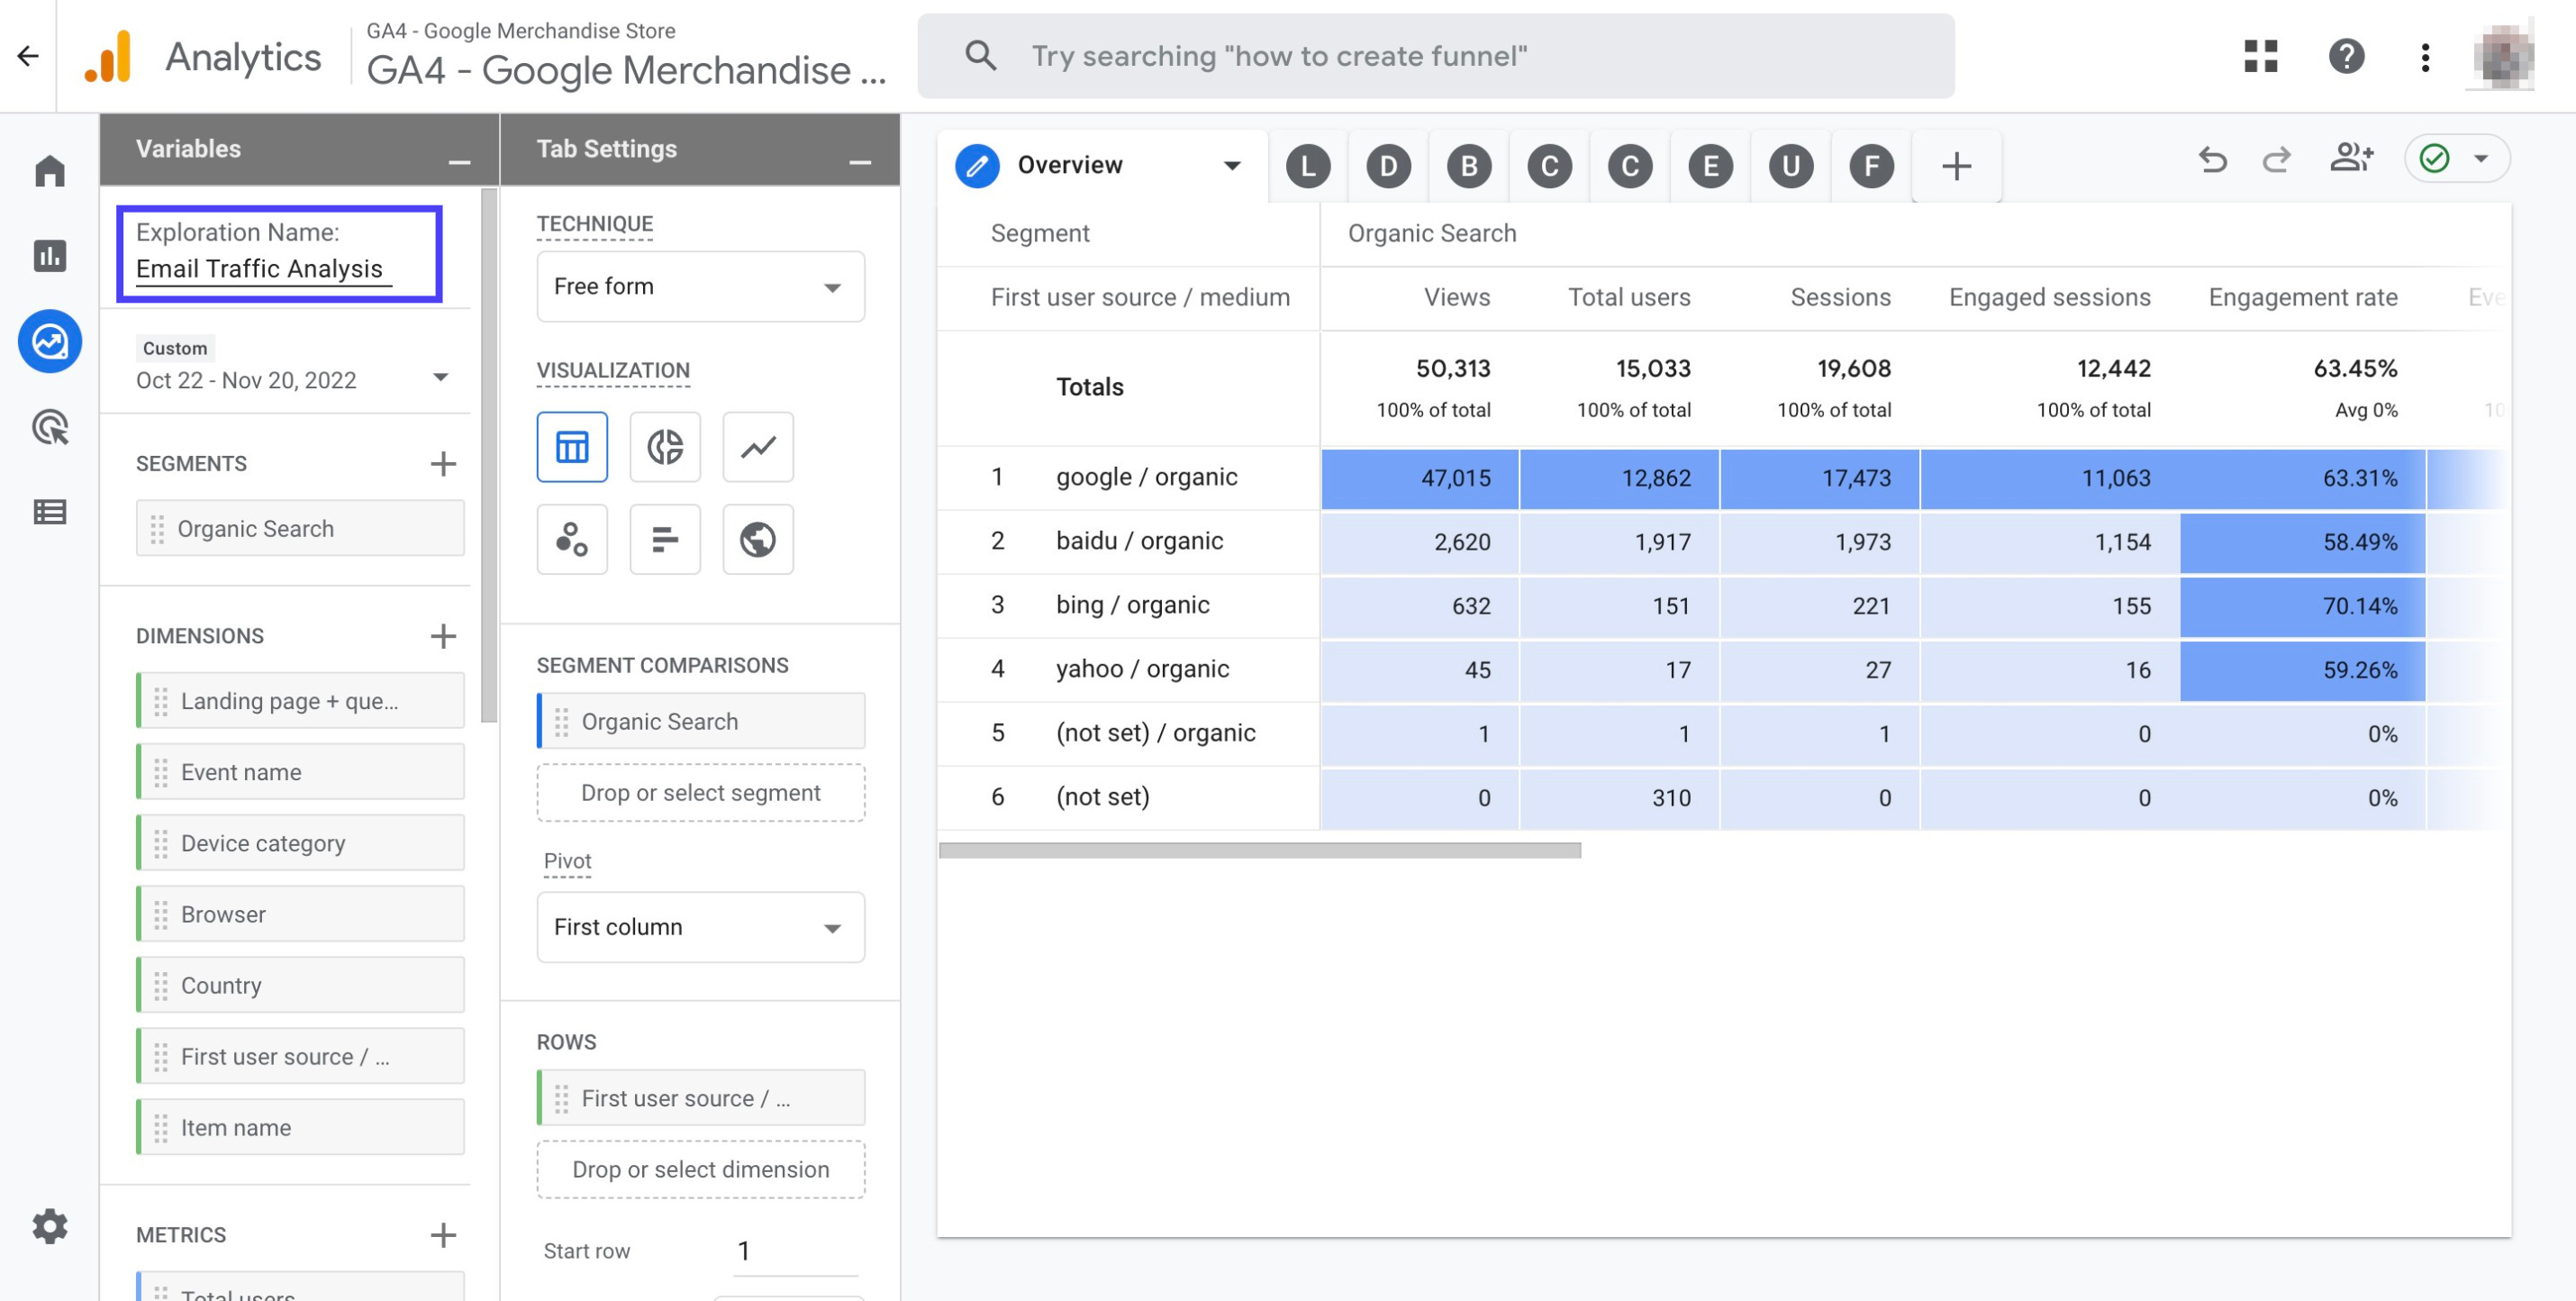
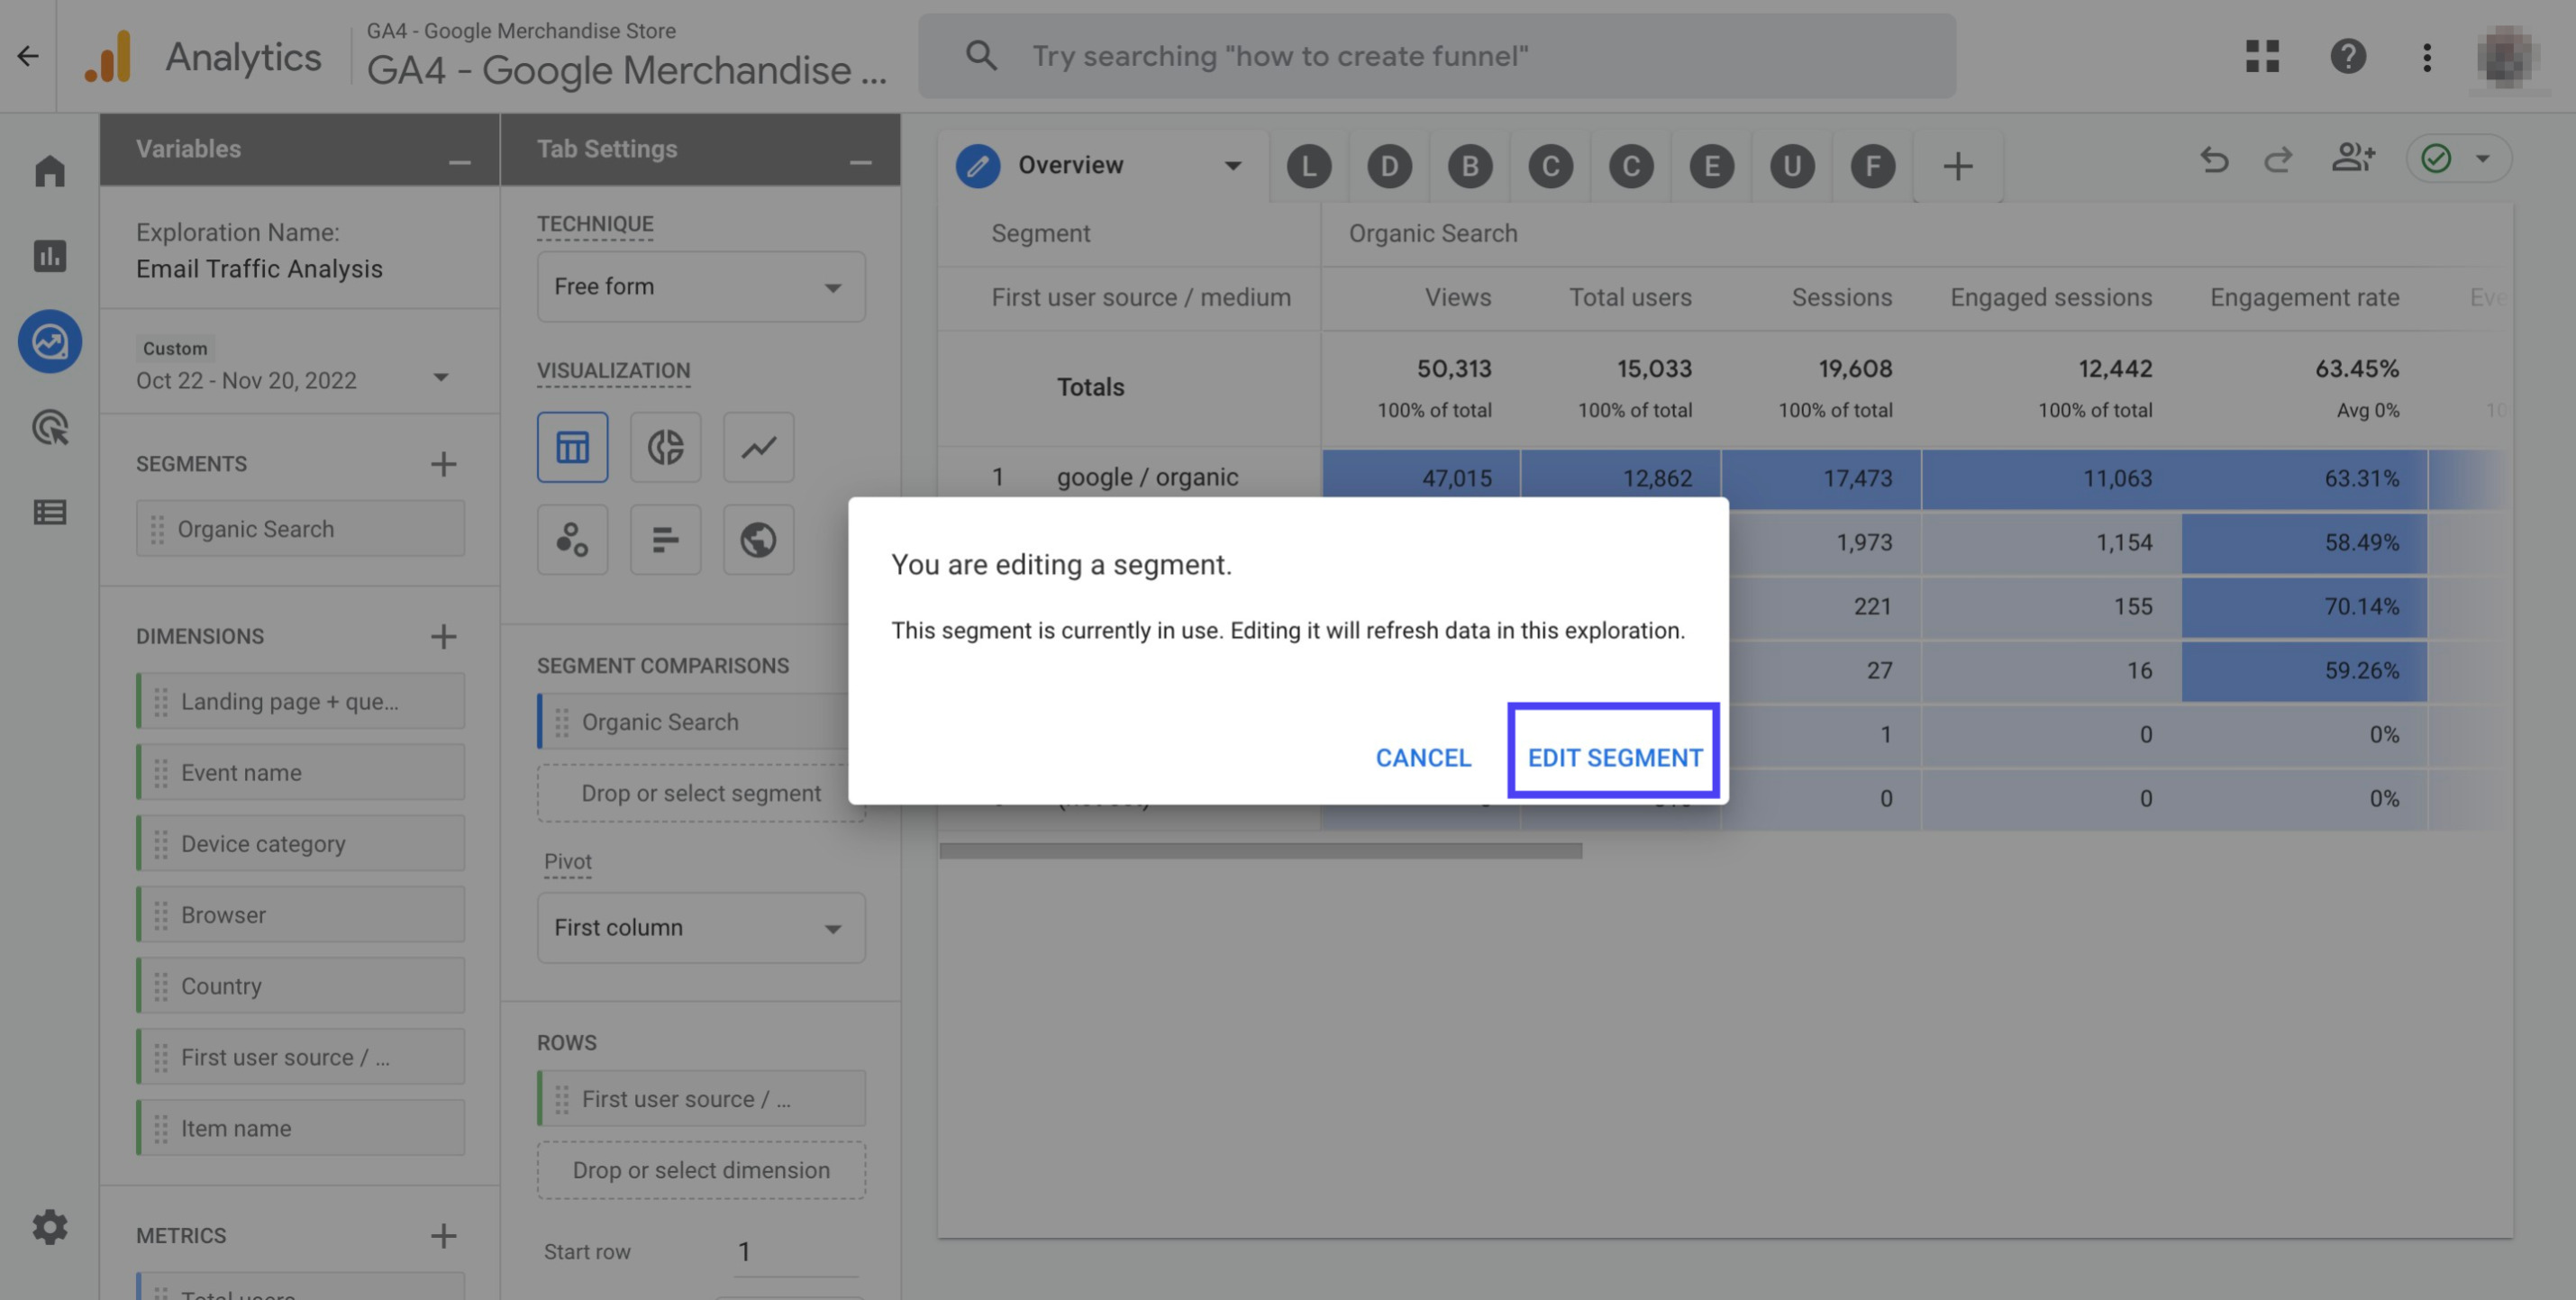
Hover over the segment 'Organic Search' and click the three dots right next to it. Then, click 'edit' from the drop down menu
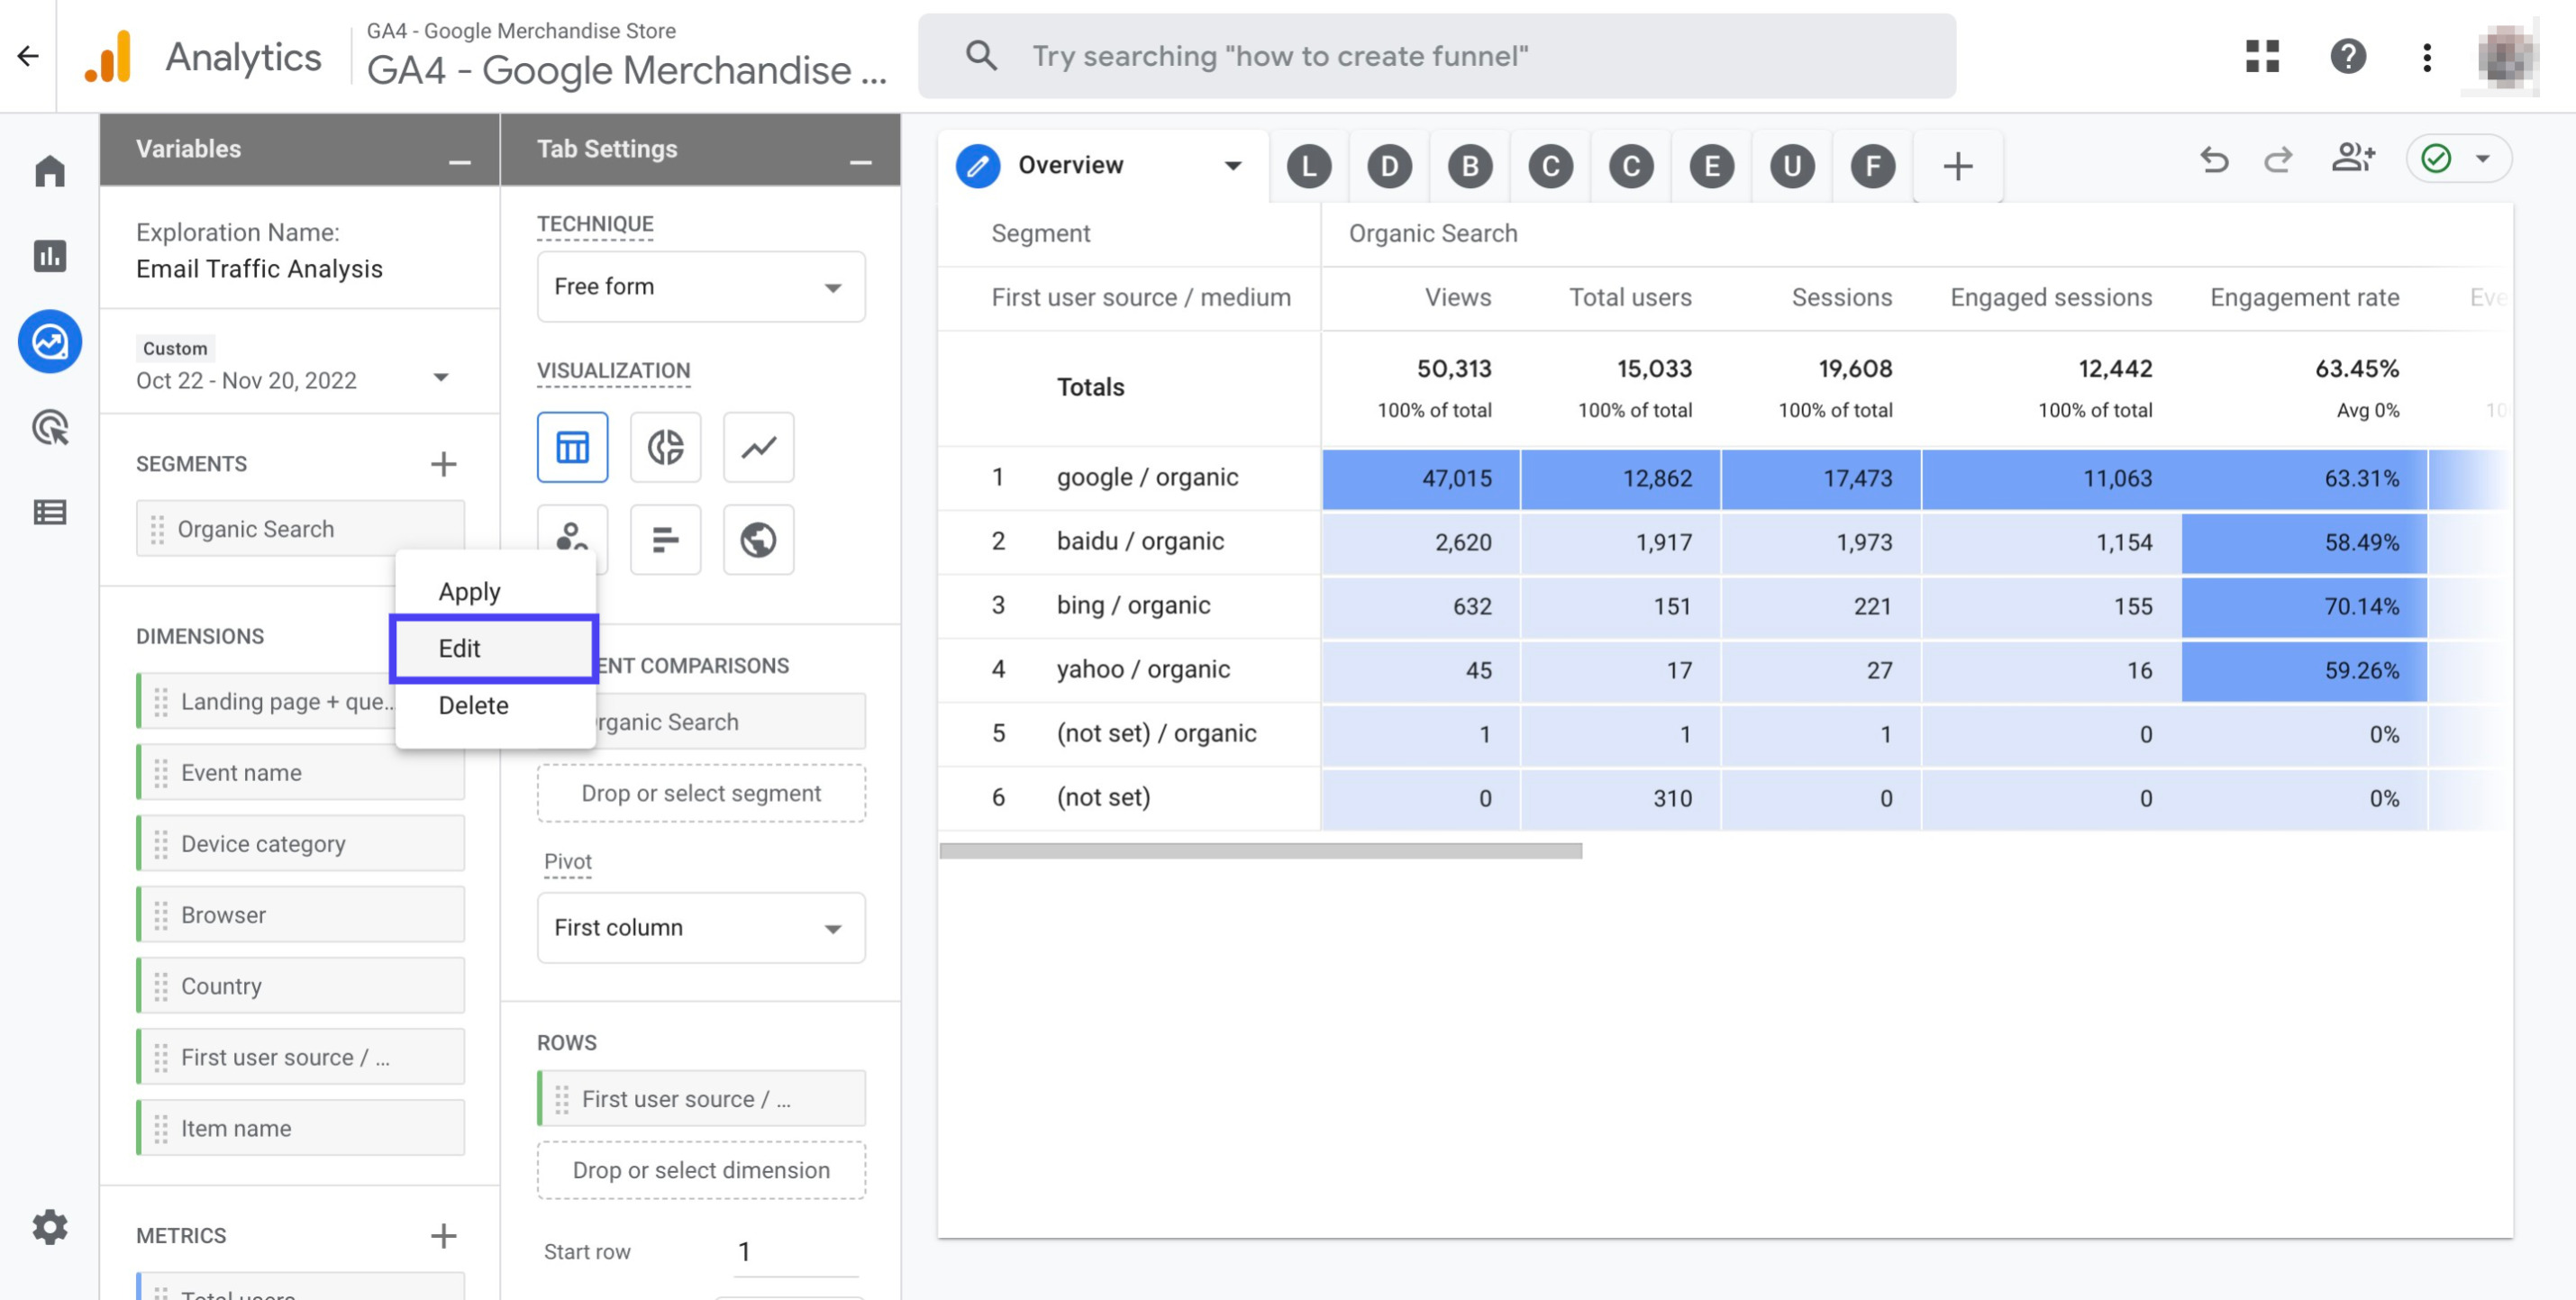
Choose 'Edit Segment'
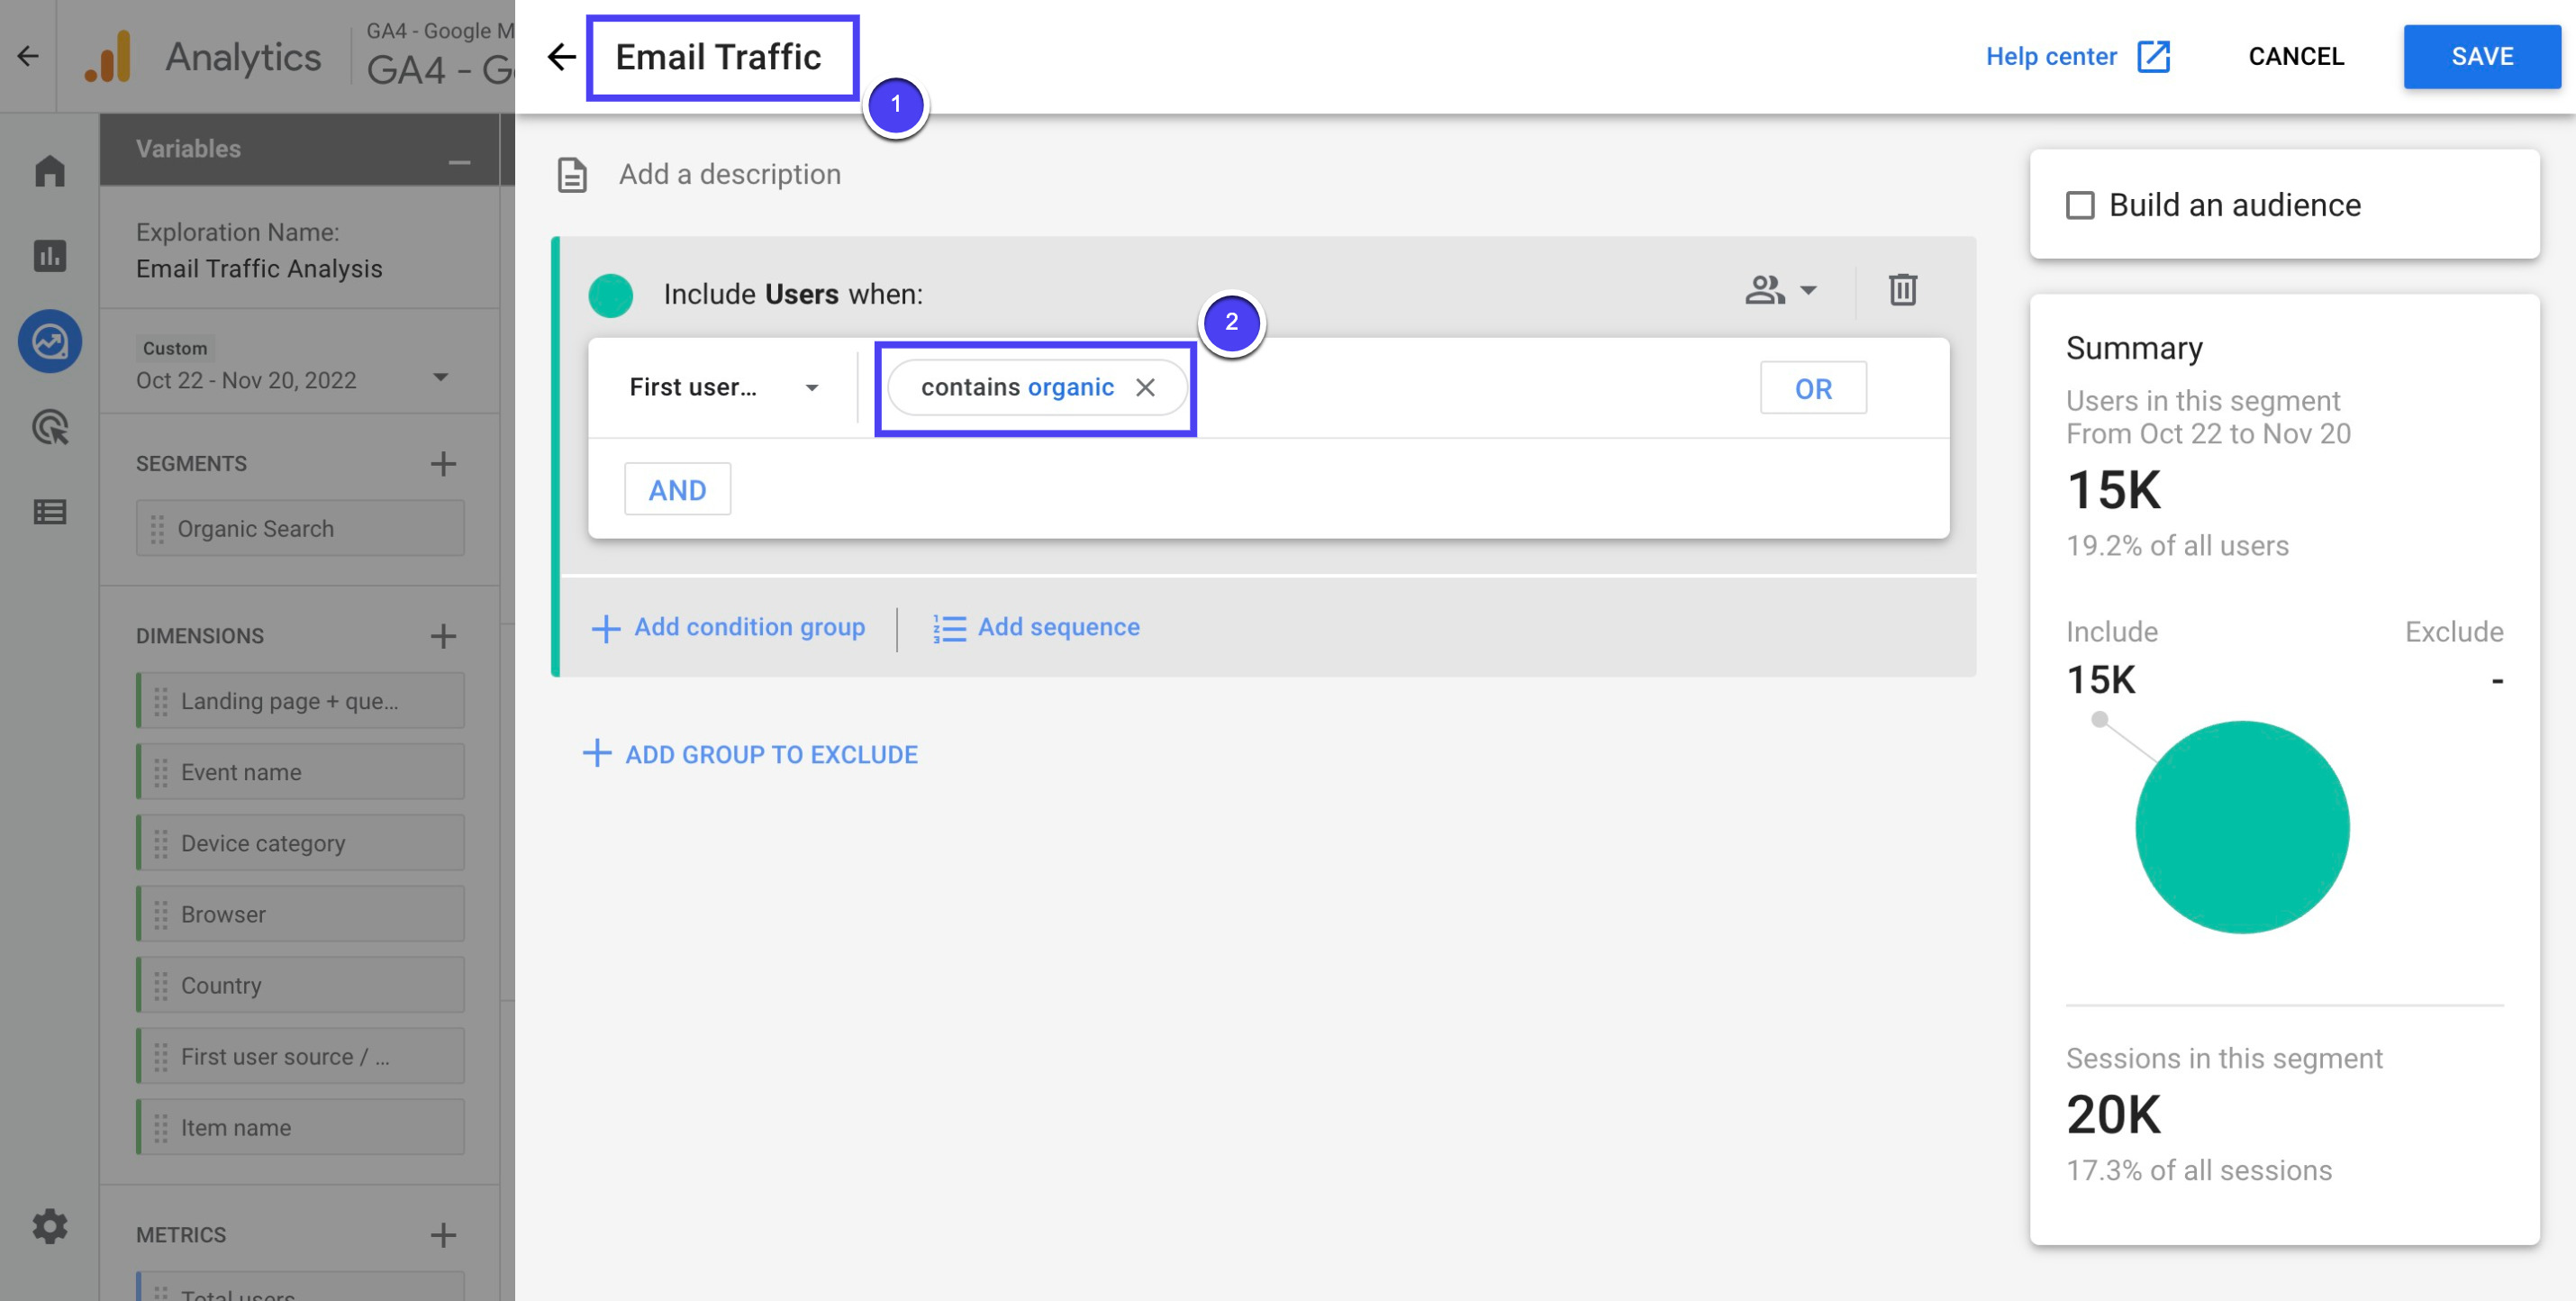
Rename the segment as 'Email Traffic'. Then, click on 'contains organic'
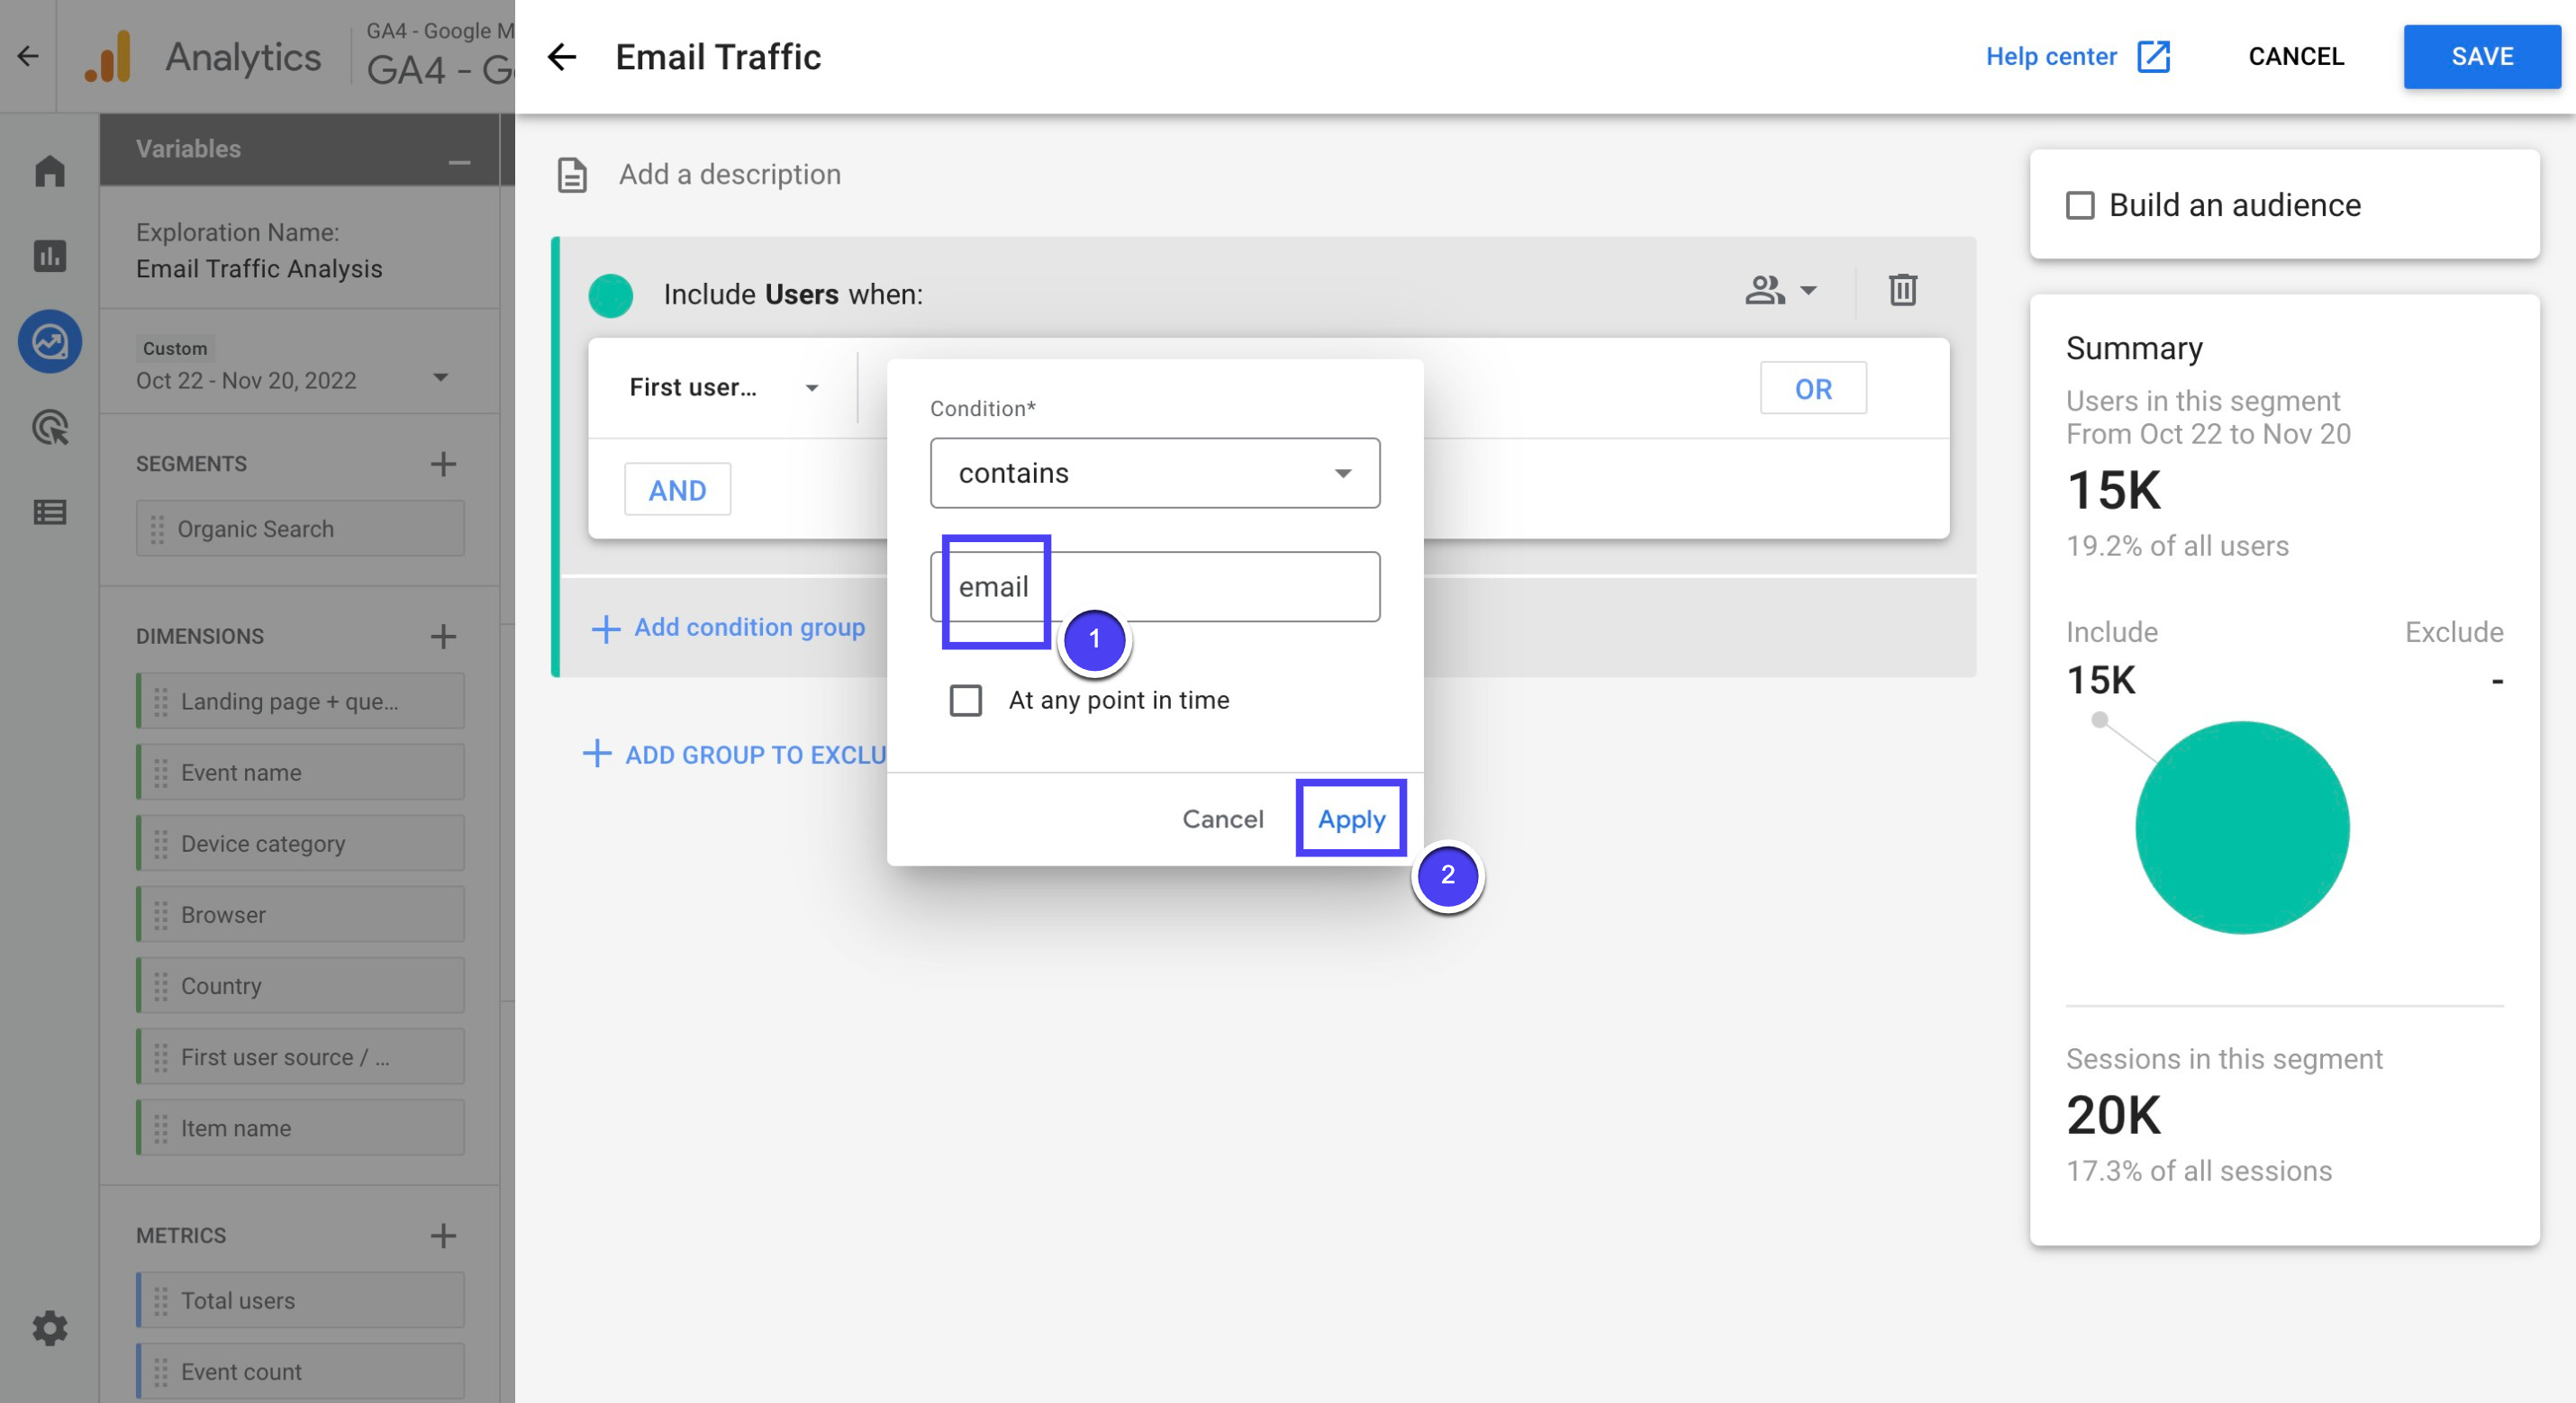
Replace the text 'organic' in the second line with 'email', then click 'Apply'
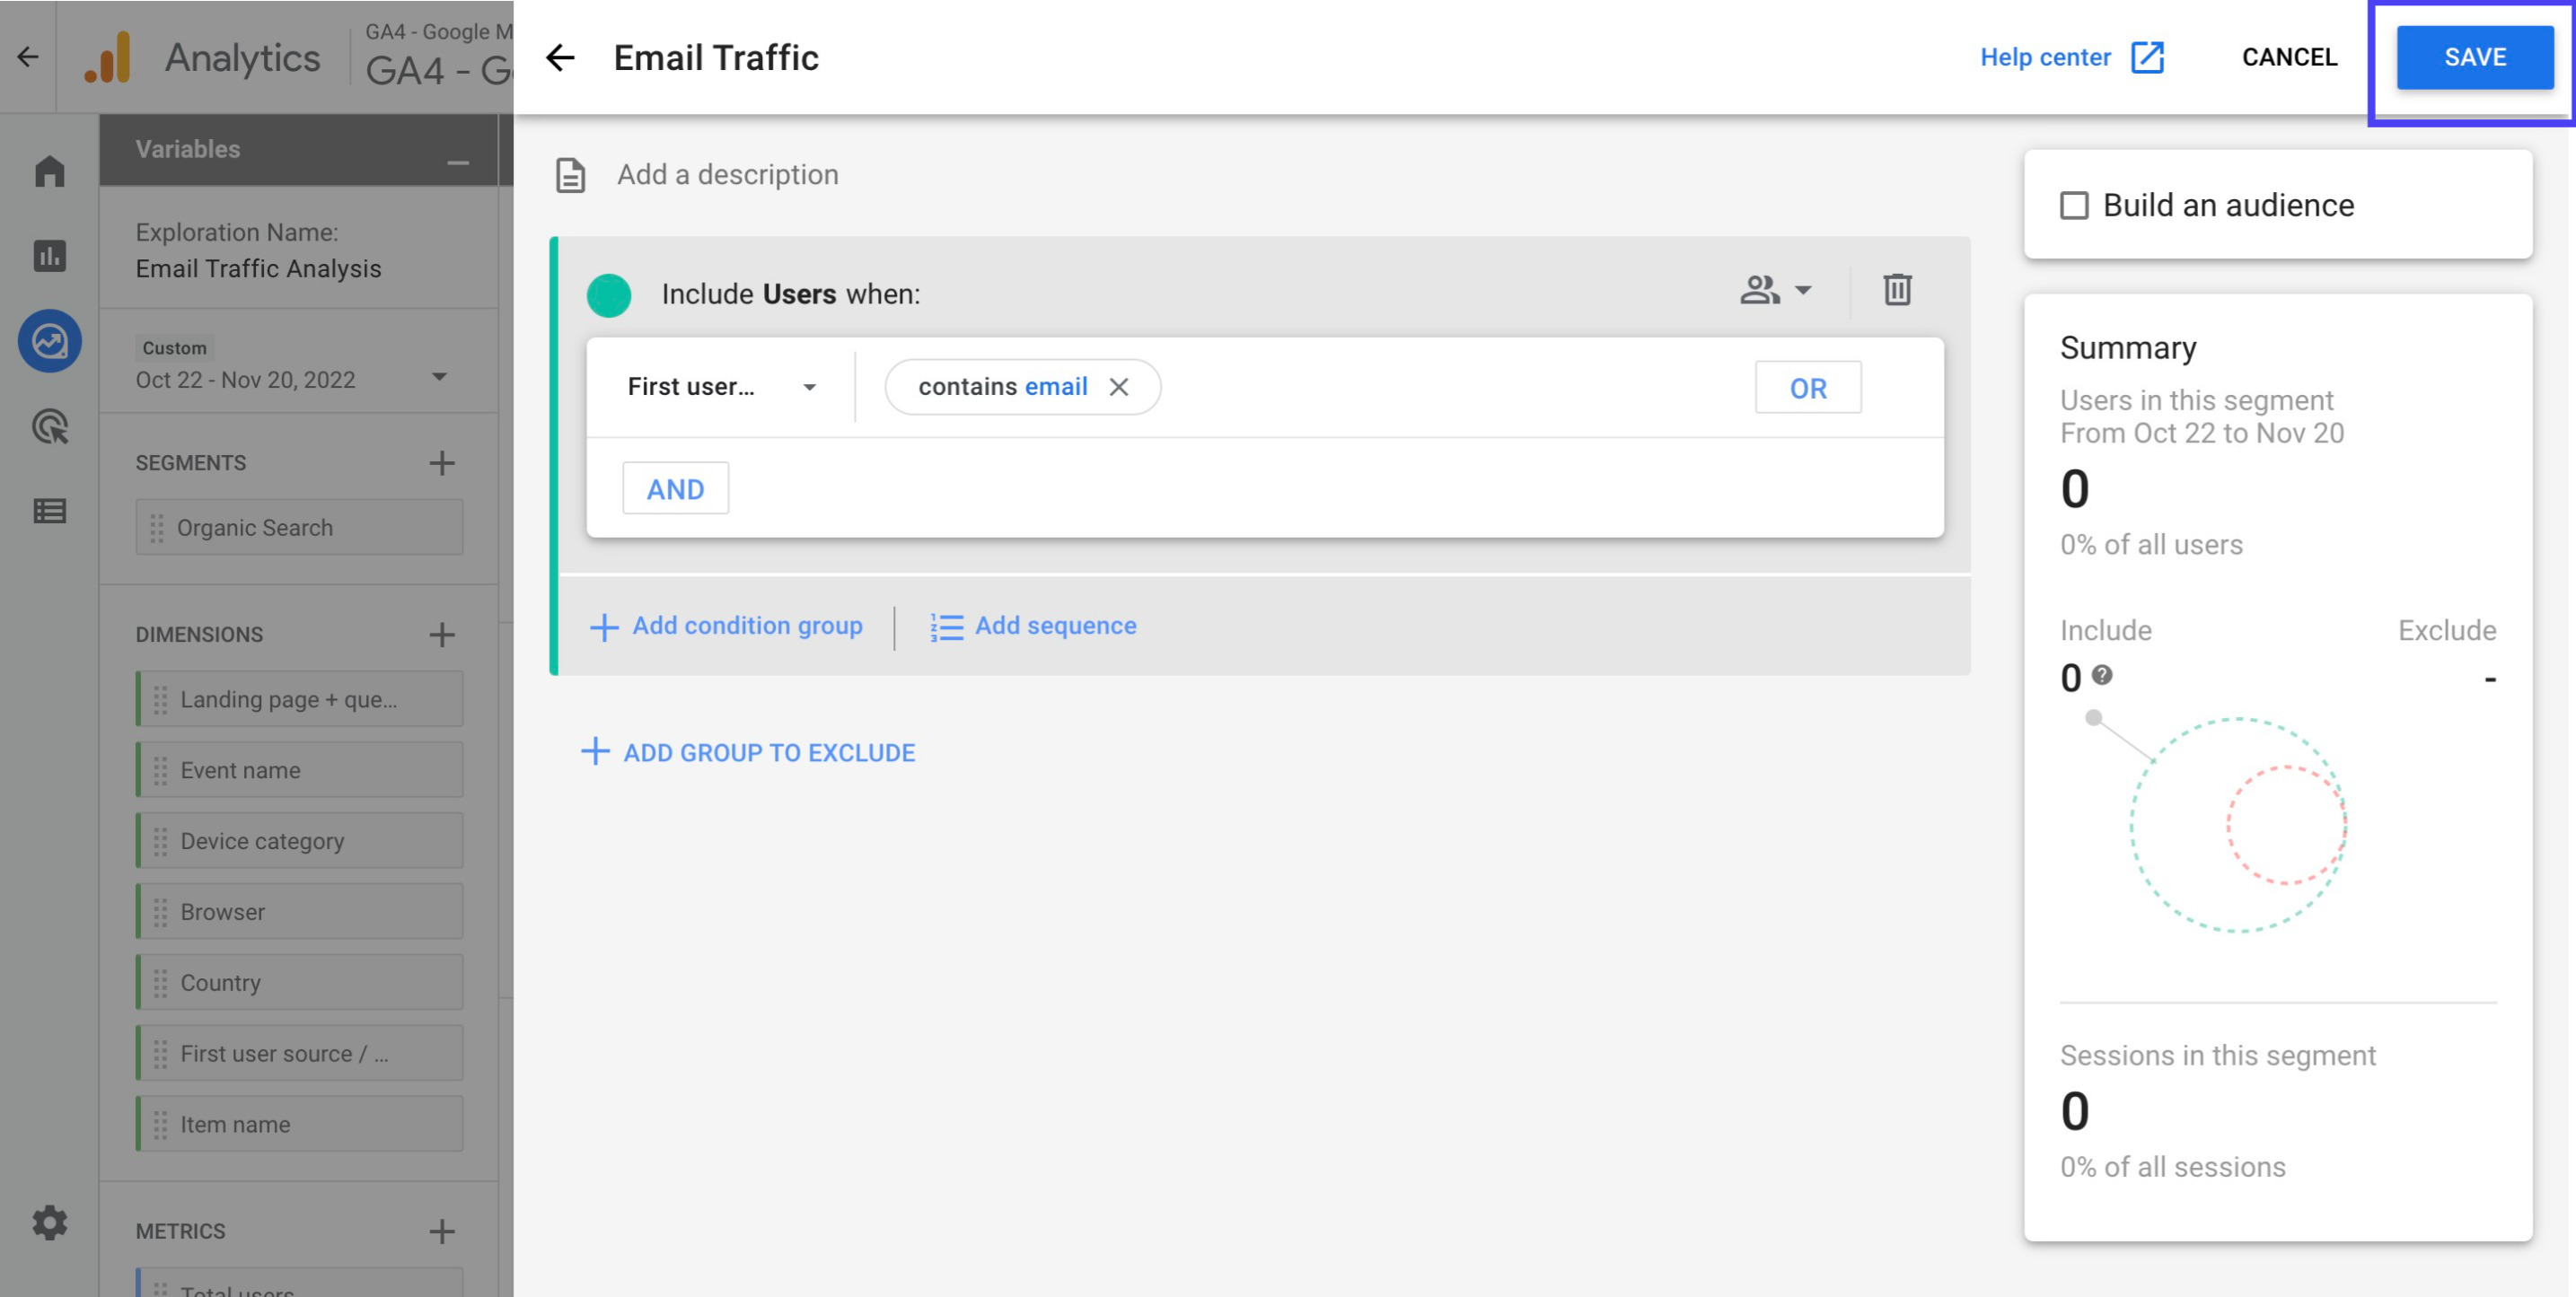
Click 'Save' on the upper right corner
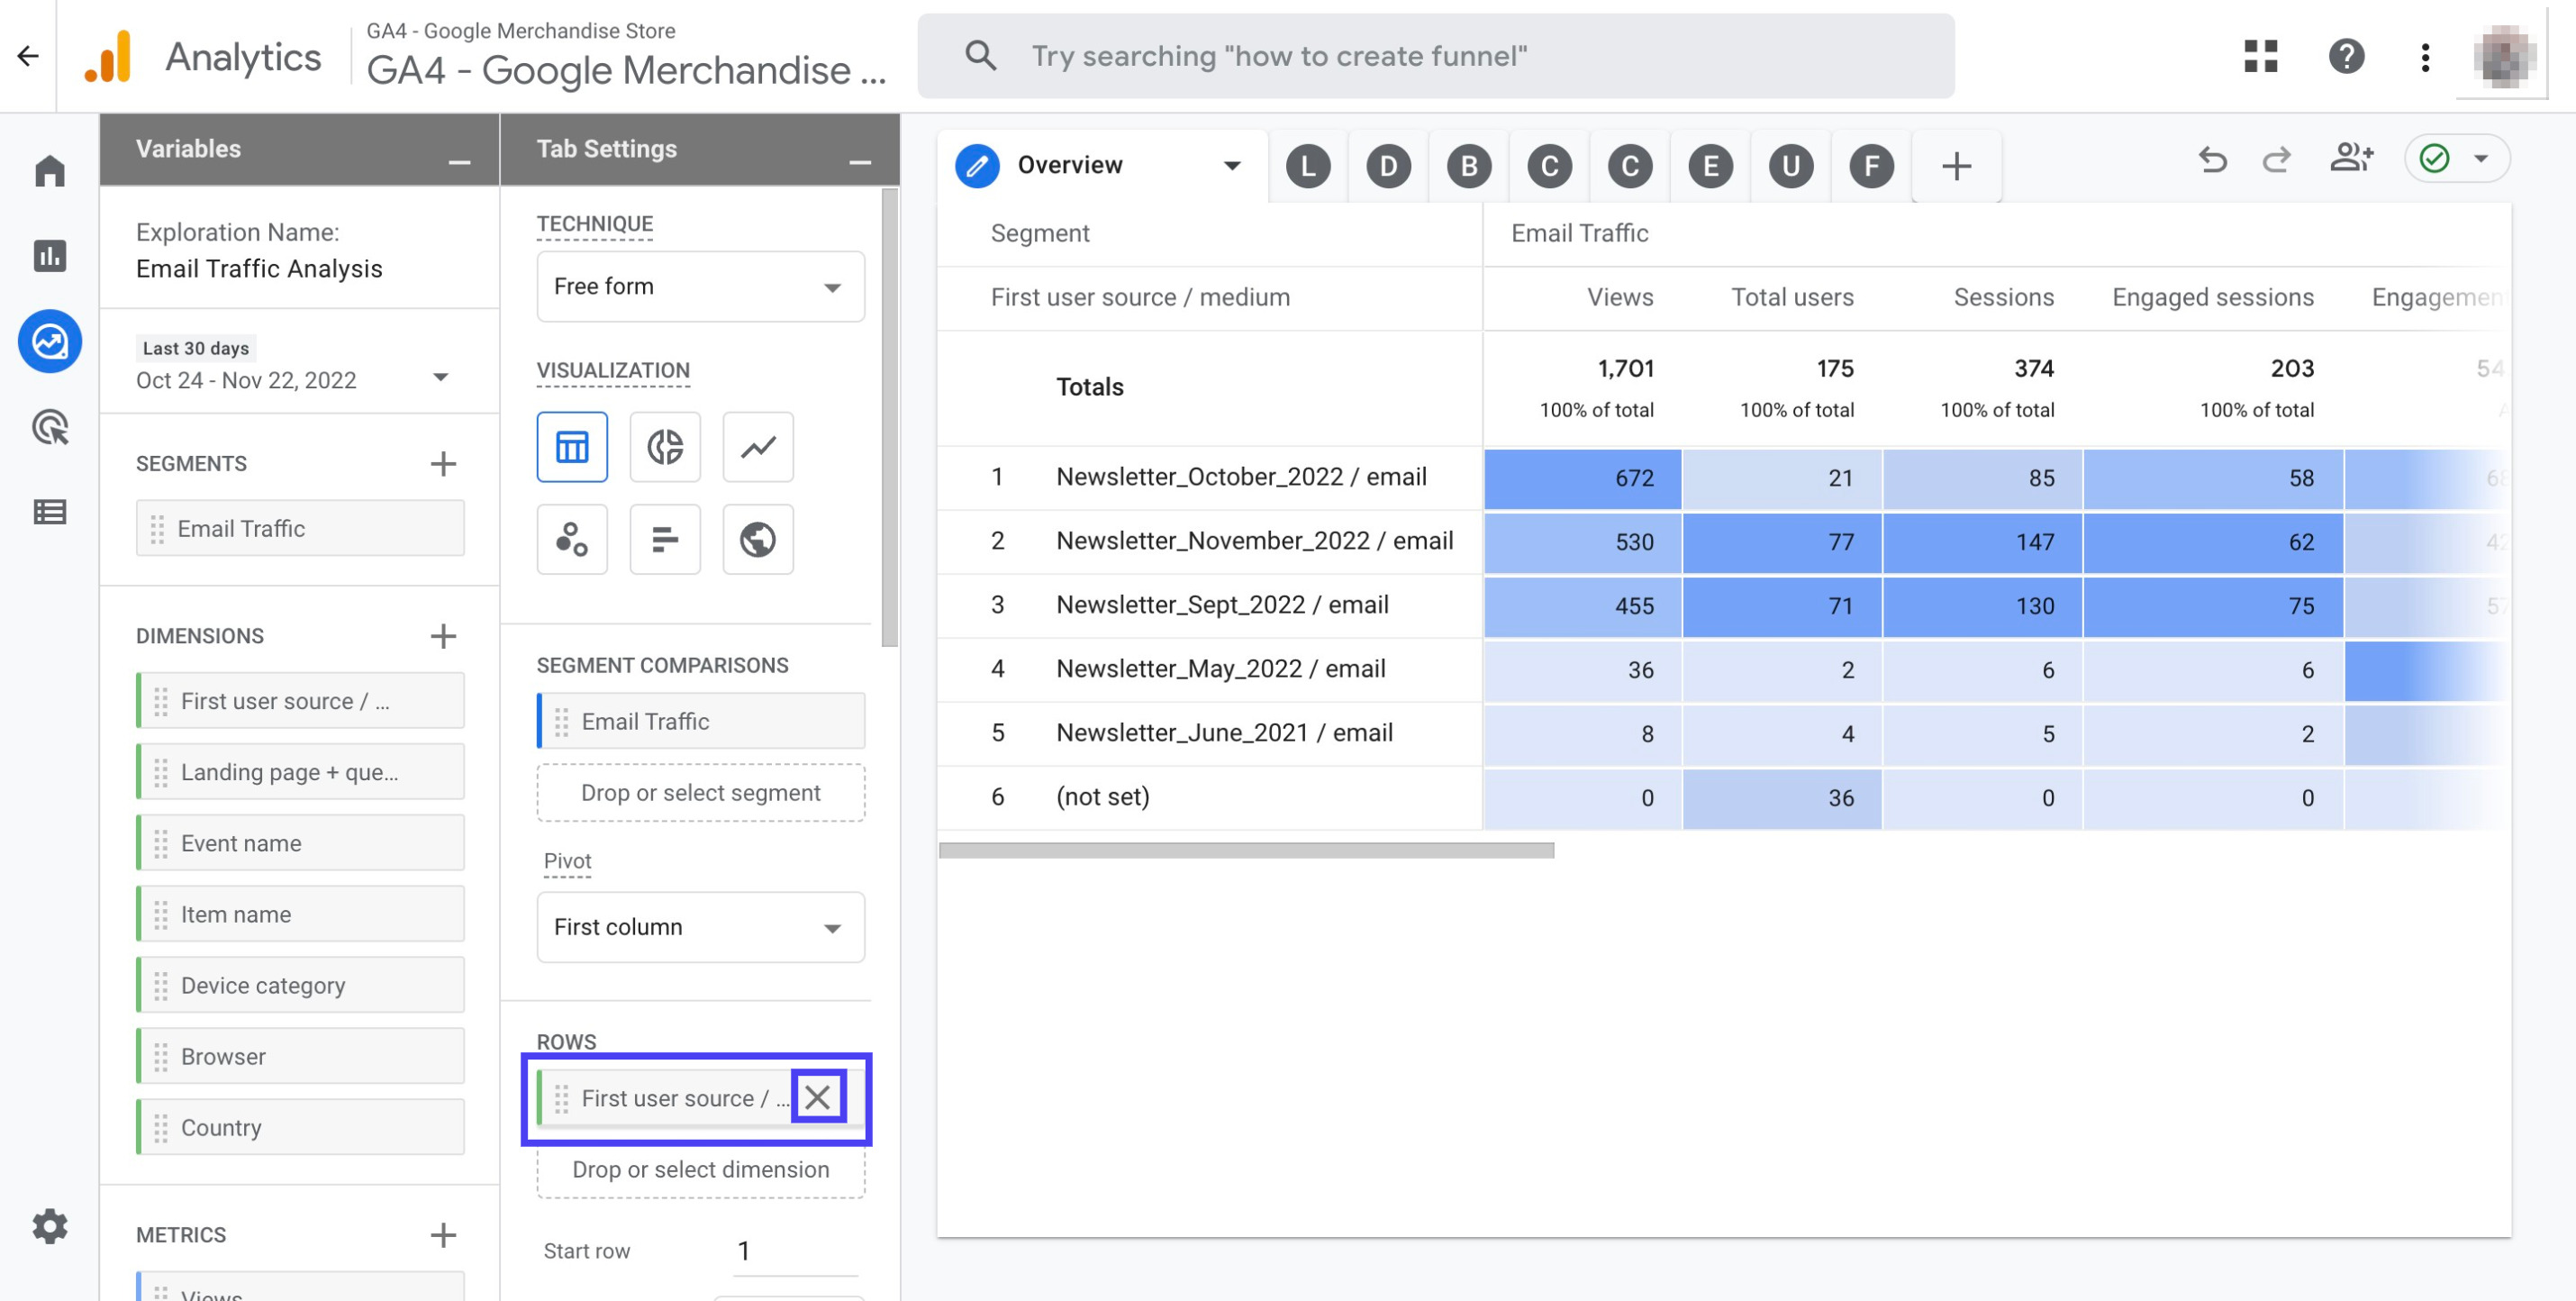
See the dimension 'First user source / medium' and click the cross sign to remove it
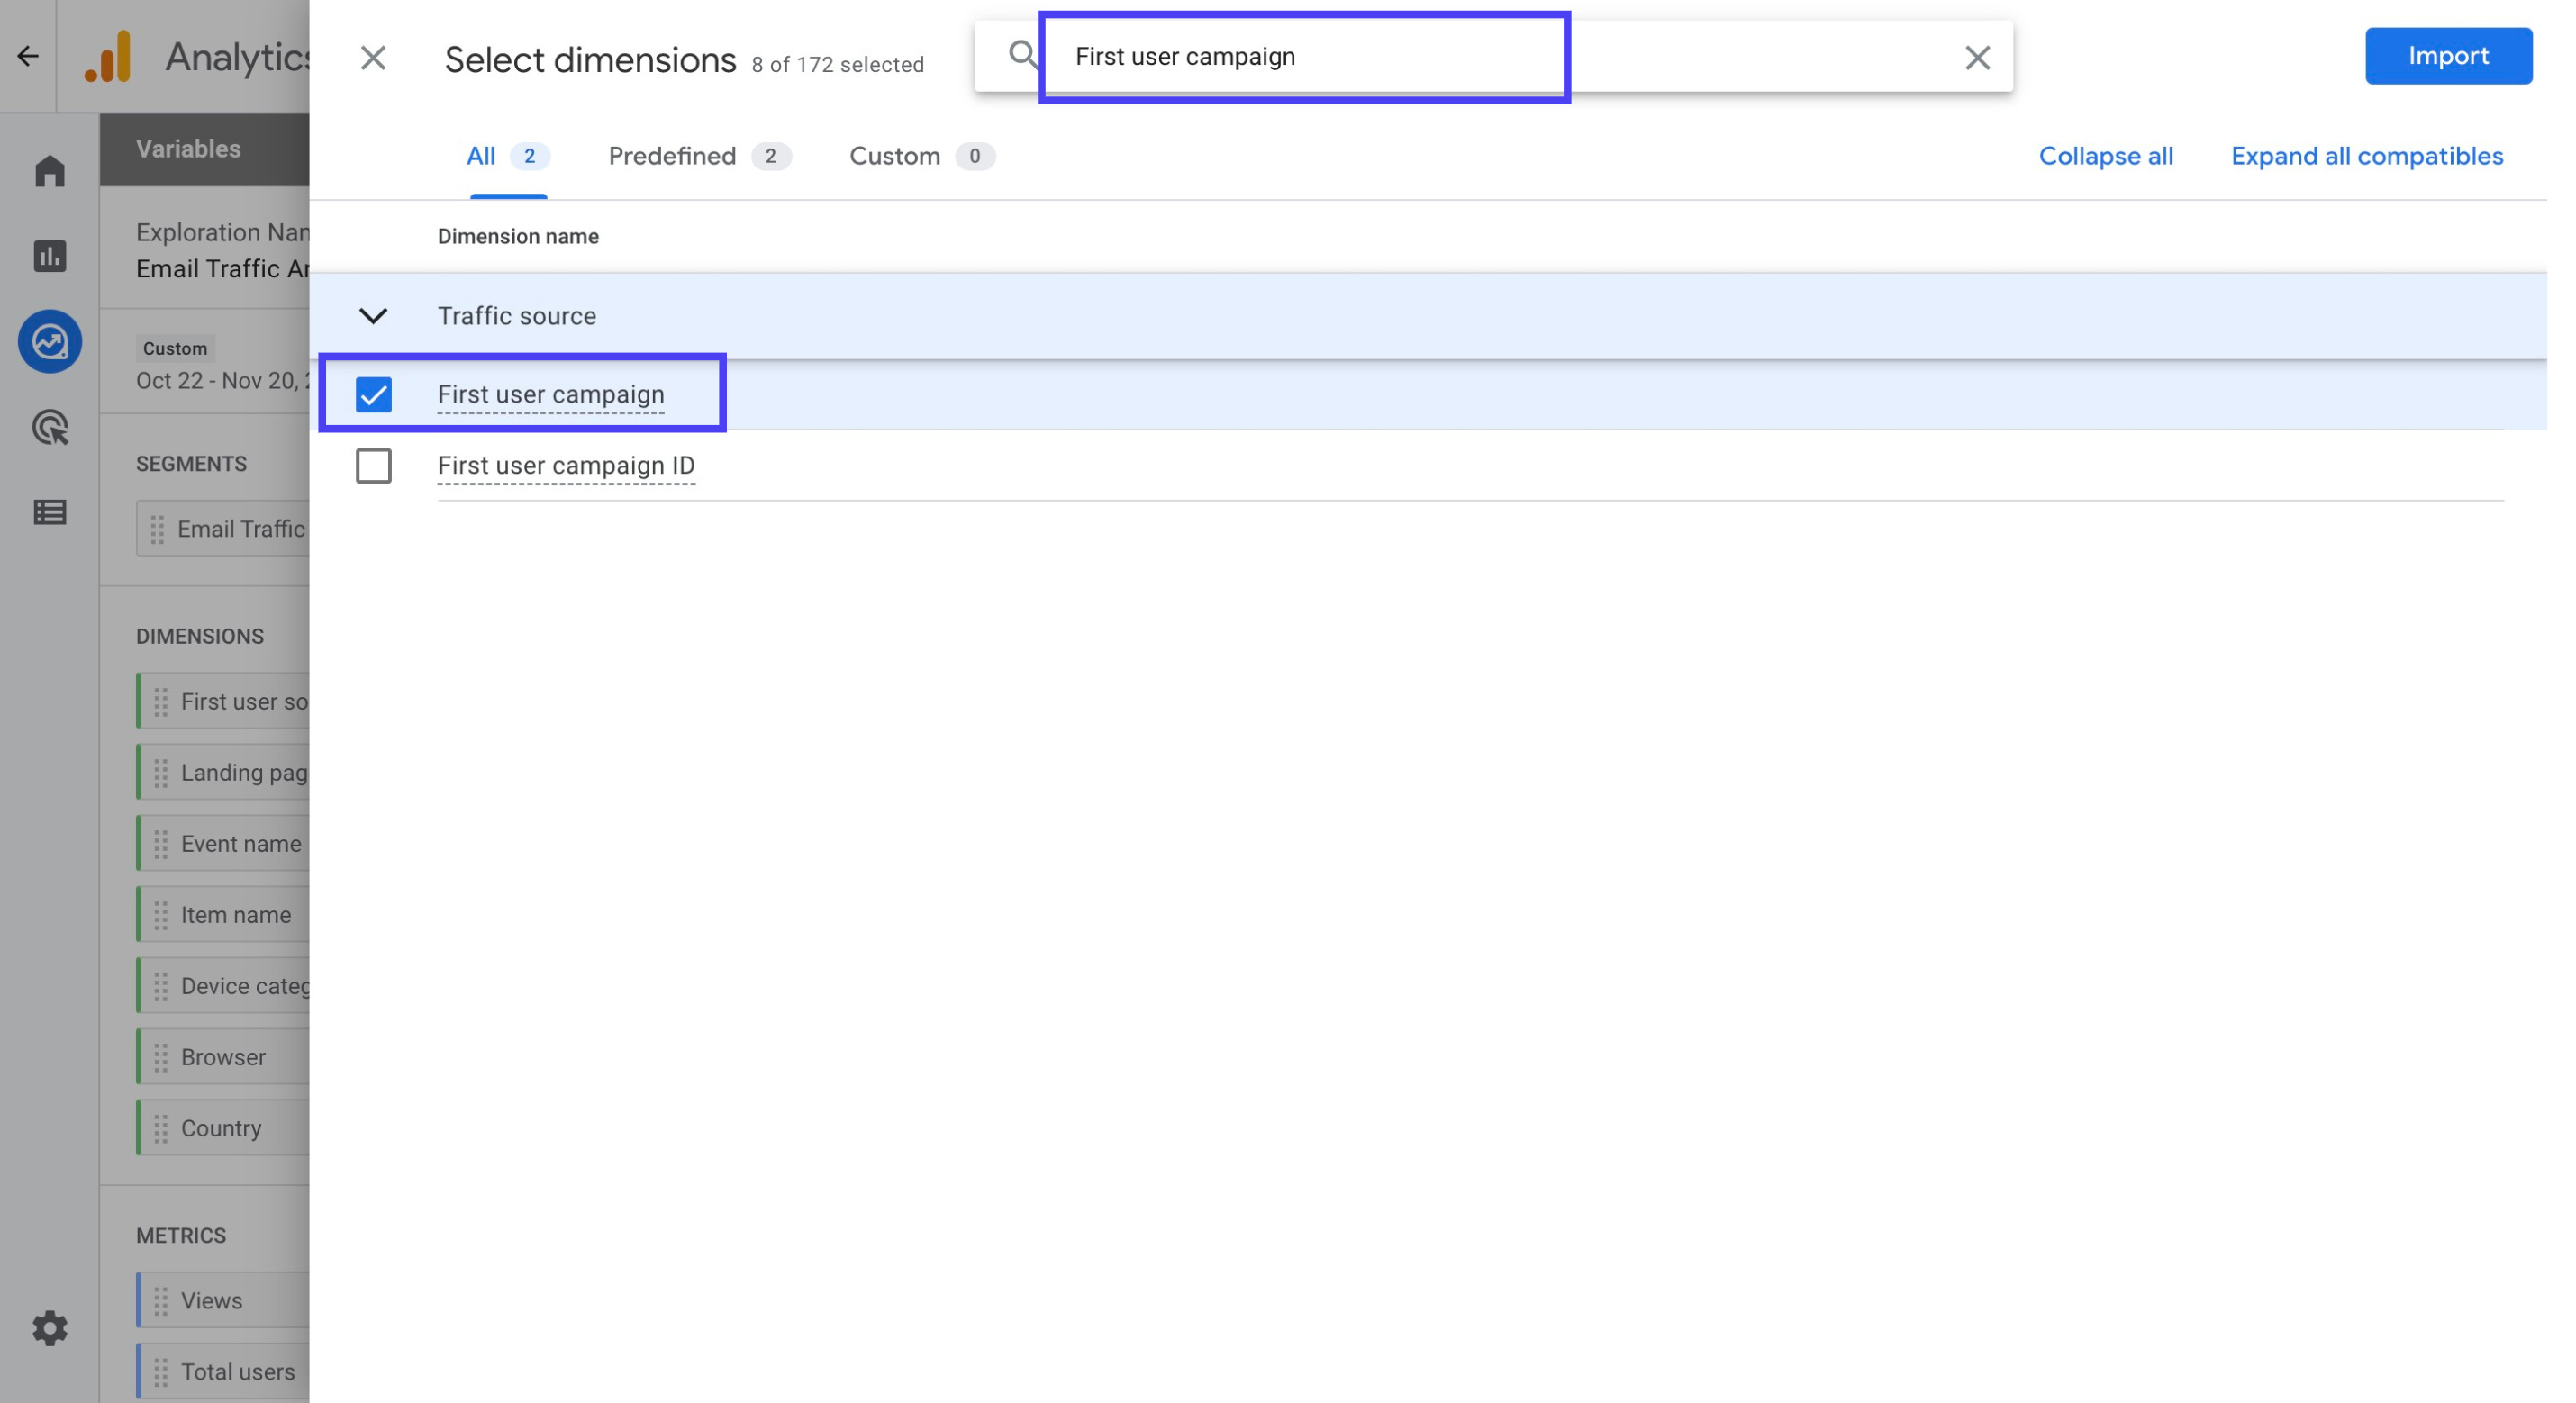
First, click the '+' sign next to 'Dimensions'. Second, search for 'First user campaign'. Then, click on the checkbox and 'Import'
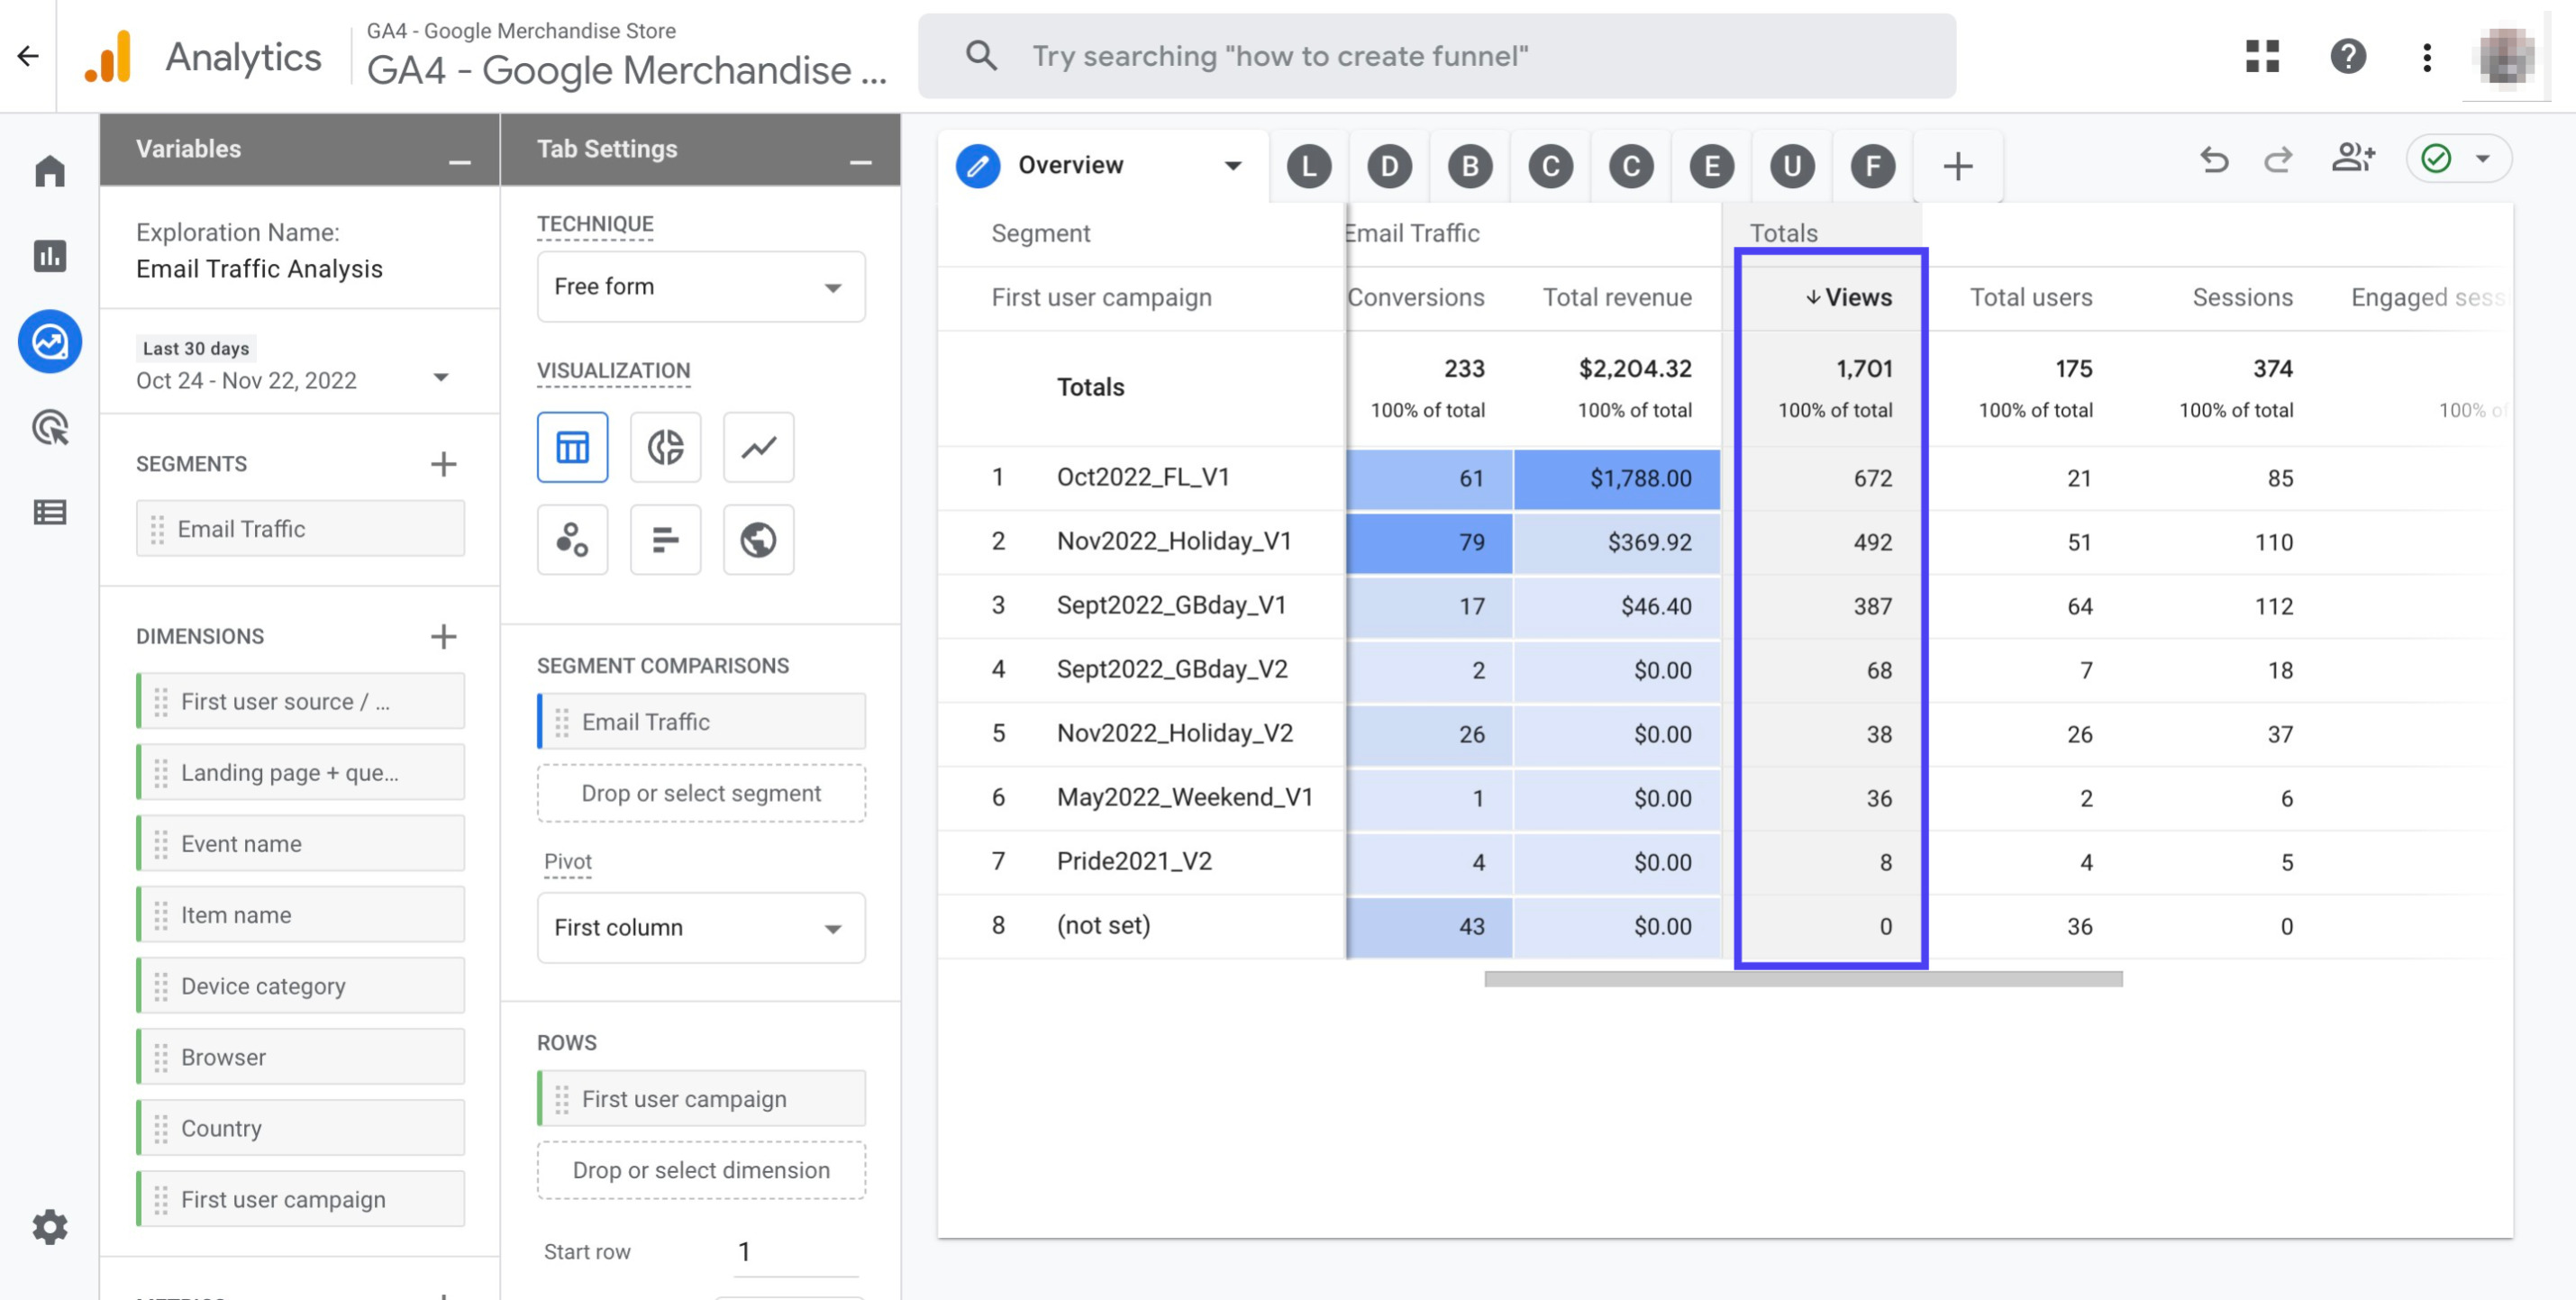
Double click the dimension 'First user campaign' to add it to your report. Then, scroll horizontally to the right until you see the section 'Views'
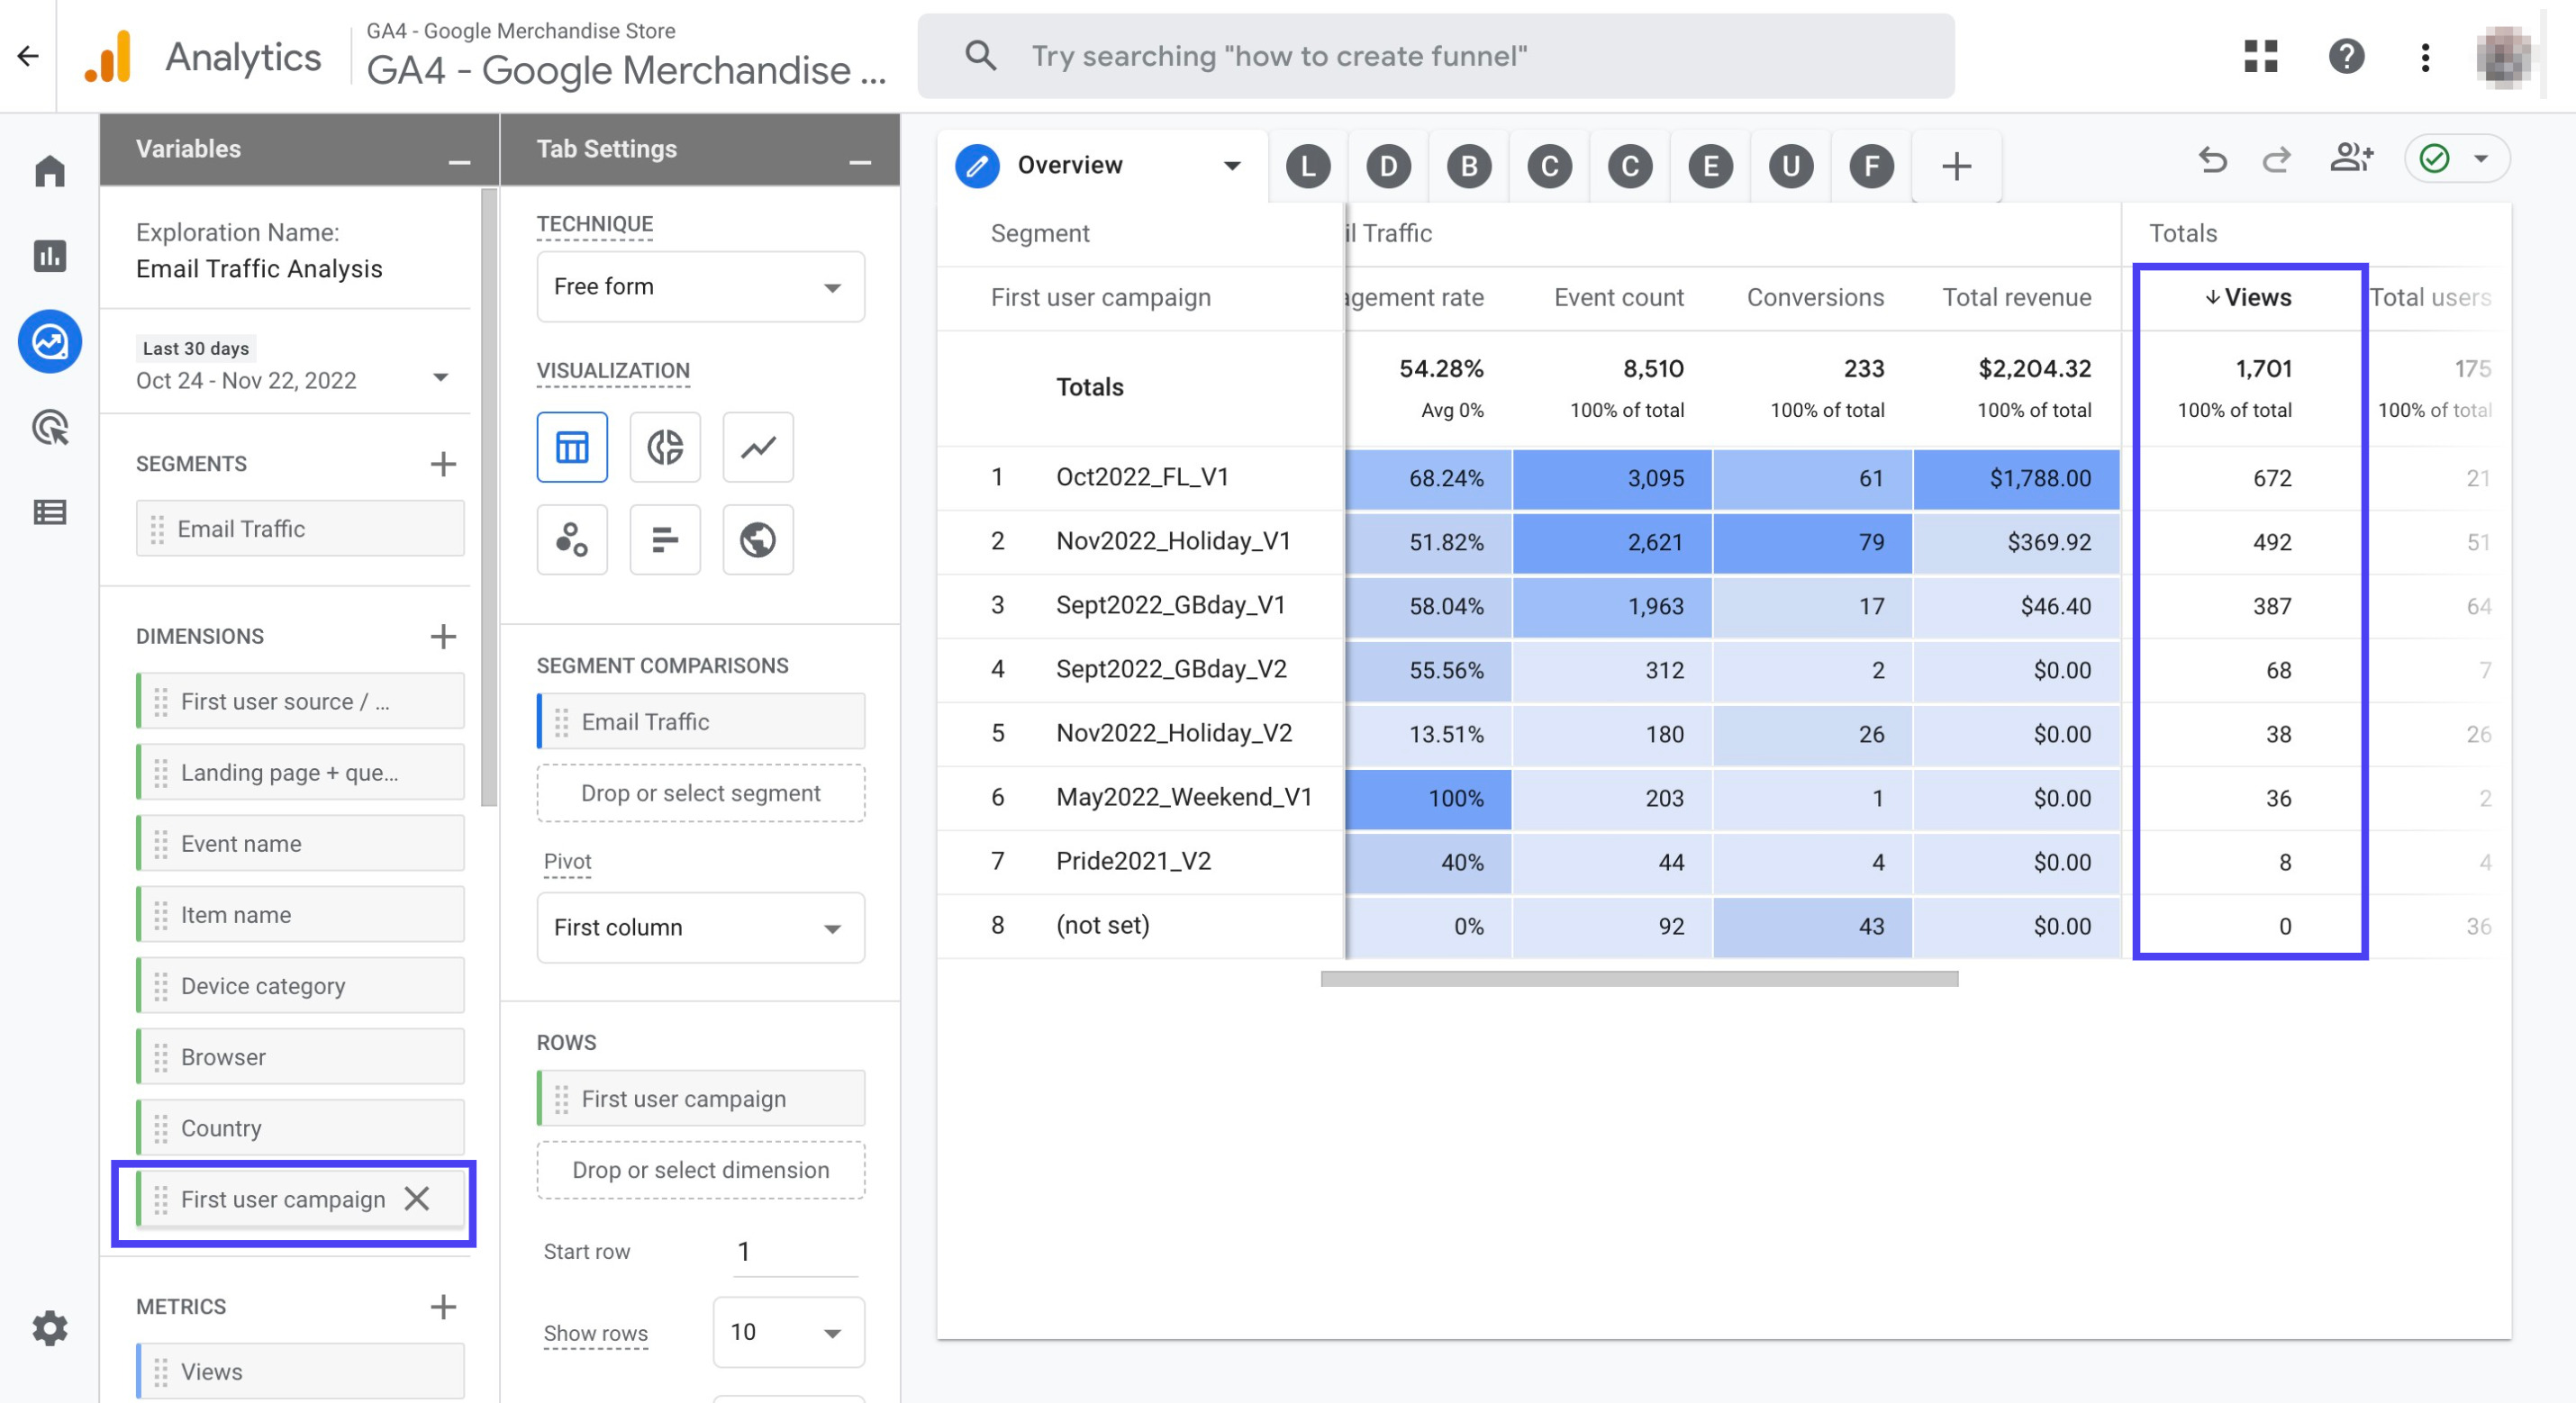
Click on the column header to make it look like the one below
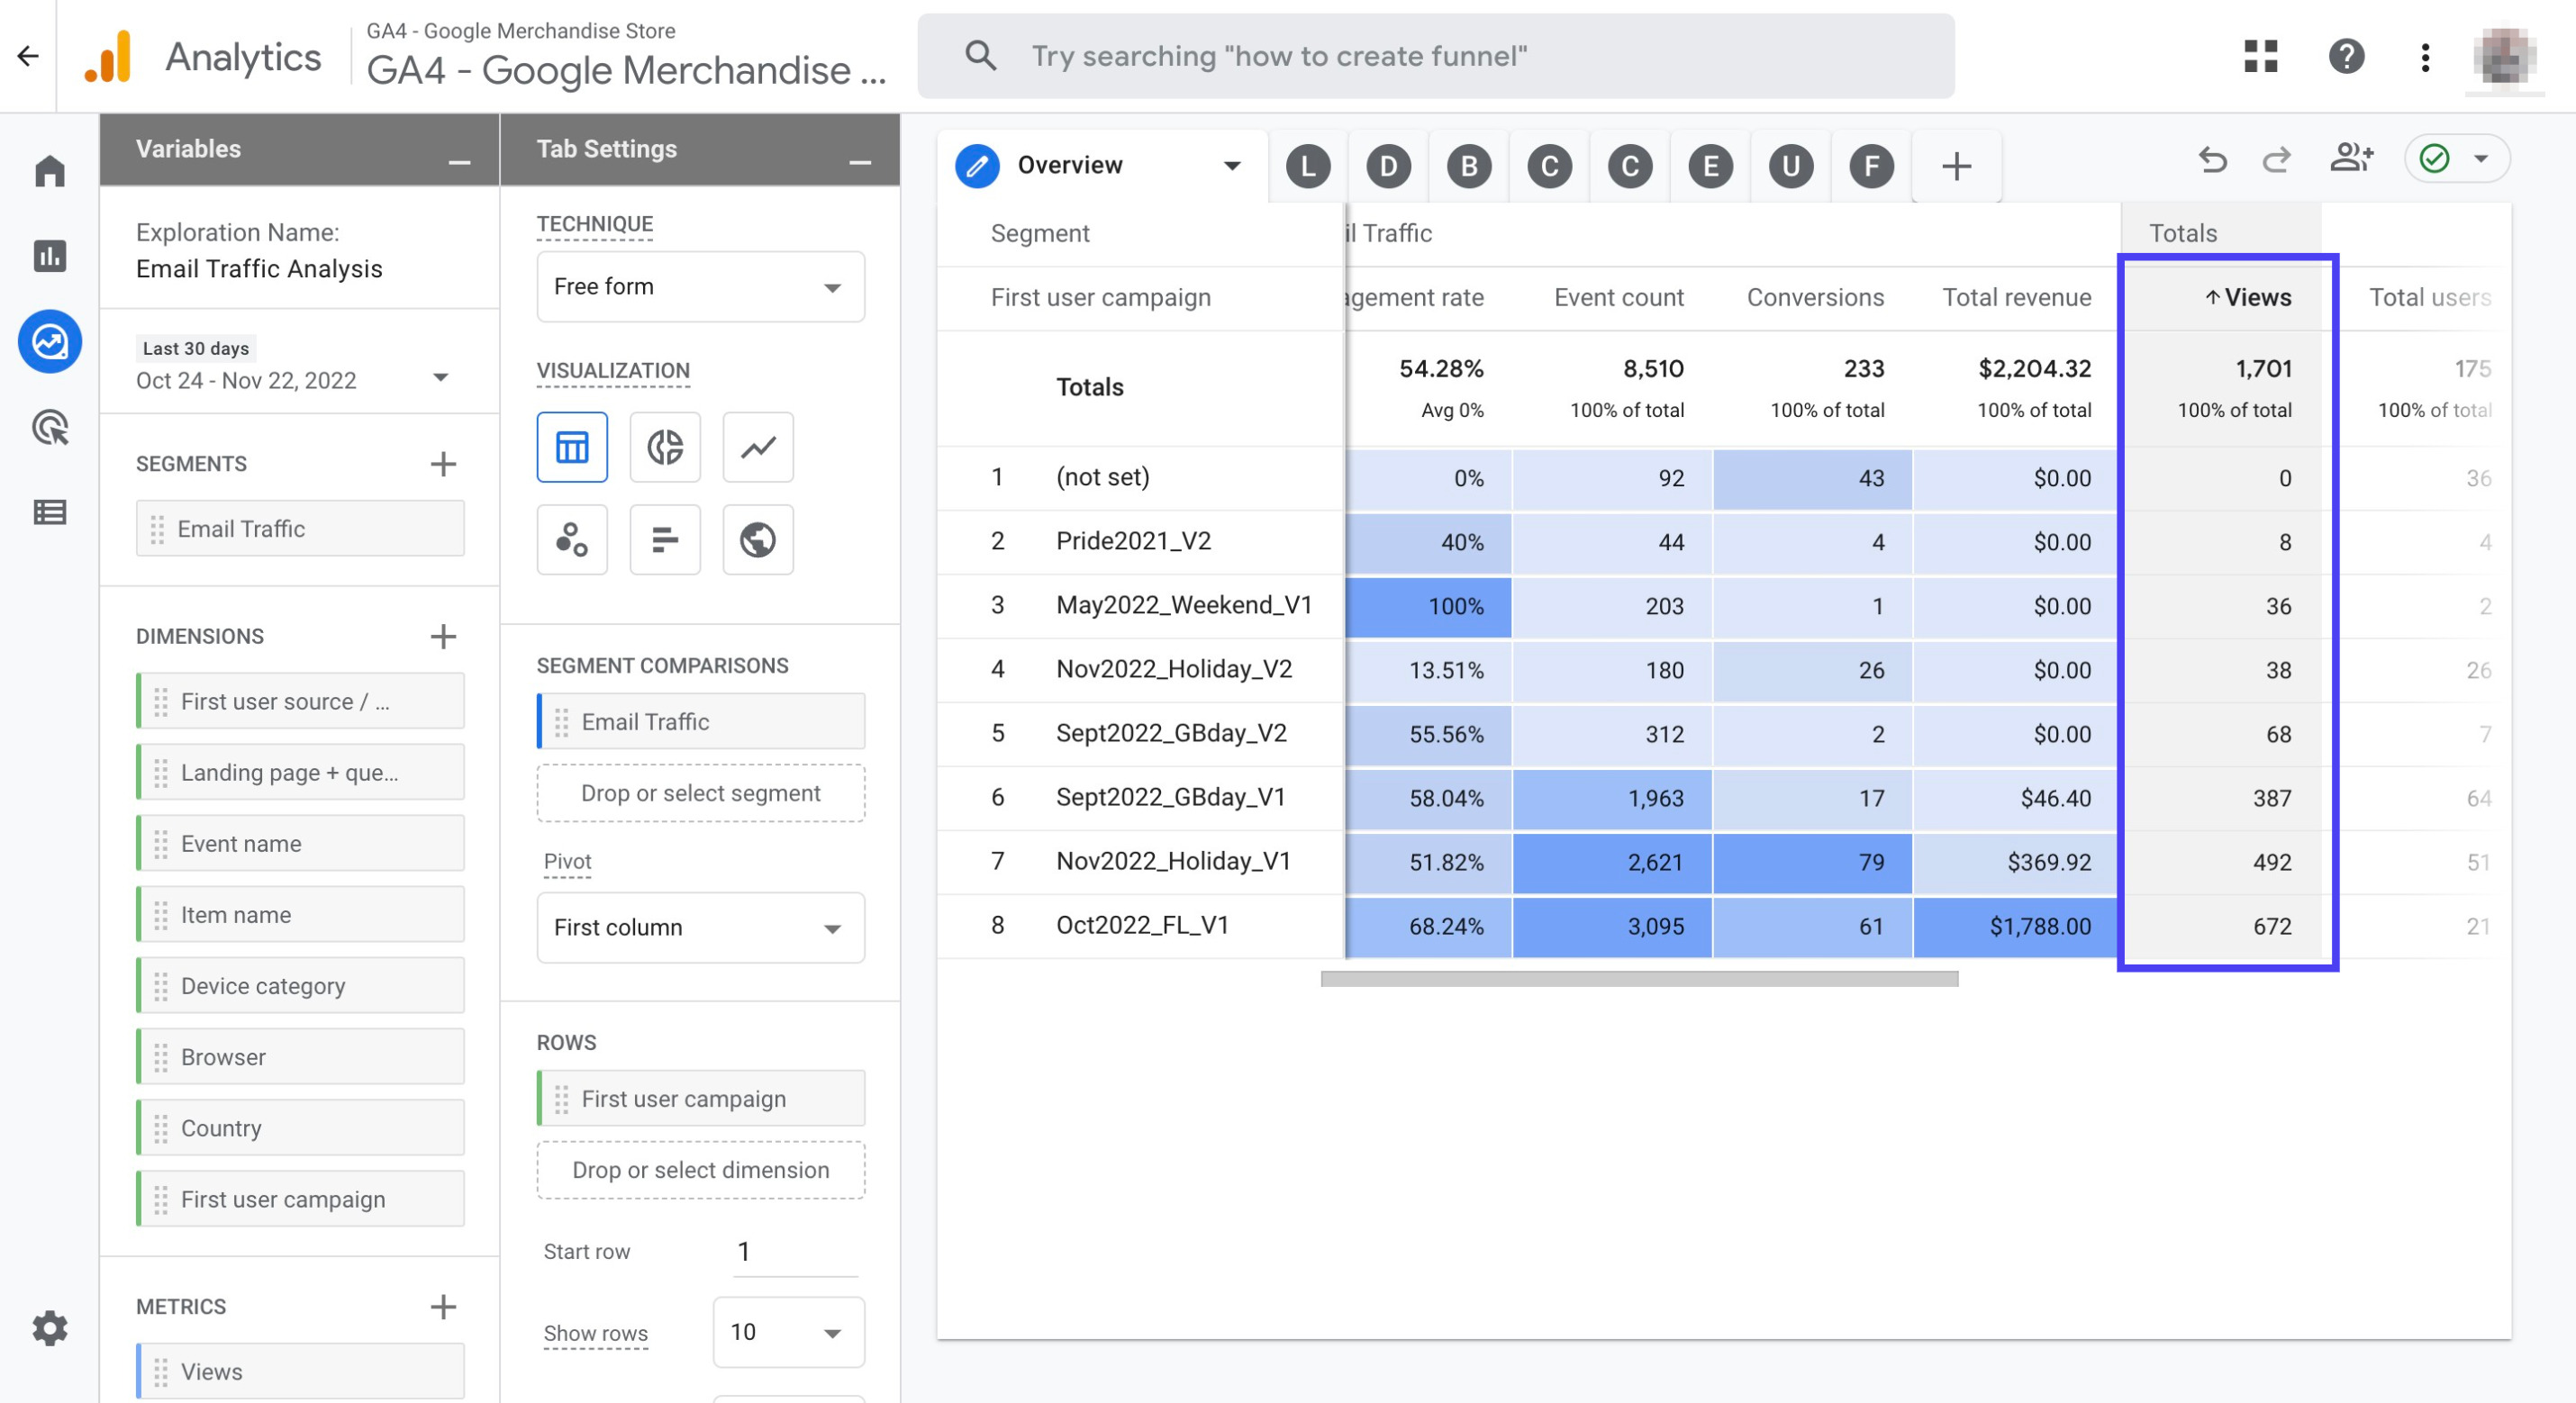
Click on the 'Views' column one more time to make it look like the one below
Now, scroll horizontally all the way to the left and check out your report which should look like the one below
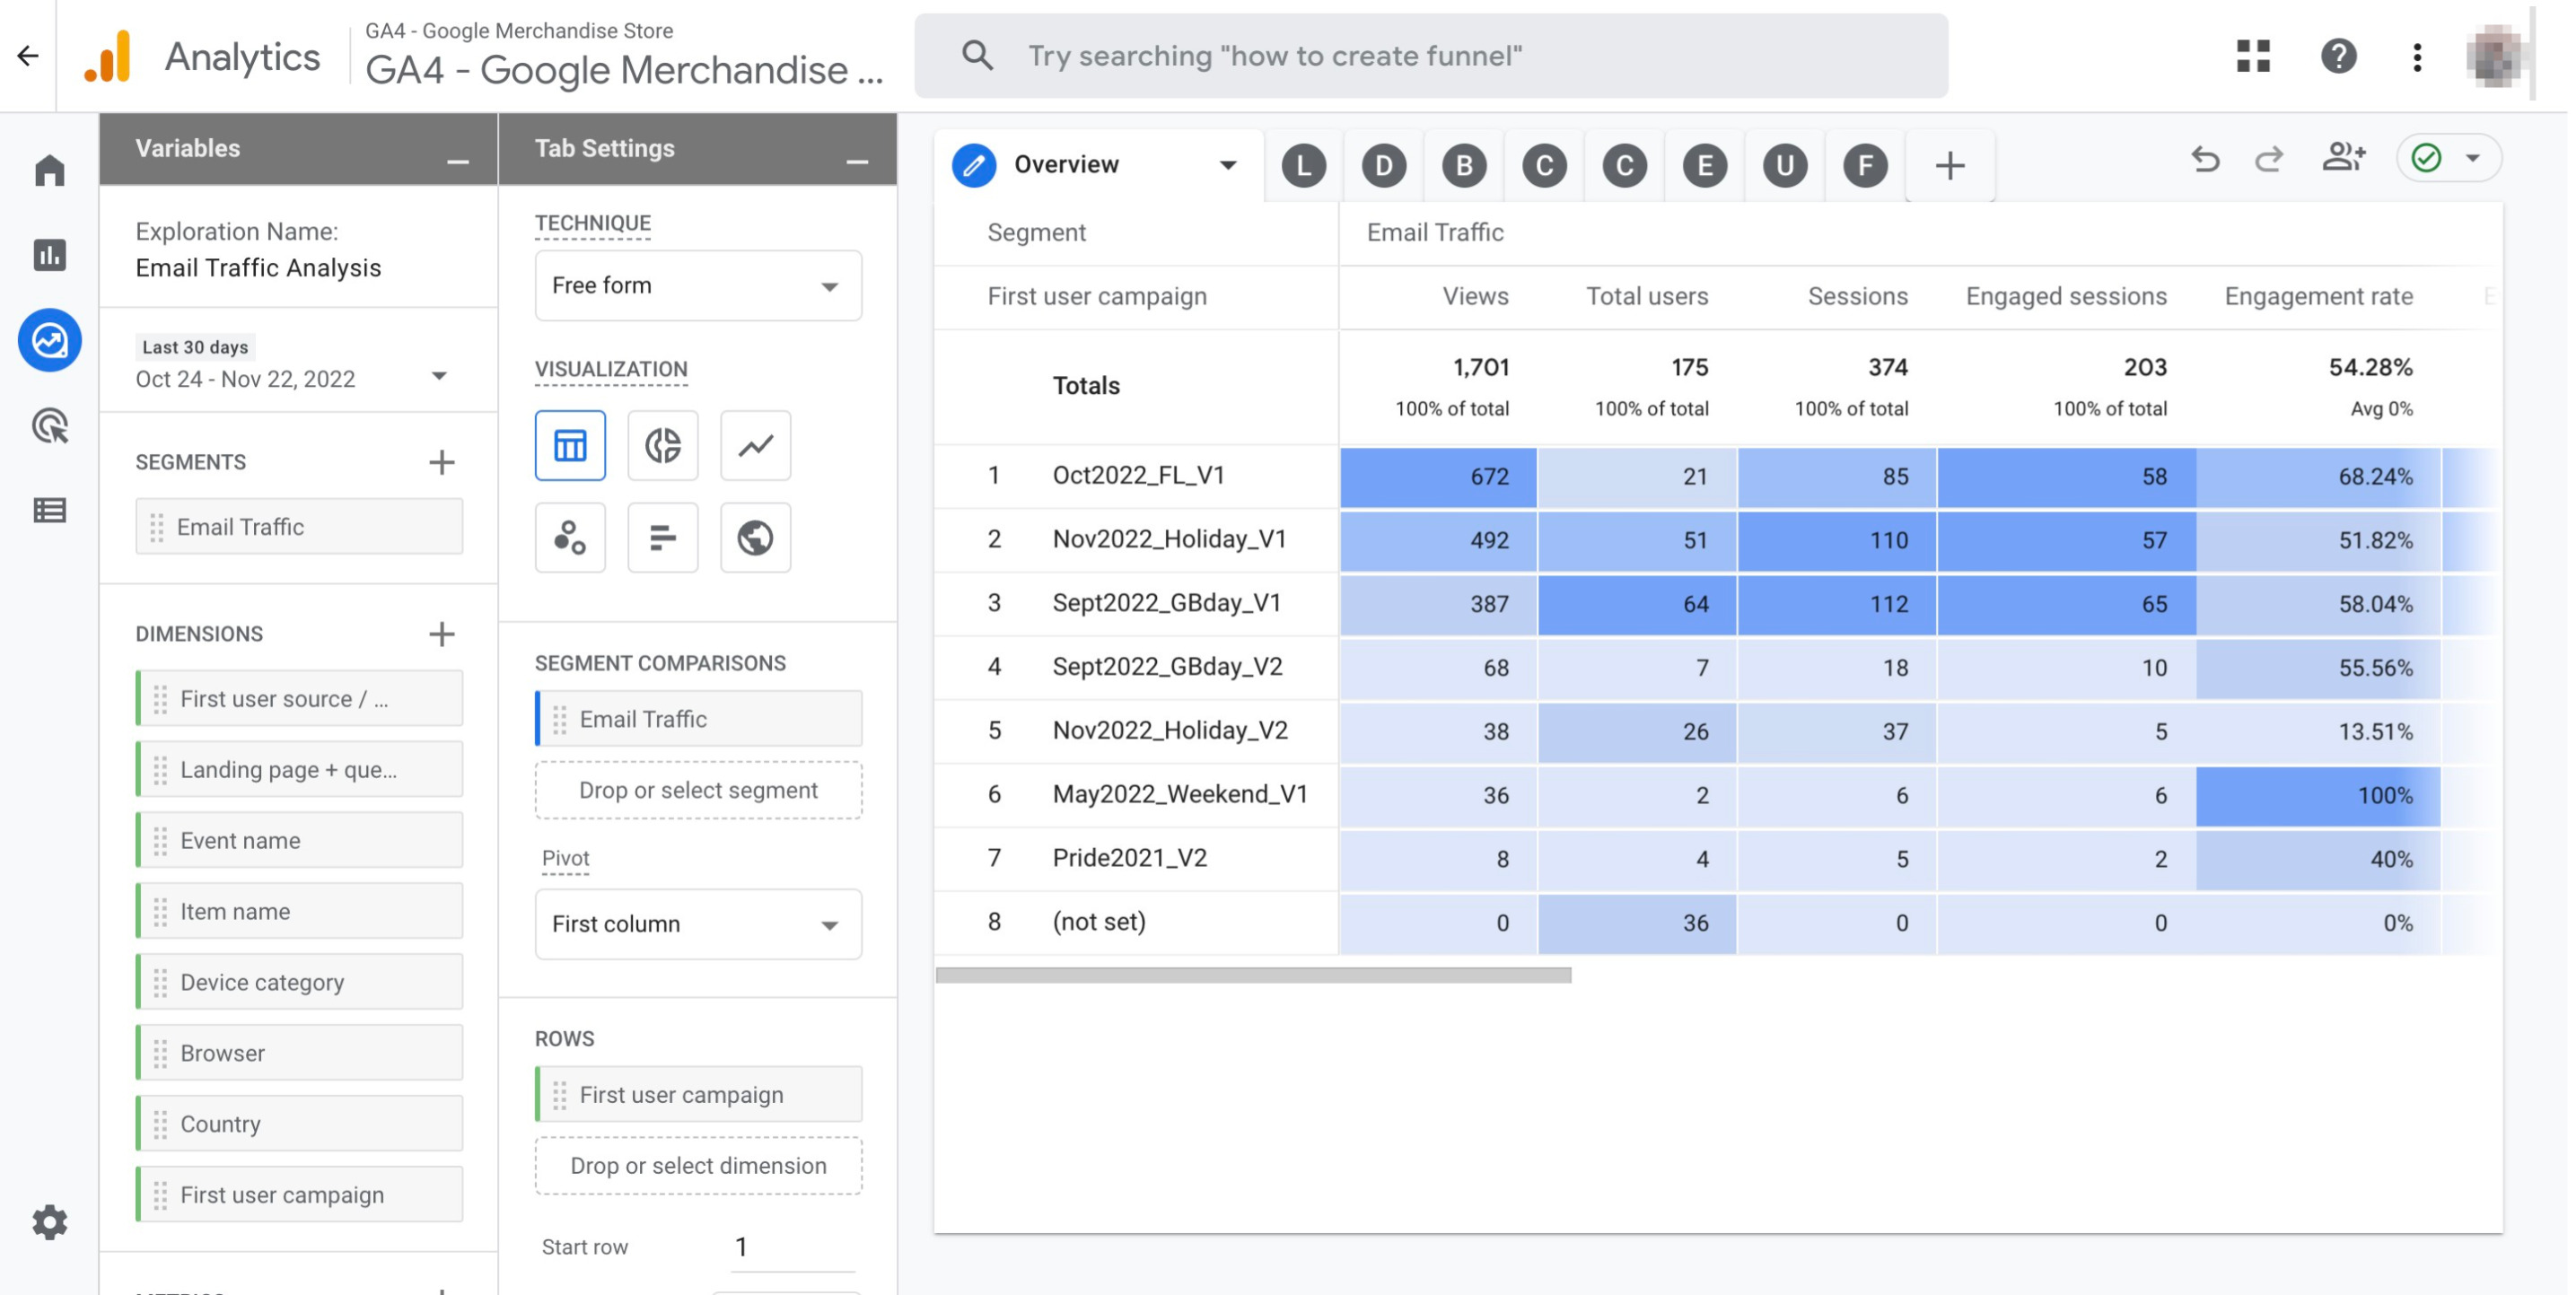
Basically, this is how you can create different sets of reports to monitor and track email campaigns and traffic in Google Analytics 4.
Conclusion
Setting up comprehensive email tracking in GA4 through Explorations gives you a complete view of your email marketing performance.
By creating these nine specialized tabs, you can analyze everything from campaign overviews to conversion funnels in one organized report.
