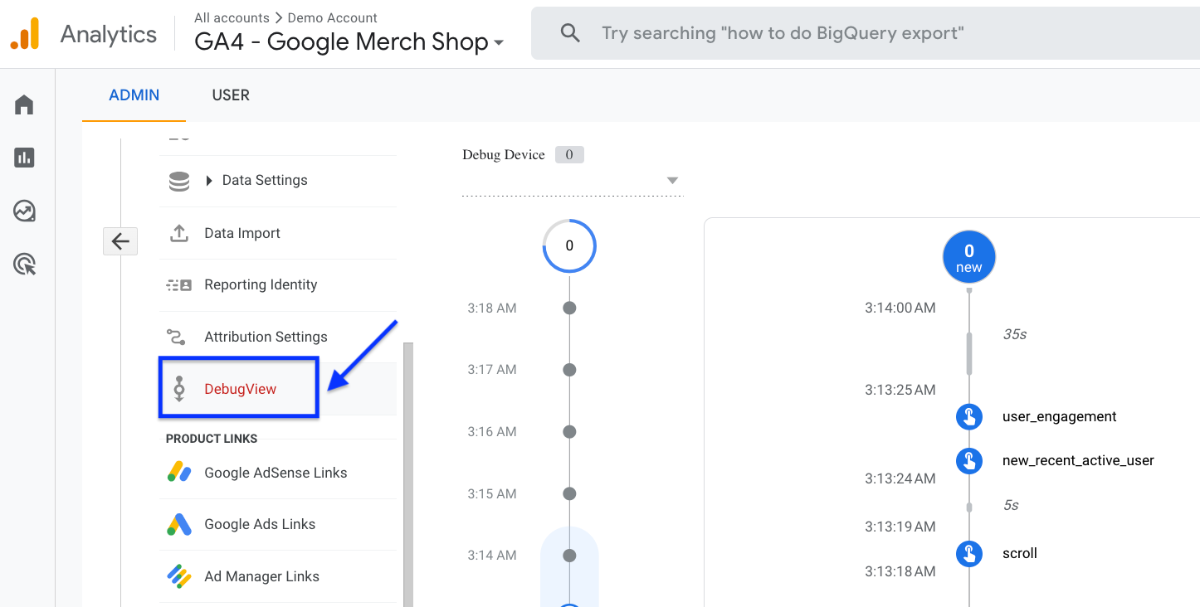
The first thing you should do to fix an issue in GA4 is to enable DebugView . This will let you see the data coming into GA4's interface.
In most cases, you have to wait until you get data in the reports before you can look at it. But with Google Analytics 4, DebugView lets you look at the incoming data while you test your implementations. GA4 debugger can be turned on in three ways for websites:
- Using GA Debugger add-on for Chrome
- Checking Preview mode in Google Tag Manager
- Sending a debug_mode parameter with GTM
Let's explore how to use each method to debug GA4 issues.
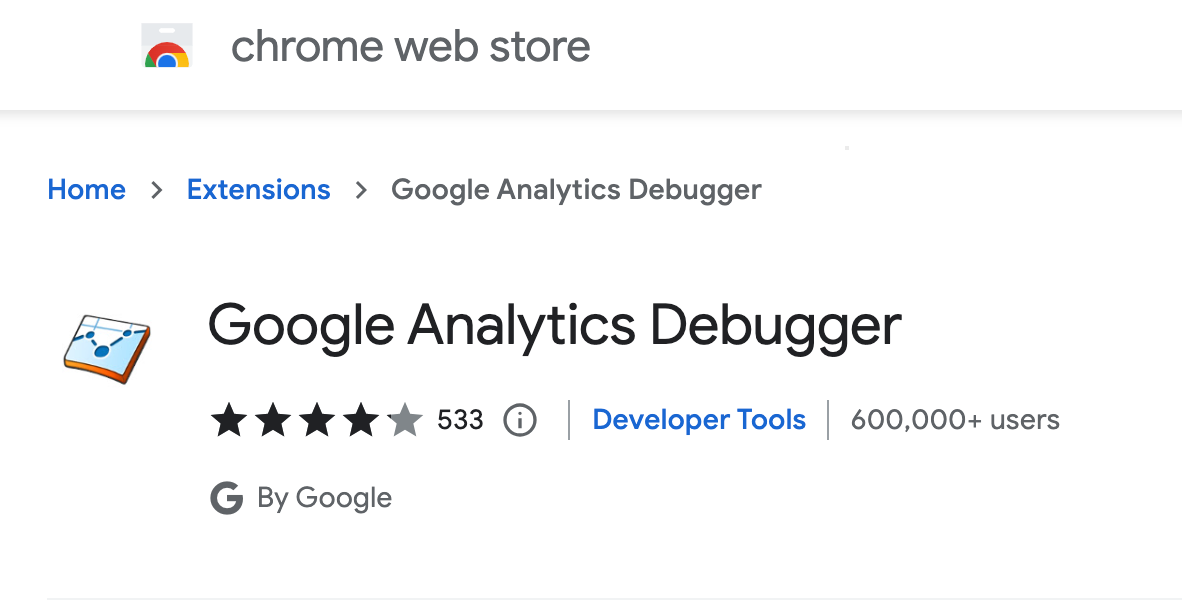
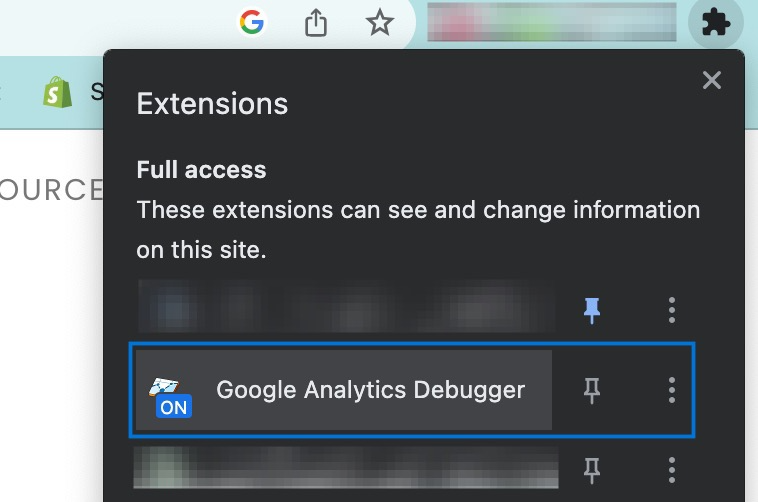
About Google Analytics Debugger Extension
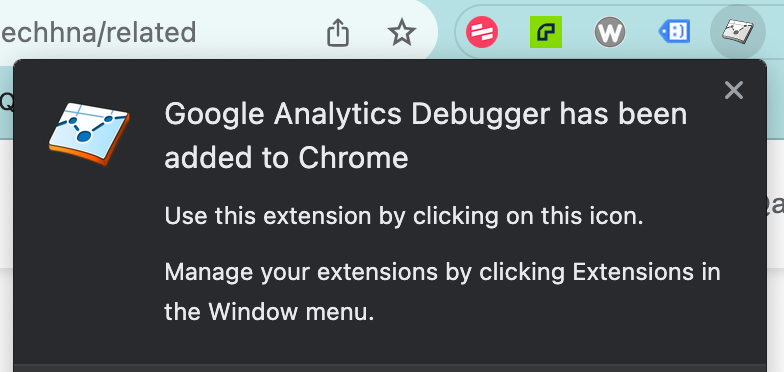
The Google Analytics Debugger extension for Chrome, which is free and made by Google, is a quick and easy way to turn on debugging mode in GA4.
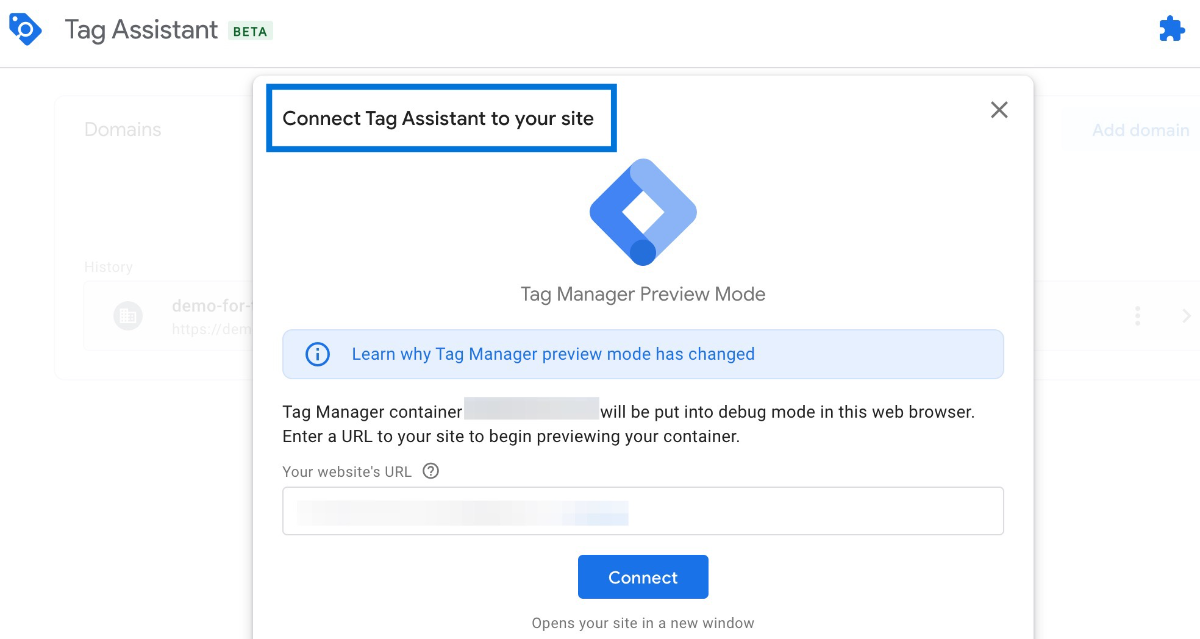
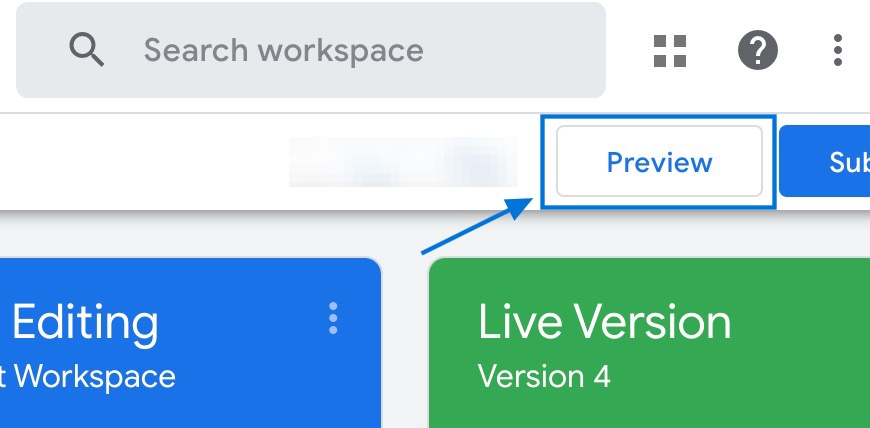
GTM's Preview Mode
The Preview mode in Google Tag Manager is another common way to let GA4's debugger get any testing data.
You can see if the tags are being fired and then see if GA4 is getting the right data if you set up GA4 with GTM.
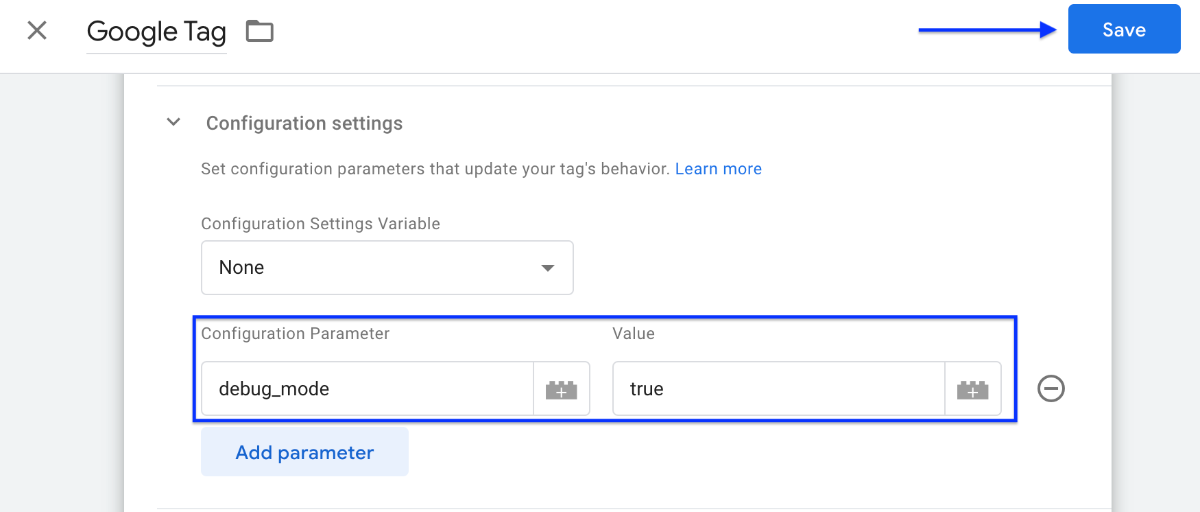
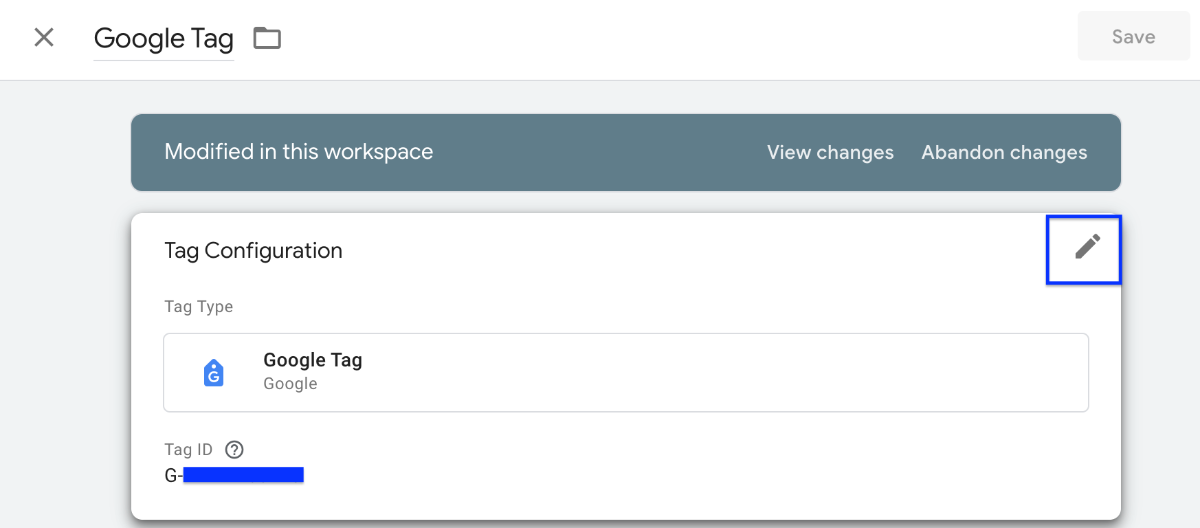
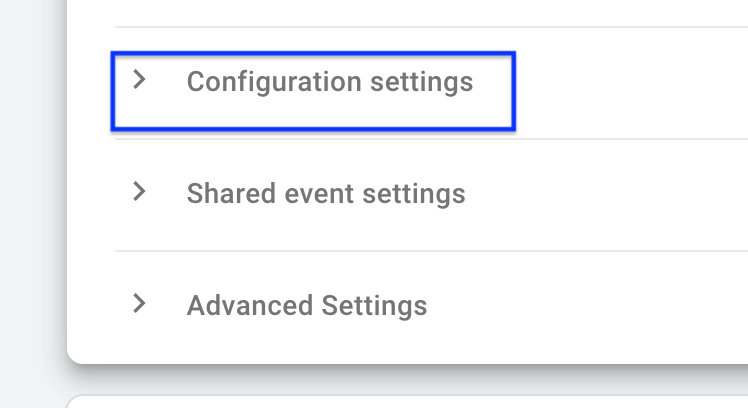
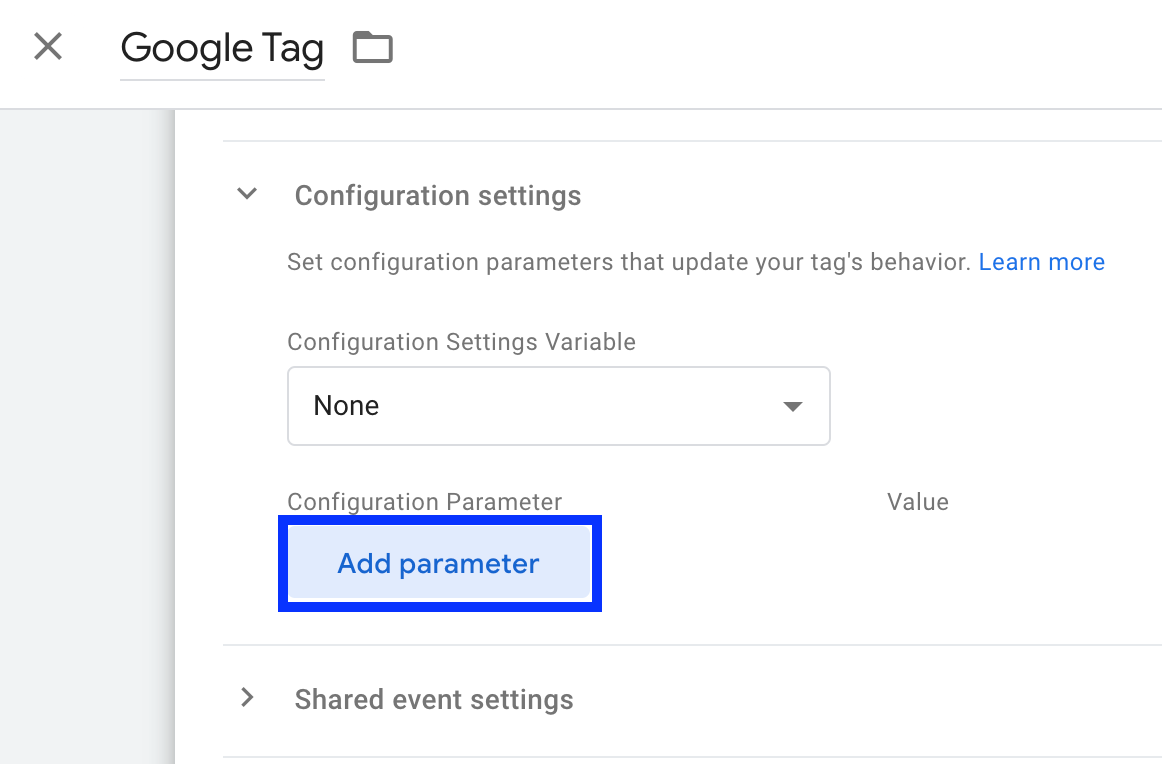
Send a debug parameter with GTM
This method takes a little more work than the first two. In this case, you need to send an extra event parameter with the Google Tag (formerly called GA4 Configuration tag) or any other tag you want to test.