To get more insights from your data and improve the way your reports work in GA4 , you can export your reports to Google Sheets.
By connecting Google Sheets and Google Analytics 4, you can improve the effectiveness of your data and reports as you visualize them on another level.
How to Integrate Google Sheets And Google Analytics 4?
You can follow these steps to perform a Google Sheets & GA4 connection that works:
Go to the Sheets page by visiting https://docs.google.com/spreadsheets
Create a new sheet by clicking the plus sign.

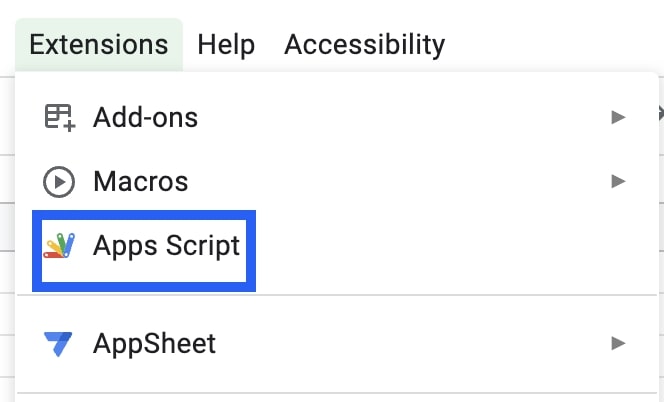
Find the Apps Script under Extensions.
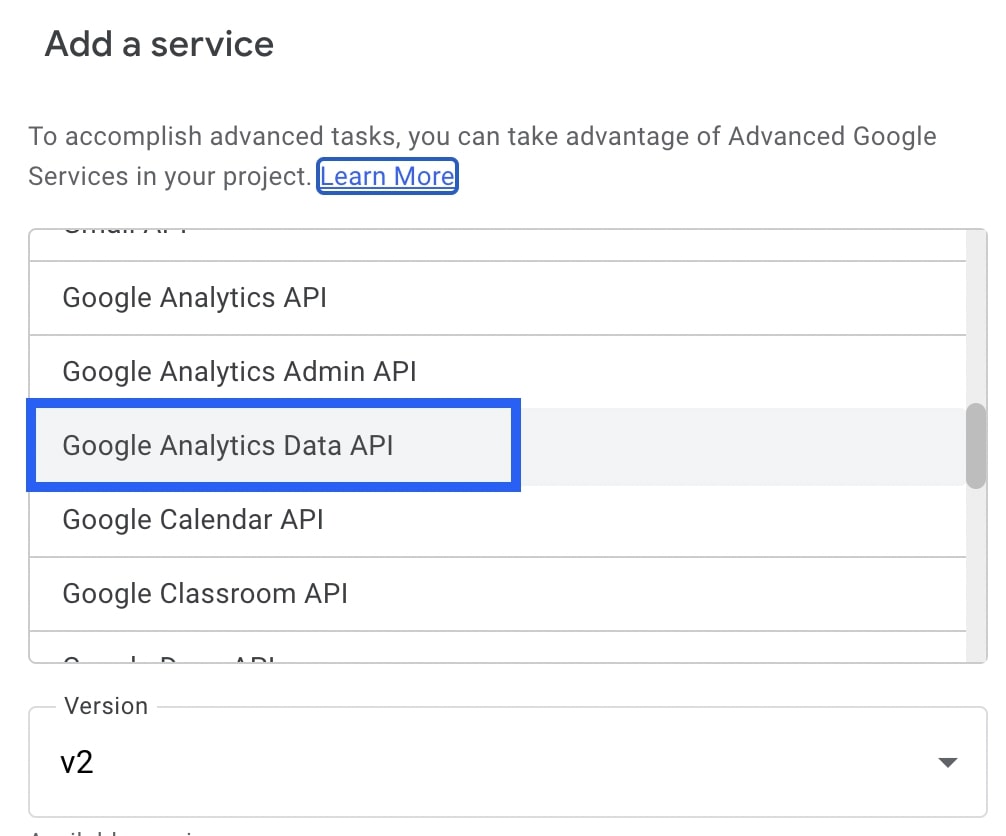
Next, click the + sign found in the Services.

Select the Google Analytics Data API, and click the Add button without making any changes to the Version and Identifier fields.
Copy & paste the code block you see below:
 /**
 * Runs a report of a Google Analytics 4 property ID. Creates a sheet with the
 * report.
 */
function runReport() {
  /**
   * TODO(developer): Uncomment this variable and replace with your
   *   Google Analytics 4 property ID before running the sample.
   */
  const propertyId = 'YOUR-GA4-PROPERTY-ID';

  try {
    const metric = AnalyticsData.newMetric();
    metric.name = 'activeUsers';

    const dimension = AnalyticsData.newDimension();
    dimension.name = 'city';

    const dateRange = AnalyticsData.newDateRange();
    dateRange.startDate = '2020-03-31';
    dateRange.endDate = 'today';

    const request = AnalyticsData.newRunReportRequest();
    request.dimensions = [dimension];
    request.metrics = [metric];
    request.dateRanges = dateRange;

    const report = AnalyticsData.Properties.runReport(request,
        'properties/' + propertyId);
    if (!report.rows) {
      Logger.log('No rows returned.');
      return;
    }

    const spreadsheet = SpreadsheetApp.create('Google Analytics Report');
    const sheet = spreadsheet.getActiveSheet();

    // Append the headers.
    const dimensionHeaders = report.dimensionHeaders.map(
        (dimensionHeader) => {
          return dimensionHeader.name;
        });
    const metricHeaders = report.metricHeaders.map(
        (metricHeader) => {
          return metricHeader.name;
        });
    const headers = [...dimensionHeaders, ...metricHeaders];

    sheet.appendRow(headers);

    // Append the results.
    const rows = report.rows.map((row) => {
      const dimensionValues = row.dimensionValues.map(
          (dimensionValue) => {
            return dimensionValue.value;
          });
      const metricValues = row.metricValues.map(
          (metricValues) => {
            return metricValues.value;
          });
      return [...dimensionValues, ...metricValues];
    });

    sheet.getRange(2, 1, report.rows.length, headers.length)
        .setValues(rows);

    Logger.log('Report spreadsheet created: %s',
        spreadsheet.getUrl());
  } catch (e) {
    // TODO (Developer) - Handle exception
    Logger.log('Failed with error: %s', e.error);
  }
}
In the 'YOUR-GA4-PROPERTY-ID' section in the code block, add the id of the property you want to monitor data from. You can find the ID in Property Settings:

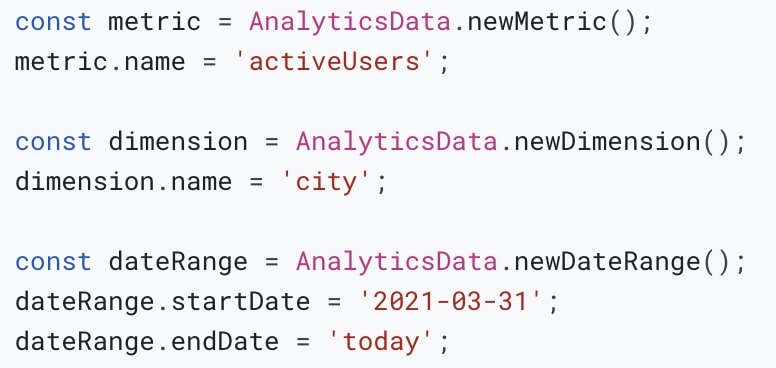
Add the dimensions and metrics you want to see later in the 'const metric' and 'const dimension' fields, specify your date range from the 'const dateRange' field, and save the project.
After completing all the arrangements, run the report by clicking 'Run'.
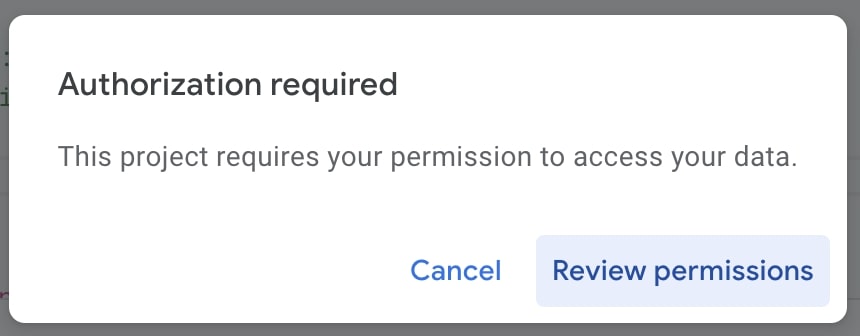
While the report is running, you will see the Authorization required request. Proceed by clicking on Review permission.
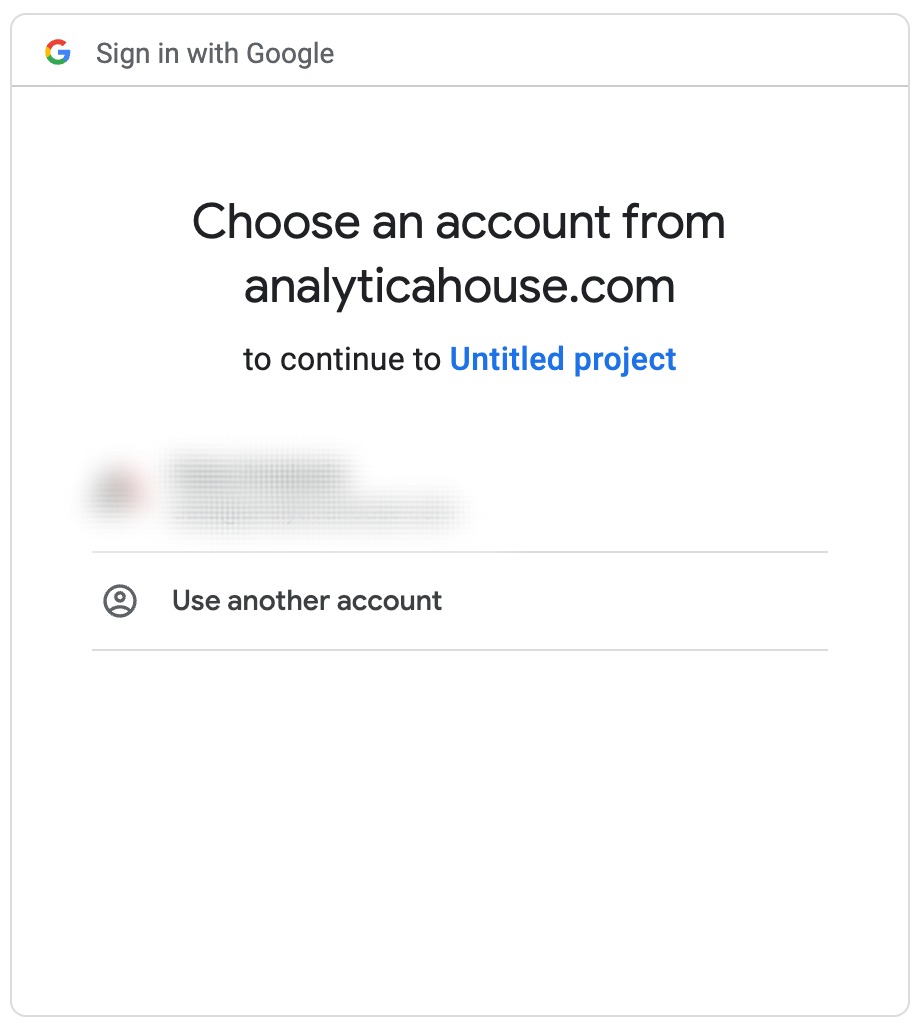
Choose the account that the GA4 property is connected to.
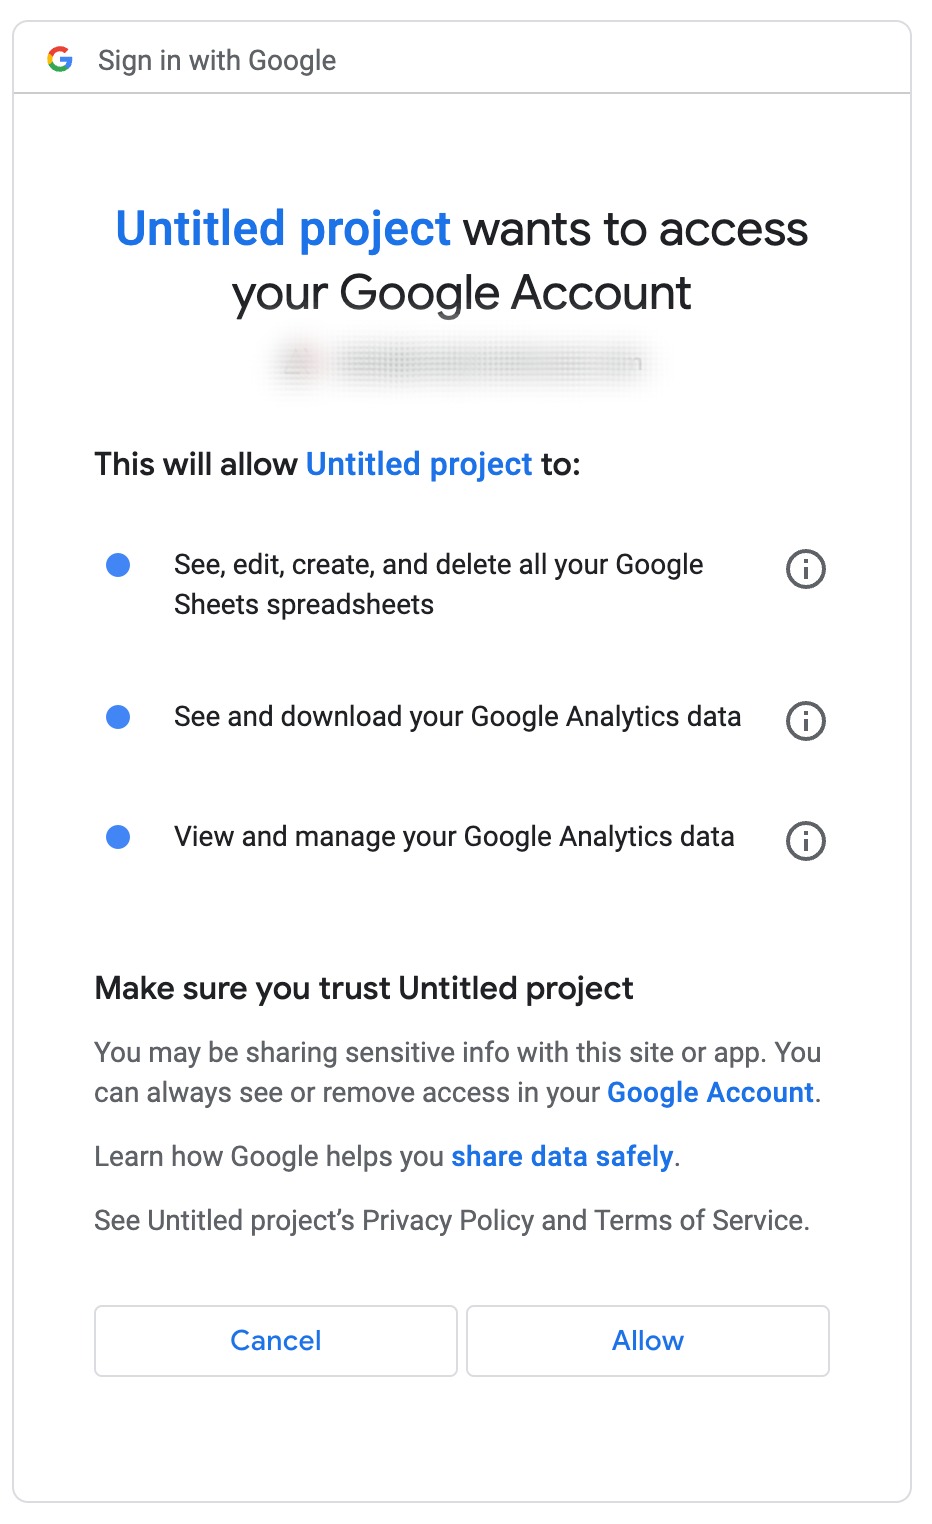
Click 'Allow'.
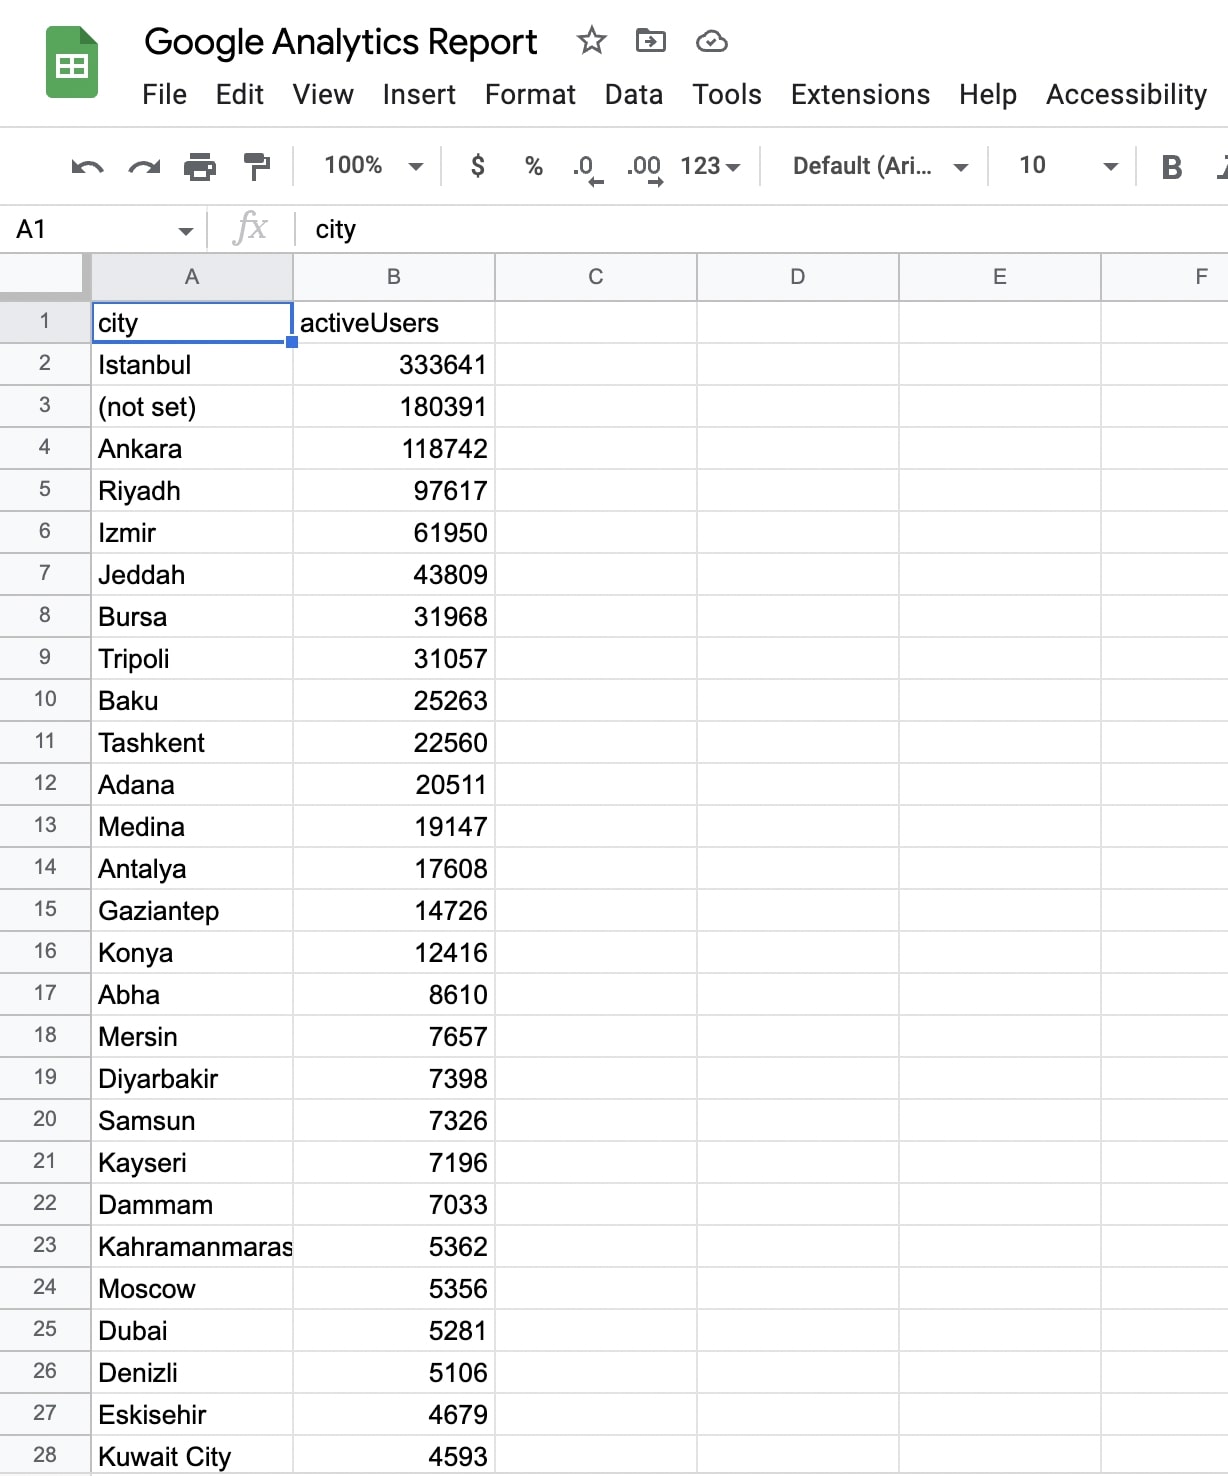
If the script page runs successfully, you will see a sheet url.

And your report is completed for the dates, metrics, and dimensions you selected.
Conclusion: How To Import Google Analytics 4 Data to Google Sheets?
By importing GA4 data to Google Sheets, you gain more flexibility in how you analyze and present your analytics data.
This connection creates a powerful workflow where you can combine GA4's robust tracking with Google Sheets' familiar spreadsheet capabilities.
