You secure powerful reporting with Google Analytics 4. Still, you can improve the way you see your data by implementing additional tools such as Google Data Studio (now Looker Studio ).
This way, you can benefit from quality data visualization that Data Studio provides.
How to Integrate Data Studio (Looker Studio) & Google Analytics 4?
You can follow these steps to create a numerical or visual GA4 report using Data Studio:
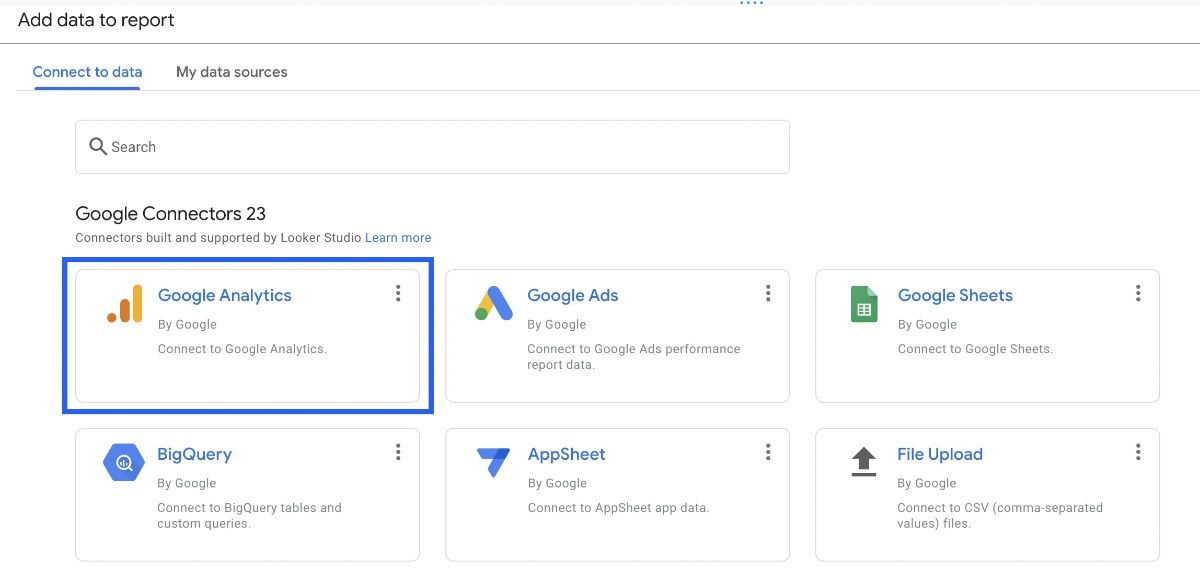
Go to Datastudio by visiting https://datastudio.google.com/
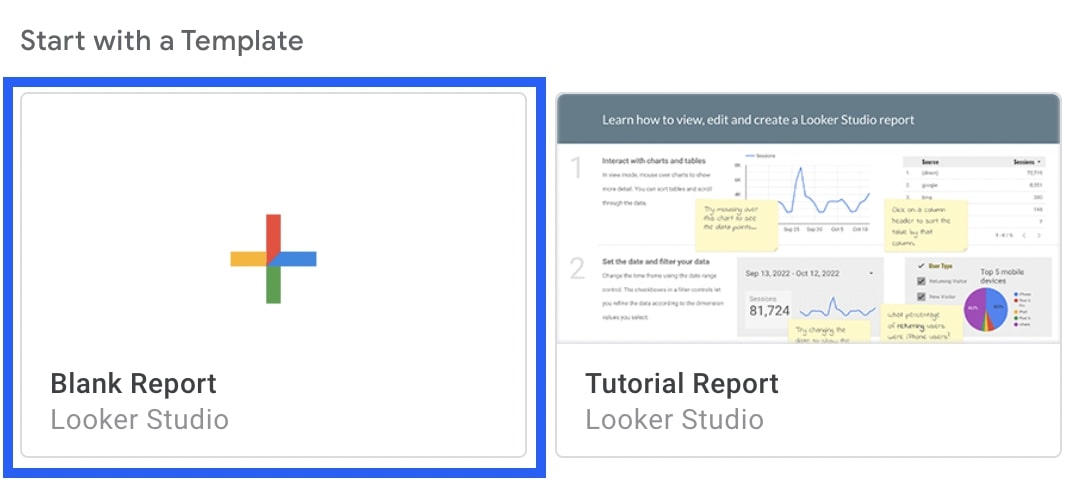
Create a new blank report by clicking the plus sign.
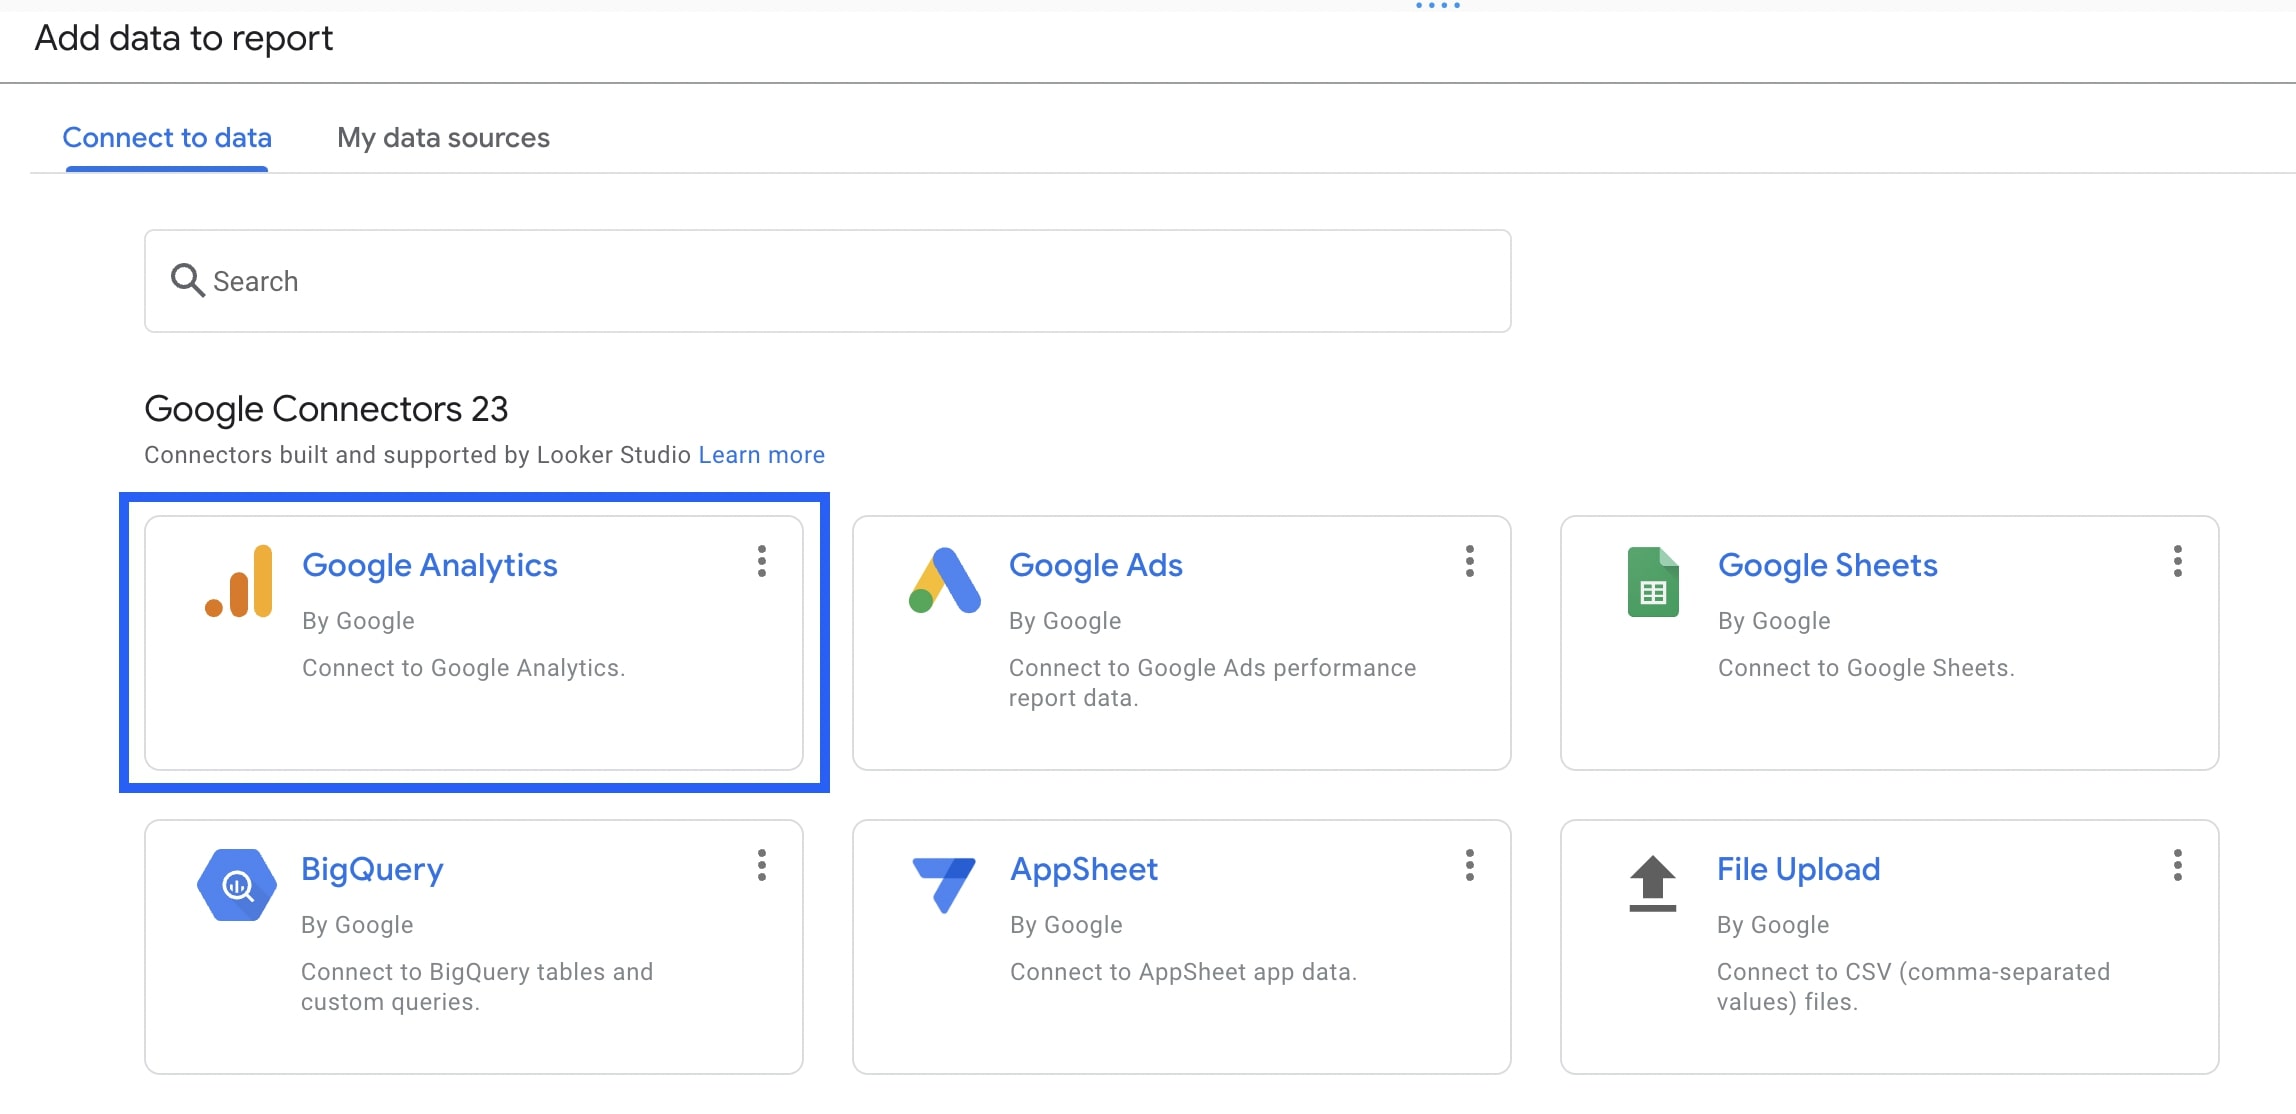
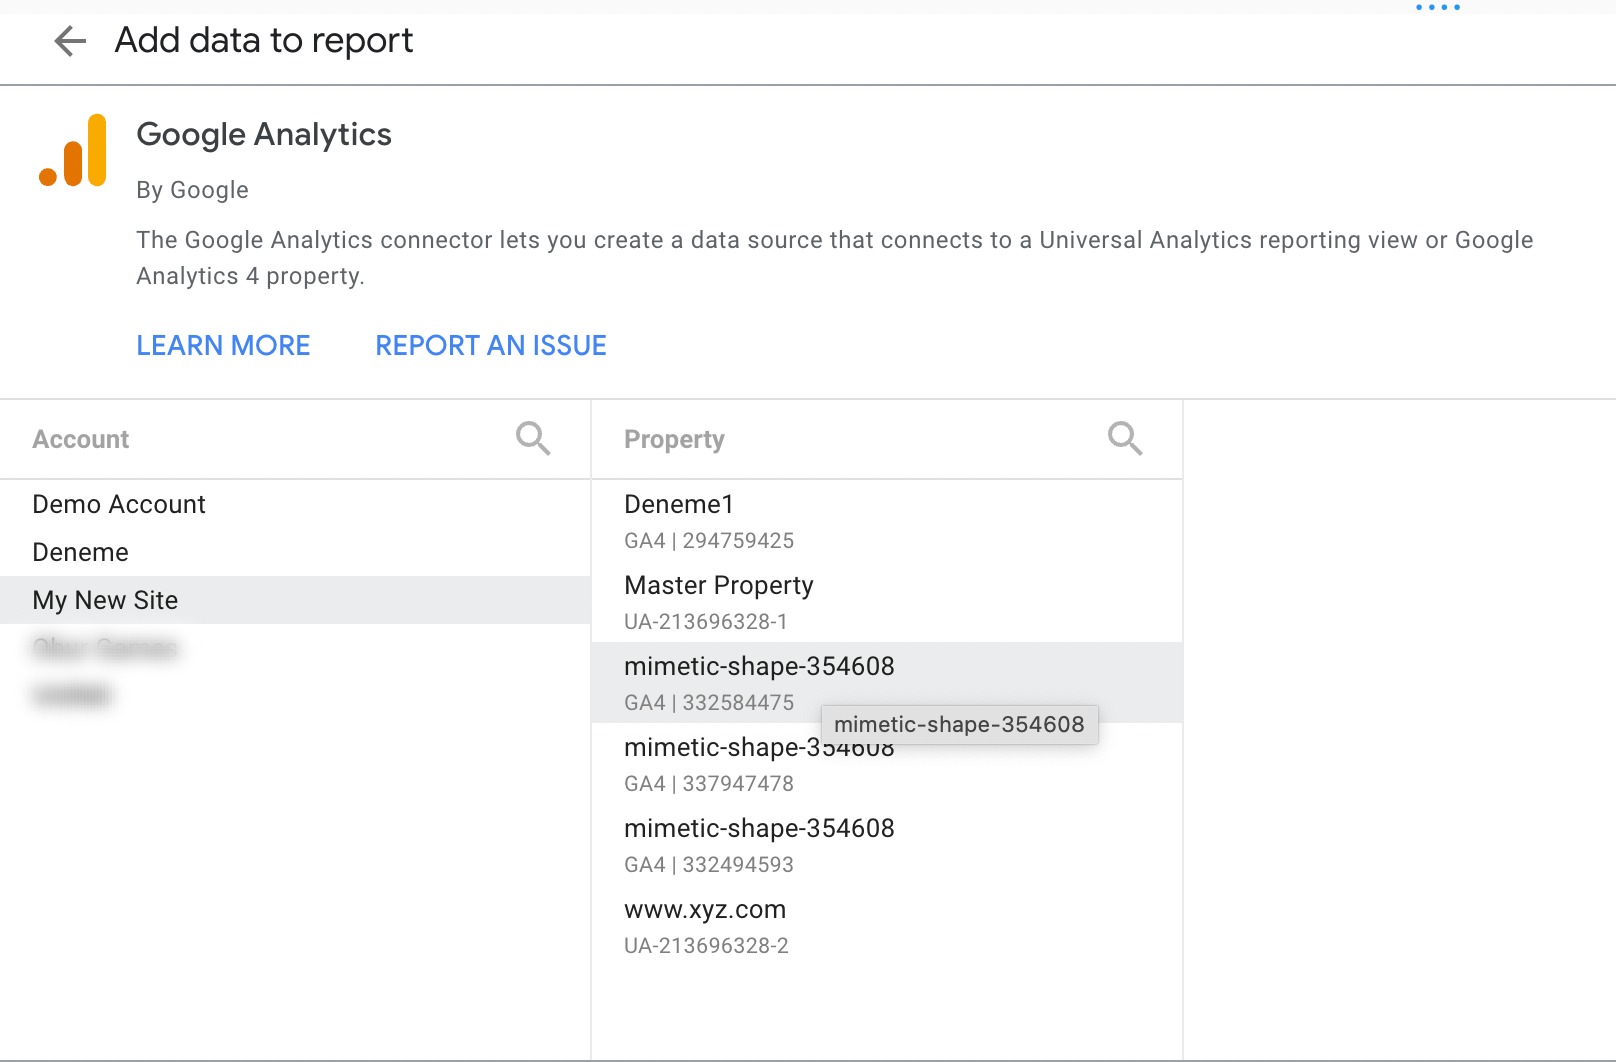
Choose Google Analytics as the data source.
Choose the account and property you want to report data from, then click the Add button.
Now, you can complete your report by adding the dimensions and metrics you want to analyze in a certain time period.
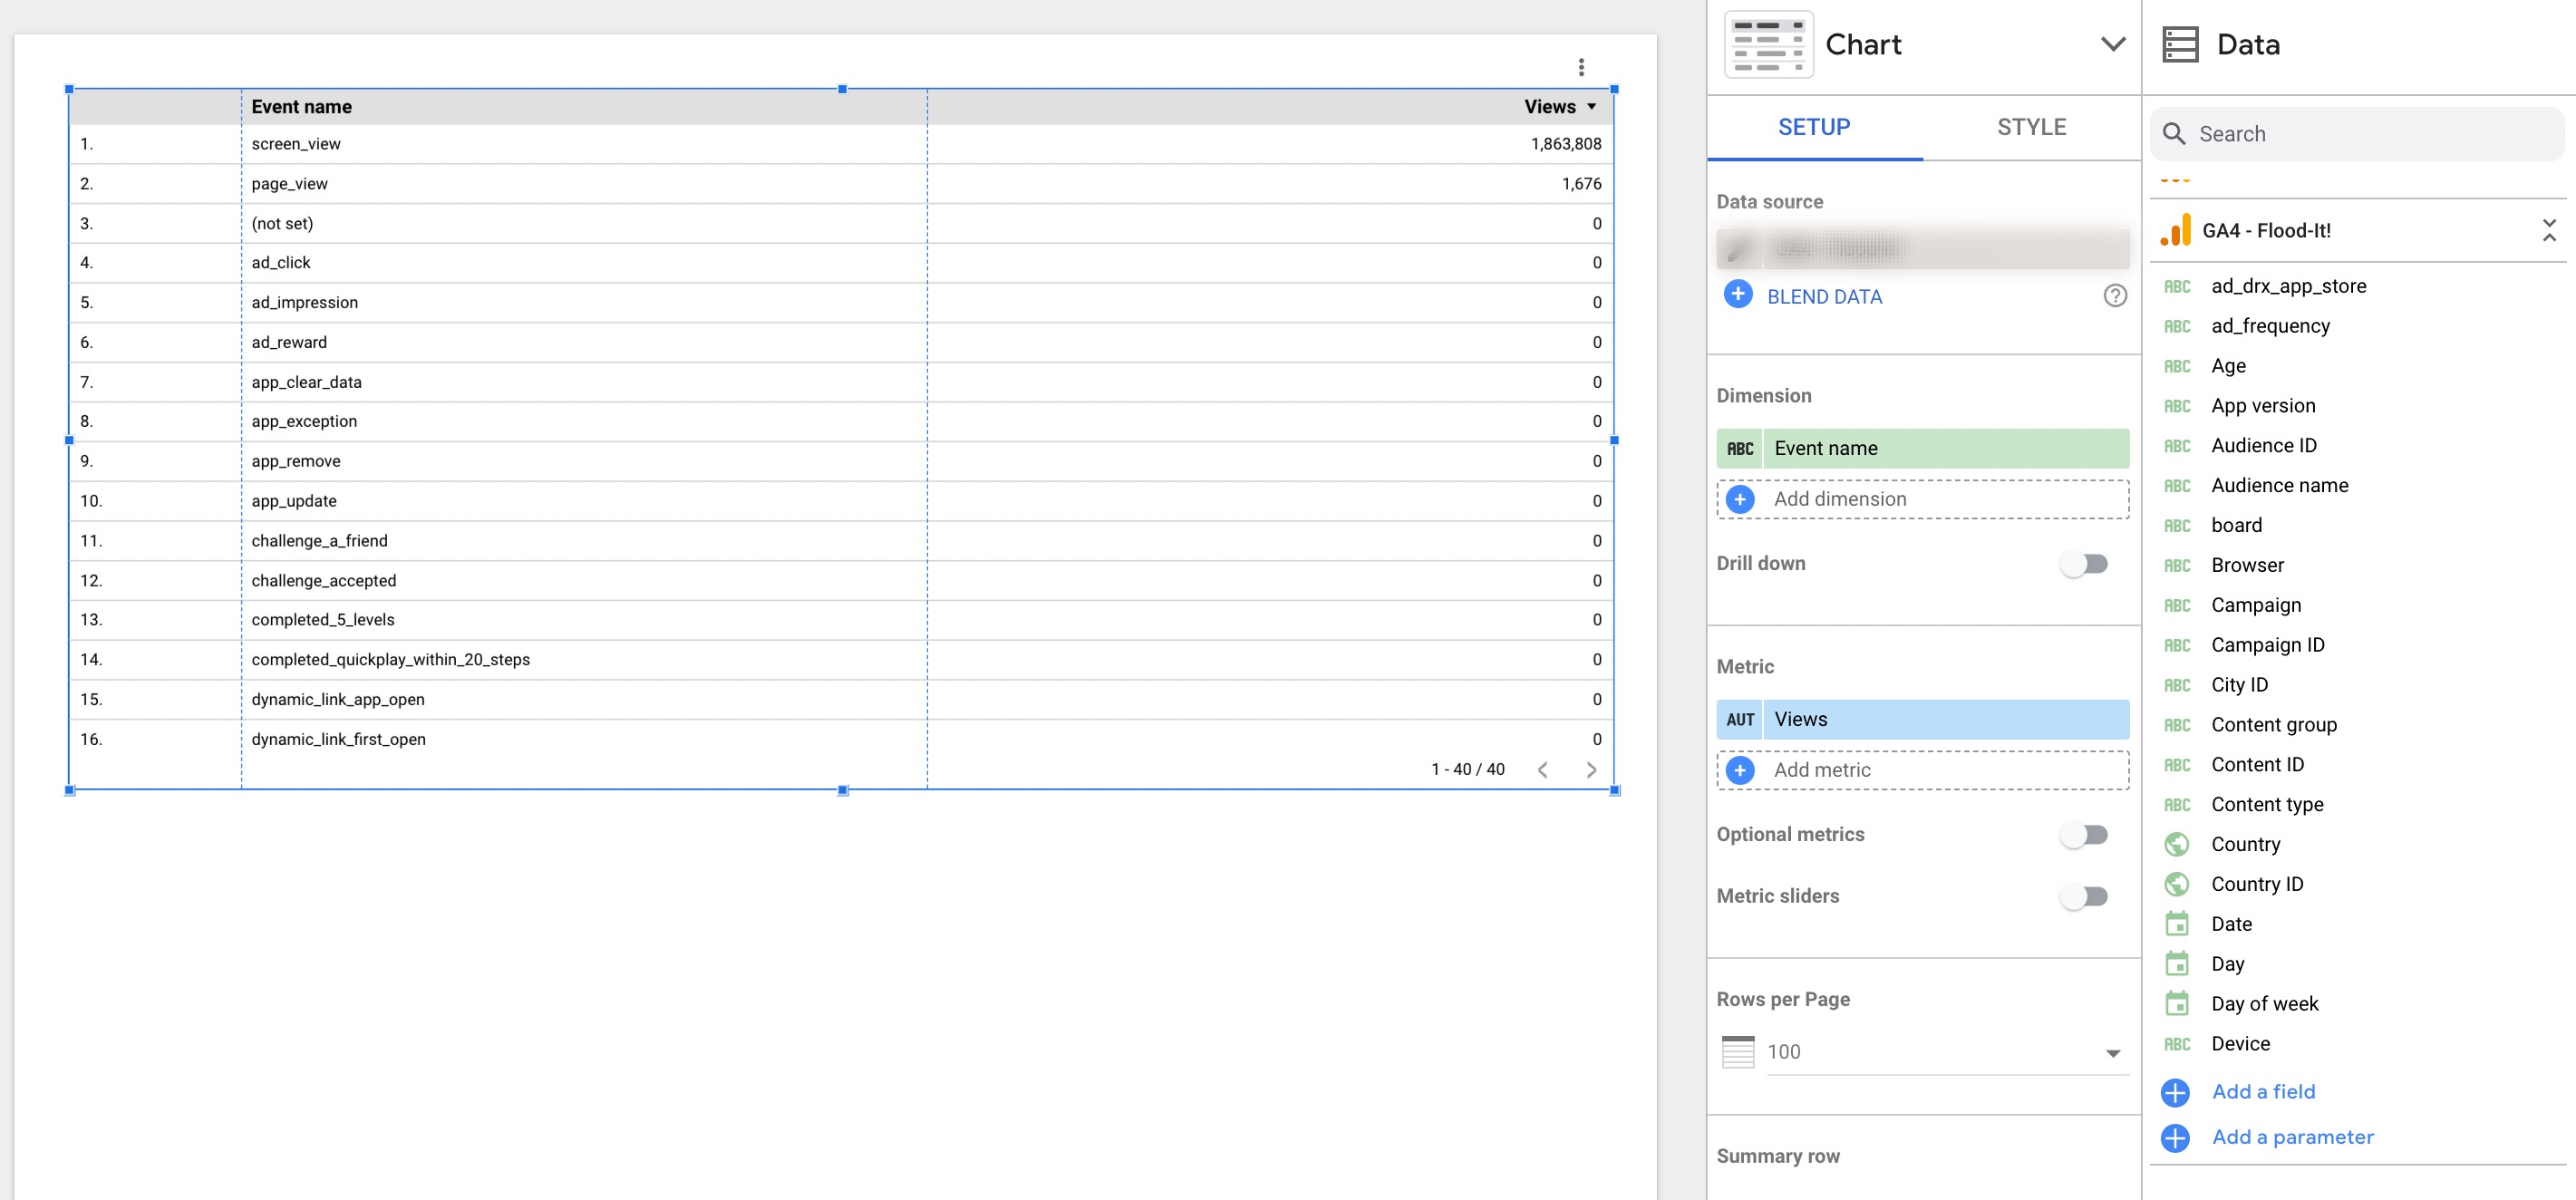
Now that you have completed the Google Data Studio & Google Analytics 4 Connection, you can change the following settings if needed:
Data Freshness: It indicates how recent the data found in a report is. While 12 hours is the default, data freshness requirements or expectations might vary depending on the type of your report. For instance, if you'd like to monitor the ad performance on your website, opting for daily updates can serve well. However, if you'd like to get reports based on social media analytics, you may need data updated several times during the day.
You can perform changes to data freshness within a report, or from the Data Sources home page. Just click 'Data freshness' at the top, and then choose a new refresh option under 'Check for fresh data', and then set the data freshness according to your needs.
Community Visualizations: These, which are ON by default, refer to charts designed by third-party developers that work with your data. You can configure them the way you do the other default charts.
If you want to set this ON, click 'Community visualizations and components' icon in the toolbar. Then, choose a visualization.
Field Editing: You can modify the field definitions at the chart level by using the Field Editing in Reports data source option. It allows you to enhance your customizations and simplify the process.
If you want to turn field editing on, edit the data source used in your report. Click 'Field Editing' in reports under the data source header.
Once you turn field editing on, you can edit the following:
- the field's name
- a metric's aggregation
- data type of the field
- a metric's comparison or calculation
- a metric's running calculation
Looker Studio and GA4 Integration
Google has renamed the Data Studio as ‘Looker Studio’. Basically, the integration and everything related will work the way it used to.
All you need to do is sign in to Looker Studio and follow the steps you see above. You can merge the power of these two platforms to display your GA4 data in a variety of visuals.
