GA4 is designed to provide simple reporting backed by powerful machine learning to track data.
This allows you to utilize an unprecedented dashboard along with pre-built reports and custom reporting capabilities so you can monitor the data you need the most.
The standard reports are placed in the left navigation, offering you a variety of easy-to-digest summary cards which help you to get your hands on things very quickly. These standard reports letting you get what you need effortlessly come in 6 different main sections.
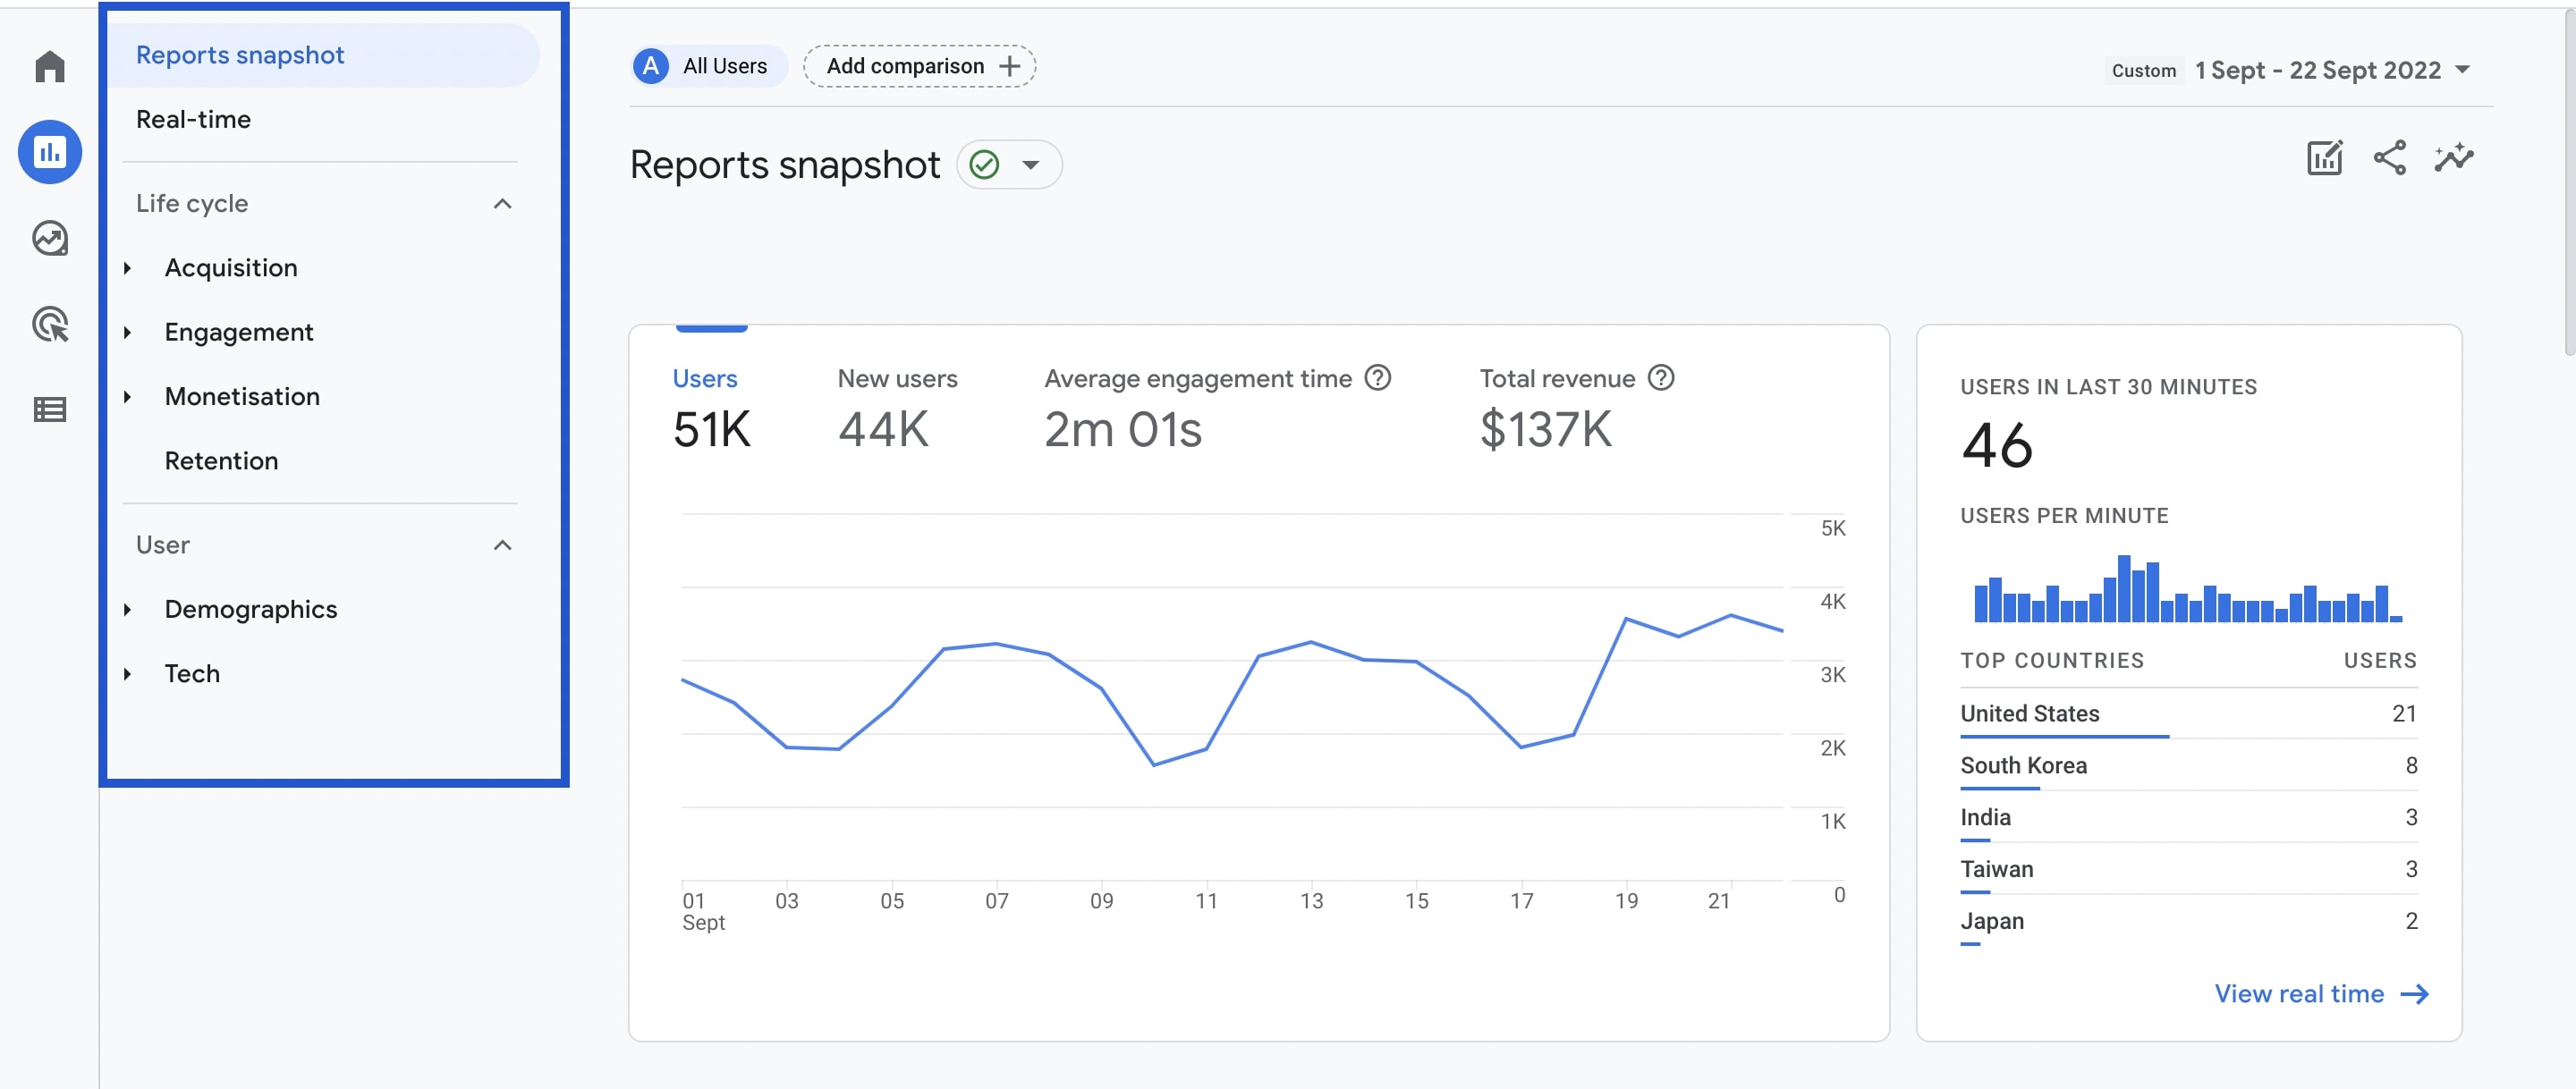
Reports Snapshot
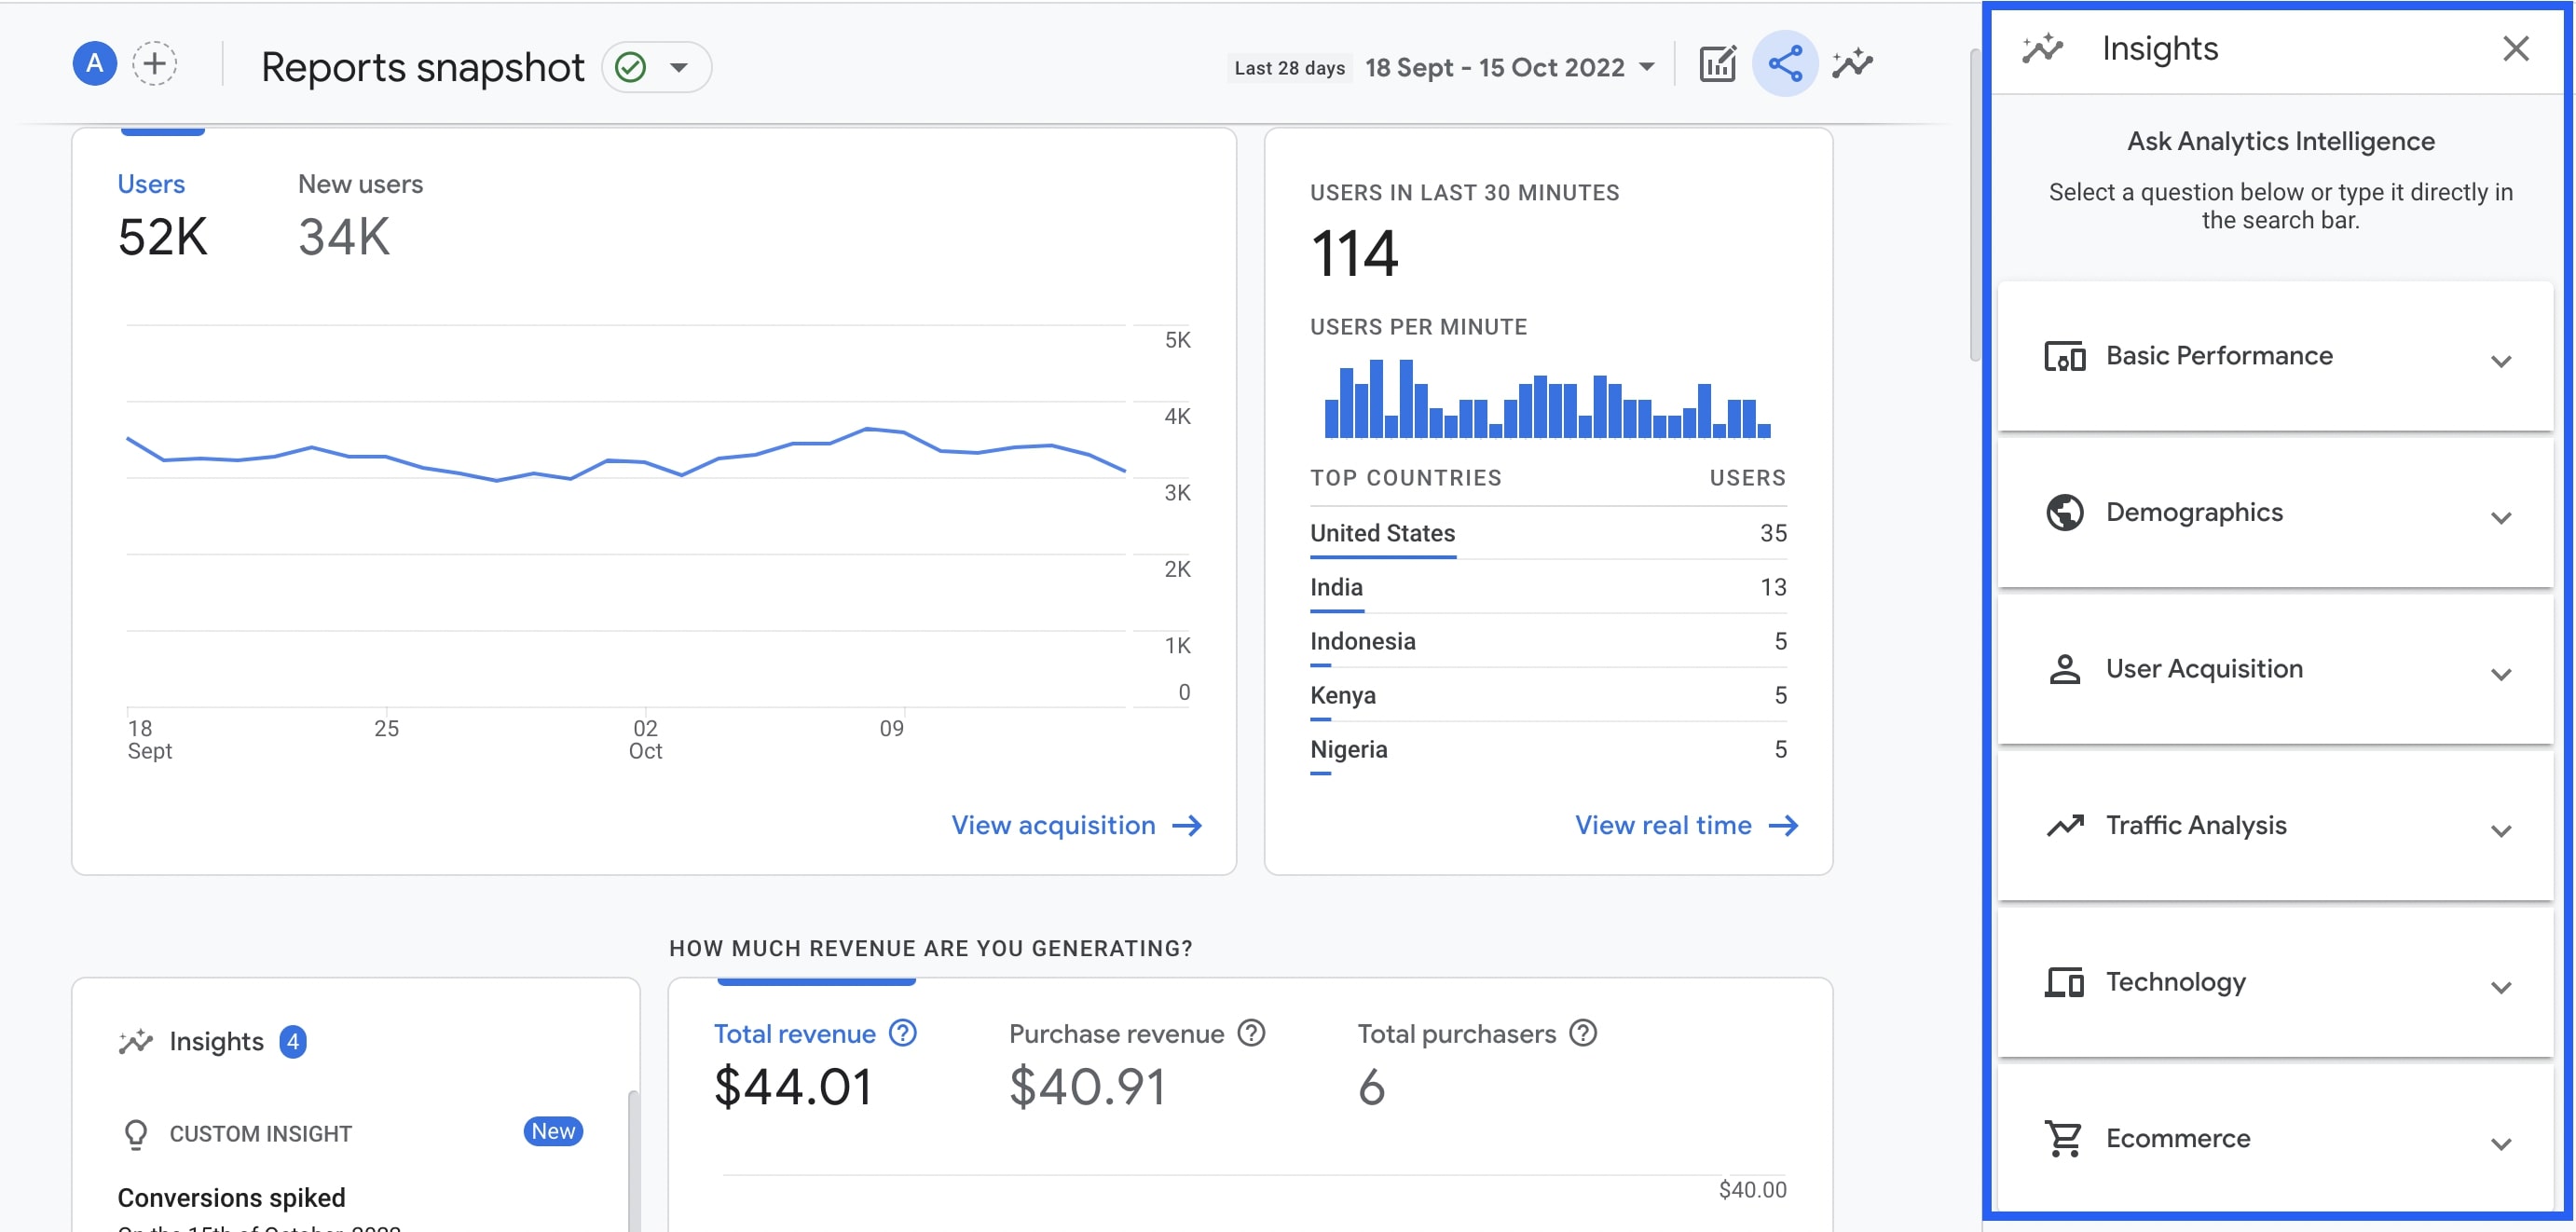
The Reports snapshot is the first thing that comes up on your screen when you find Reports on the left navigation, functioning as an overview report full of summary cards.
You can customize your reports snapshot to catch a more personalized glimpse of your data. To do that, you should simply click the small pencil icon on the top right corner of your panel. Then, you can see the ‘customize report’ on the right hand side. All you have to do is click ‘add cards’ and choose (up to 16 cards) from the list.
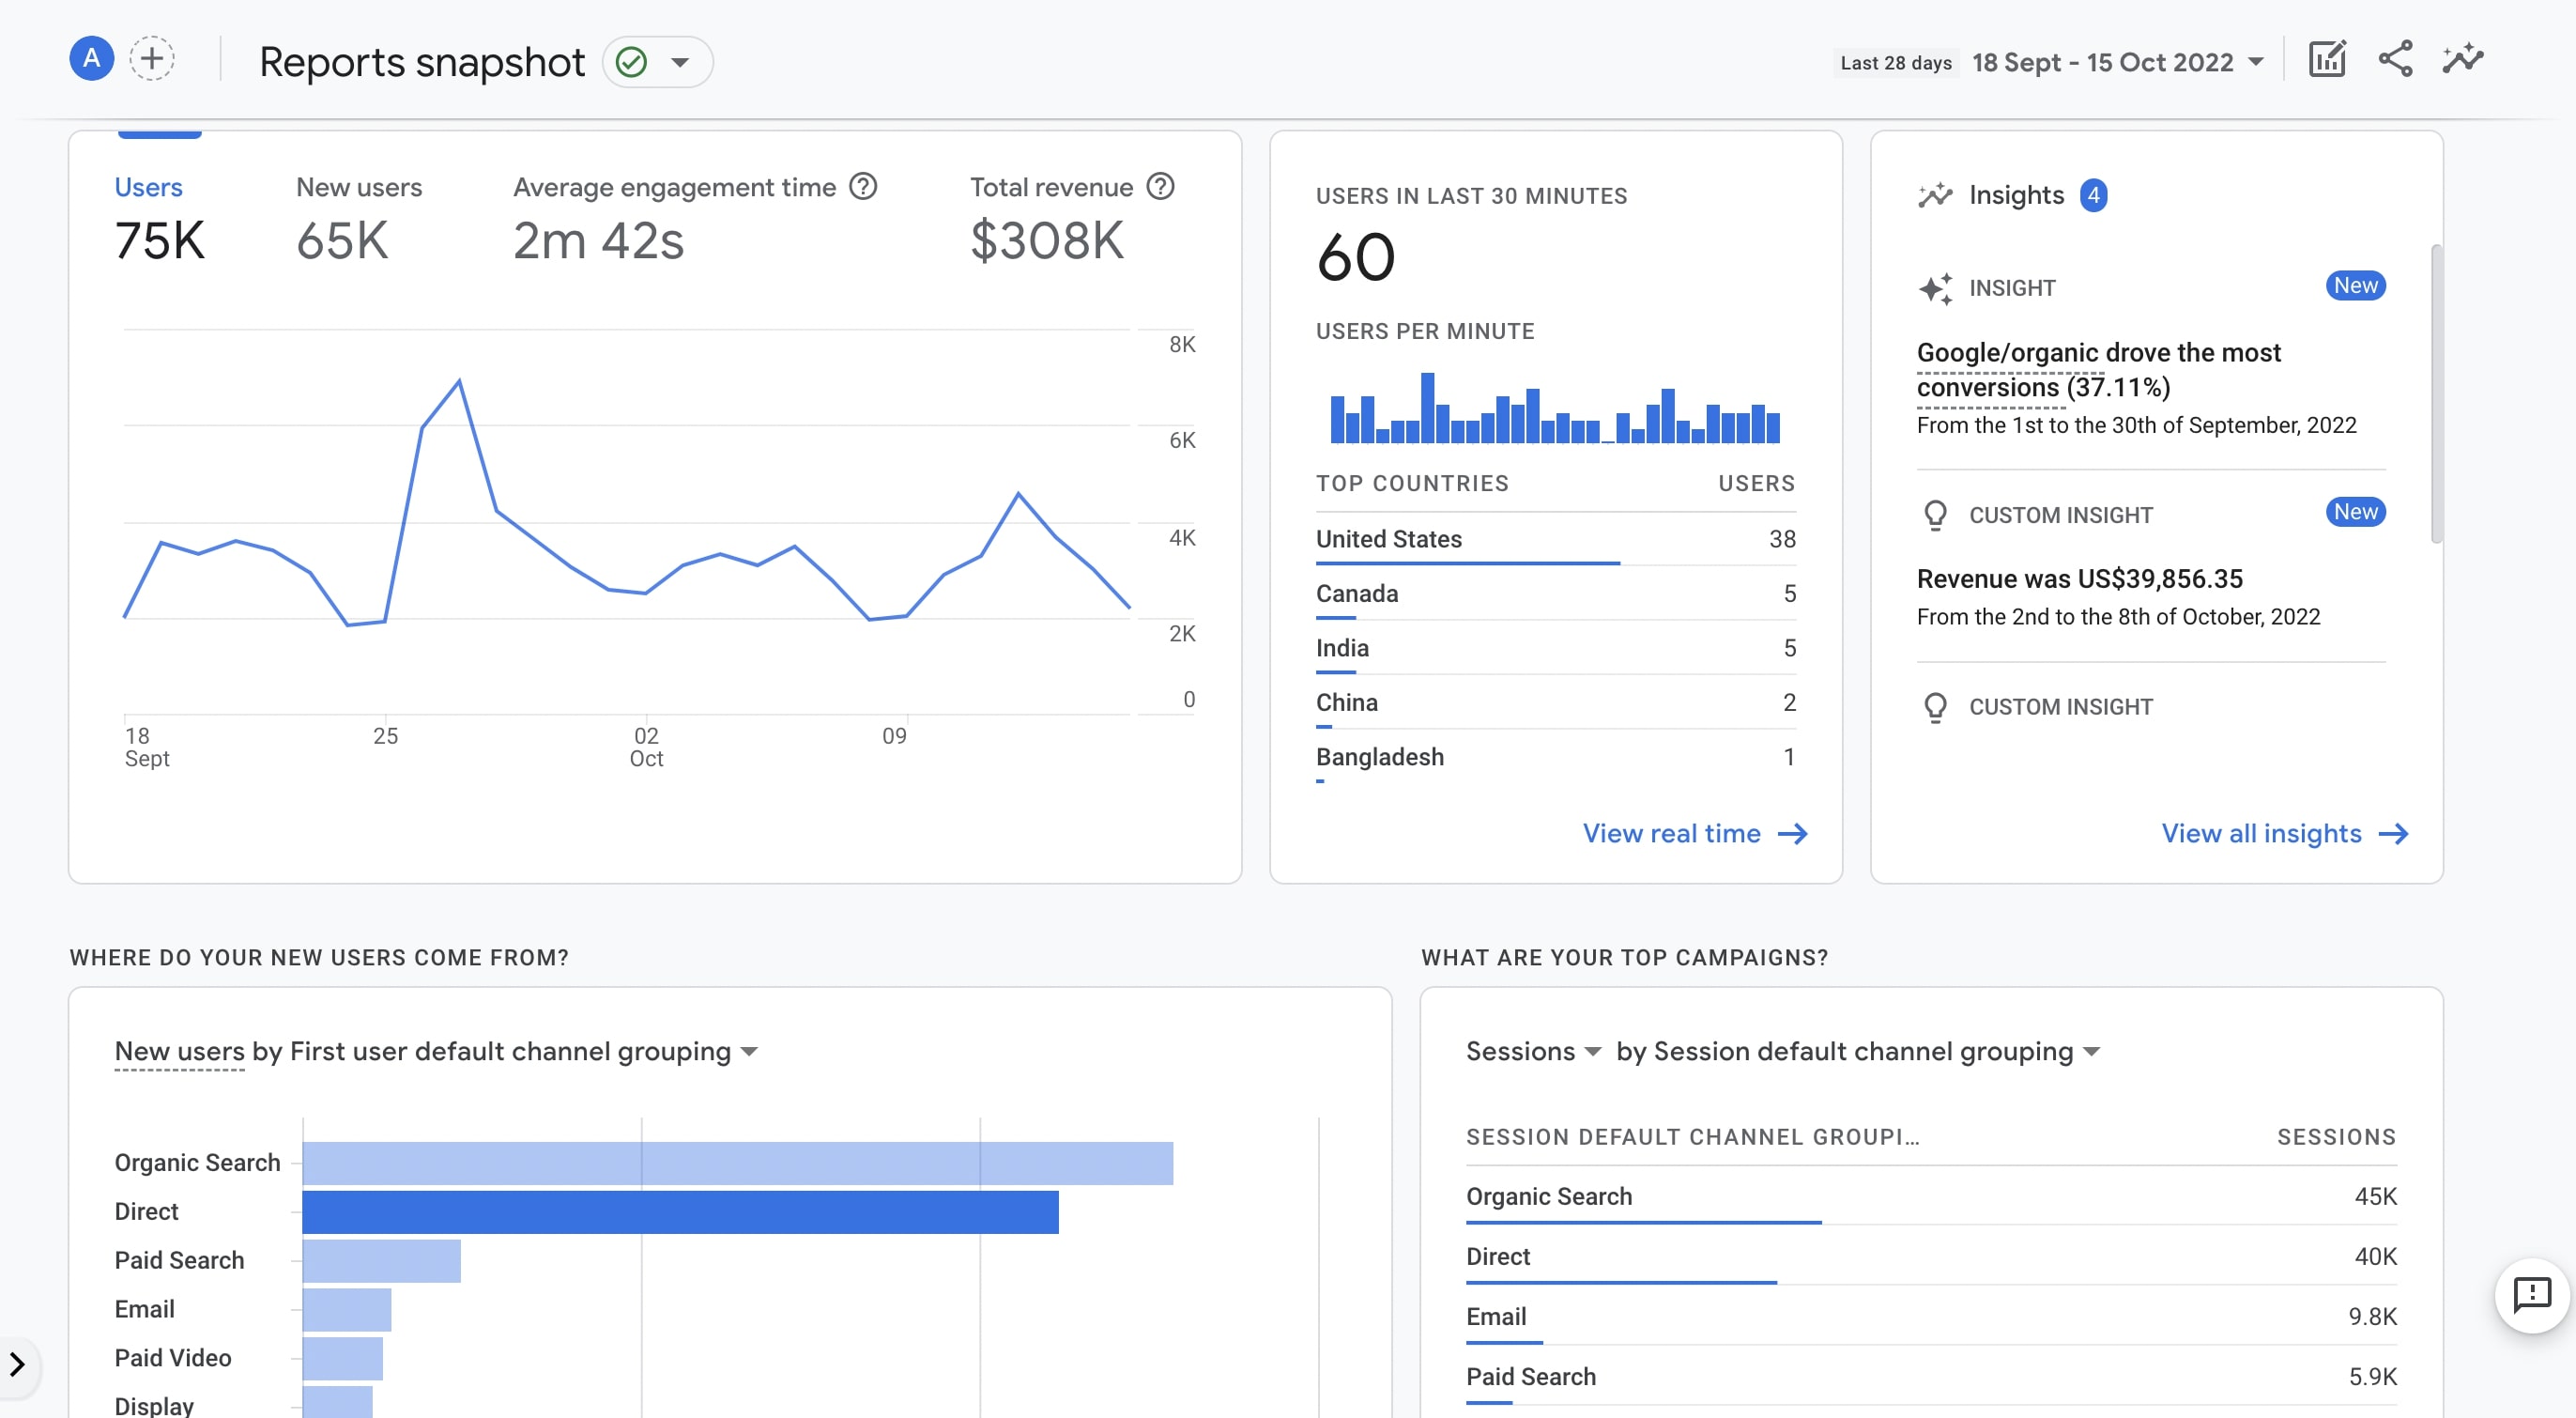
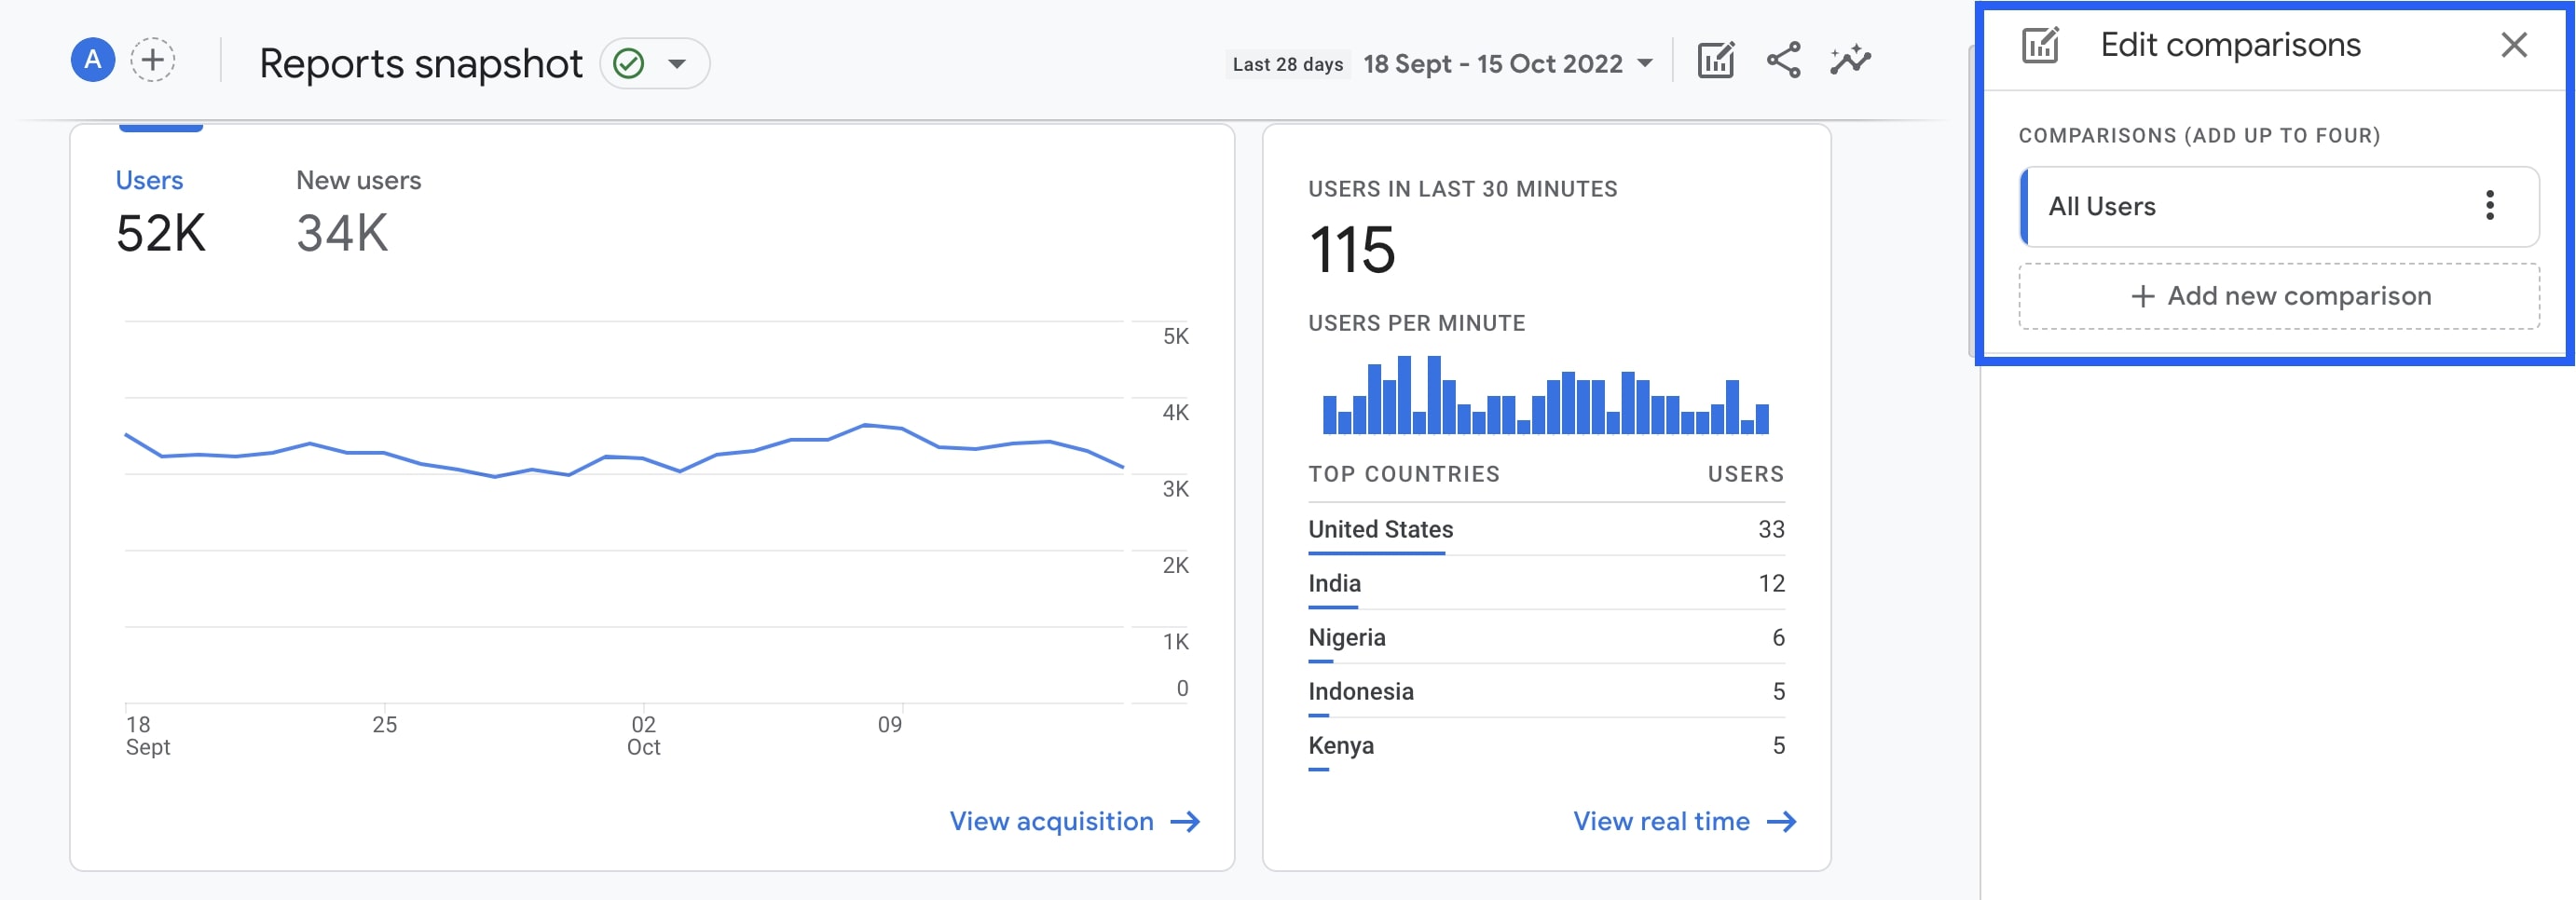
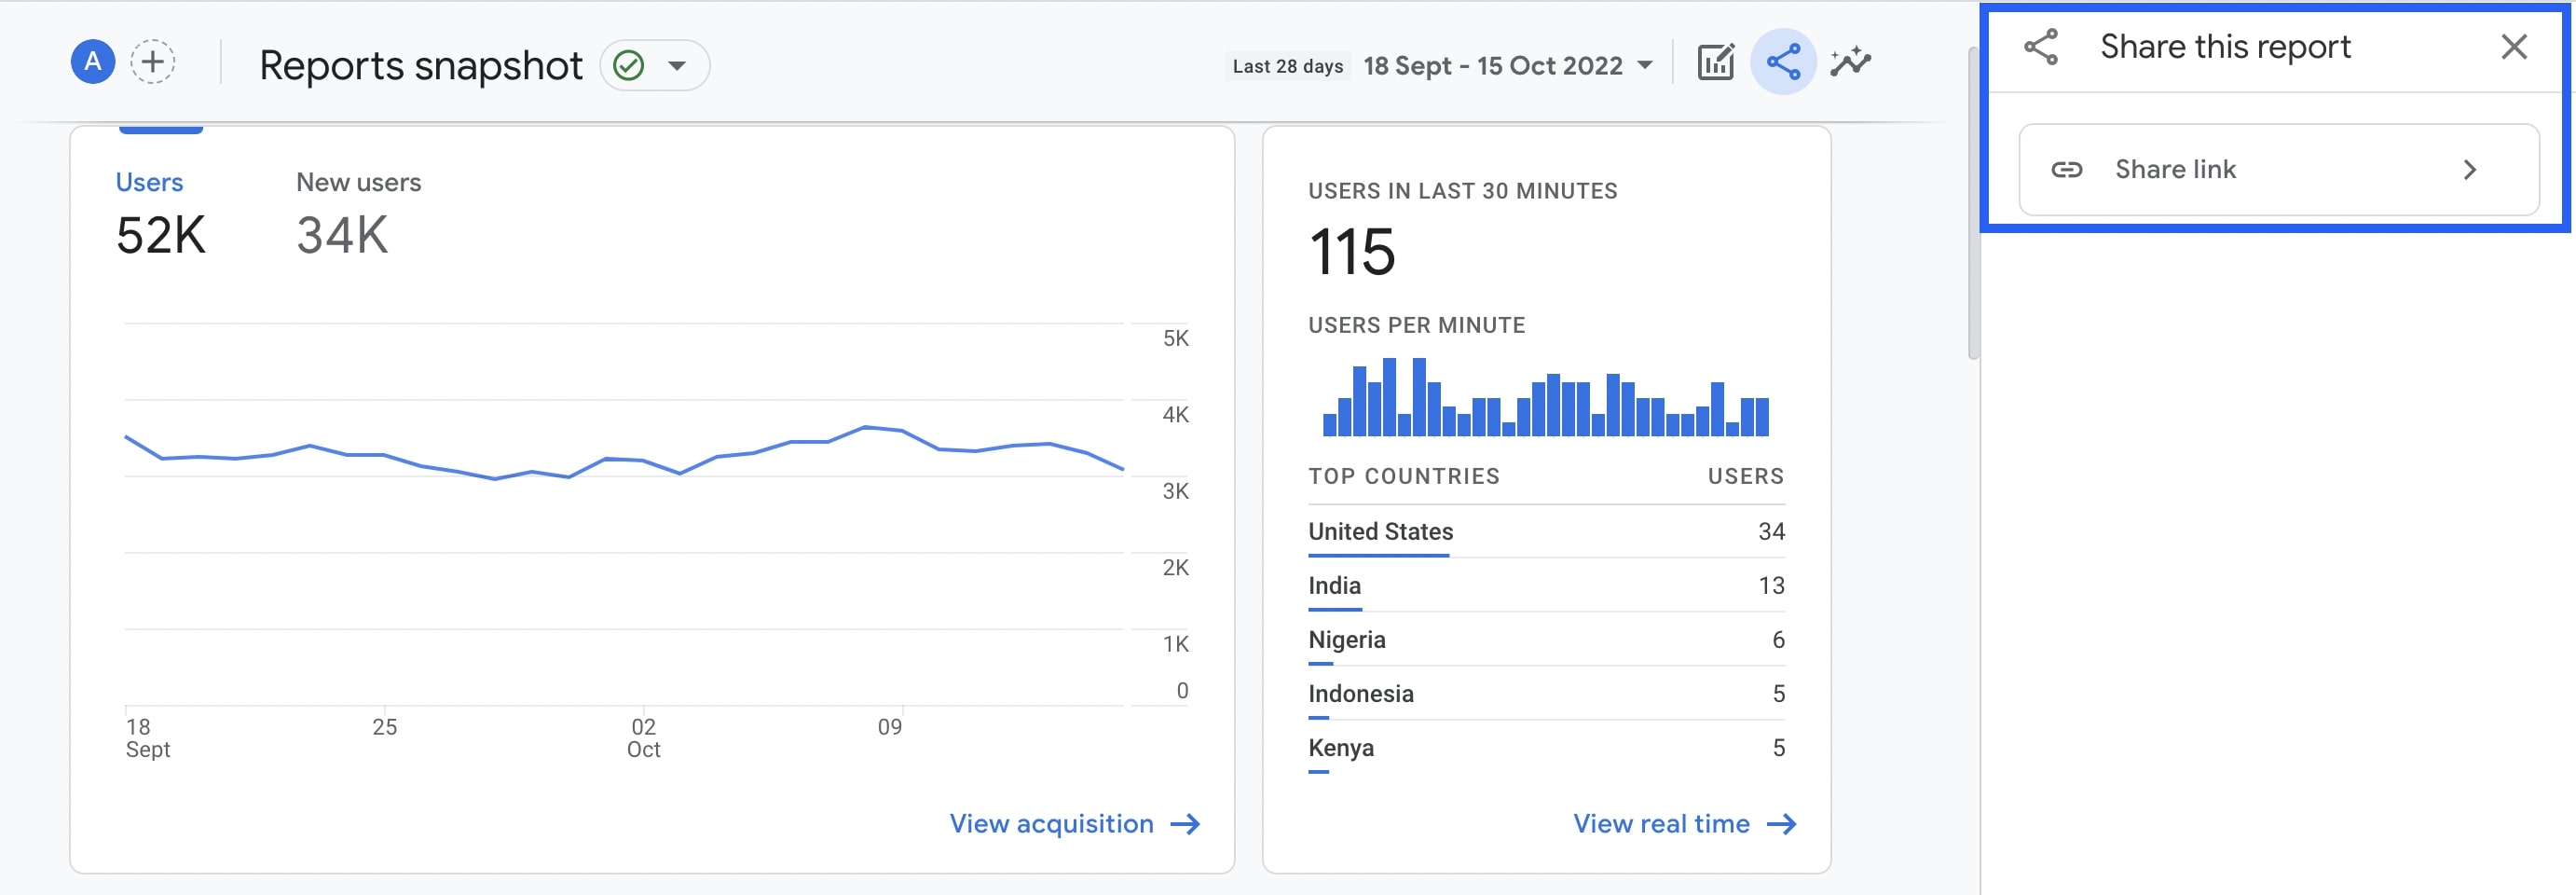
You can choose the segment you want to see from these areas, share the report or get insights.
Realtime
Realtime is a concept that allows you to see app and website activity as it happens, meaning you can have an idea of how many people are on your website at that moment - and what they are up to.
In realtime, you are presented with a set of interactive visuals including information on:
- The number of visitors to your website uring the last 30 minutes
- Where they are coming from (source, medium, or campaign)
- Who your users and audience are
- The type of content your users engage with
- Which conversions your users complete, what type of events they trigger
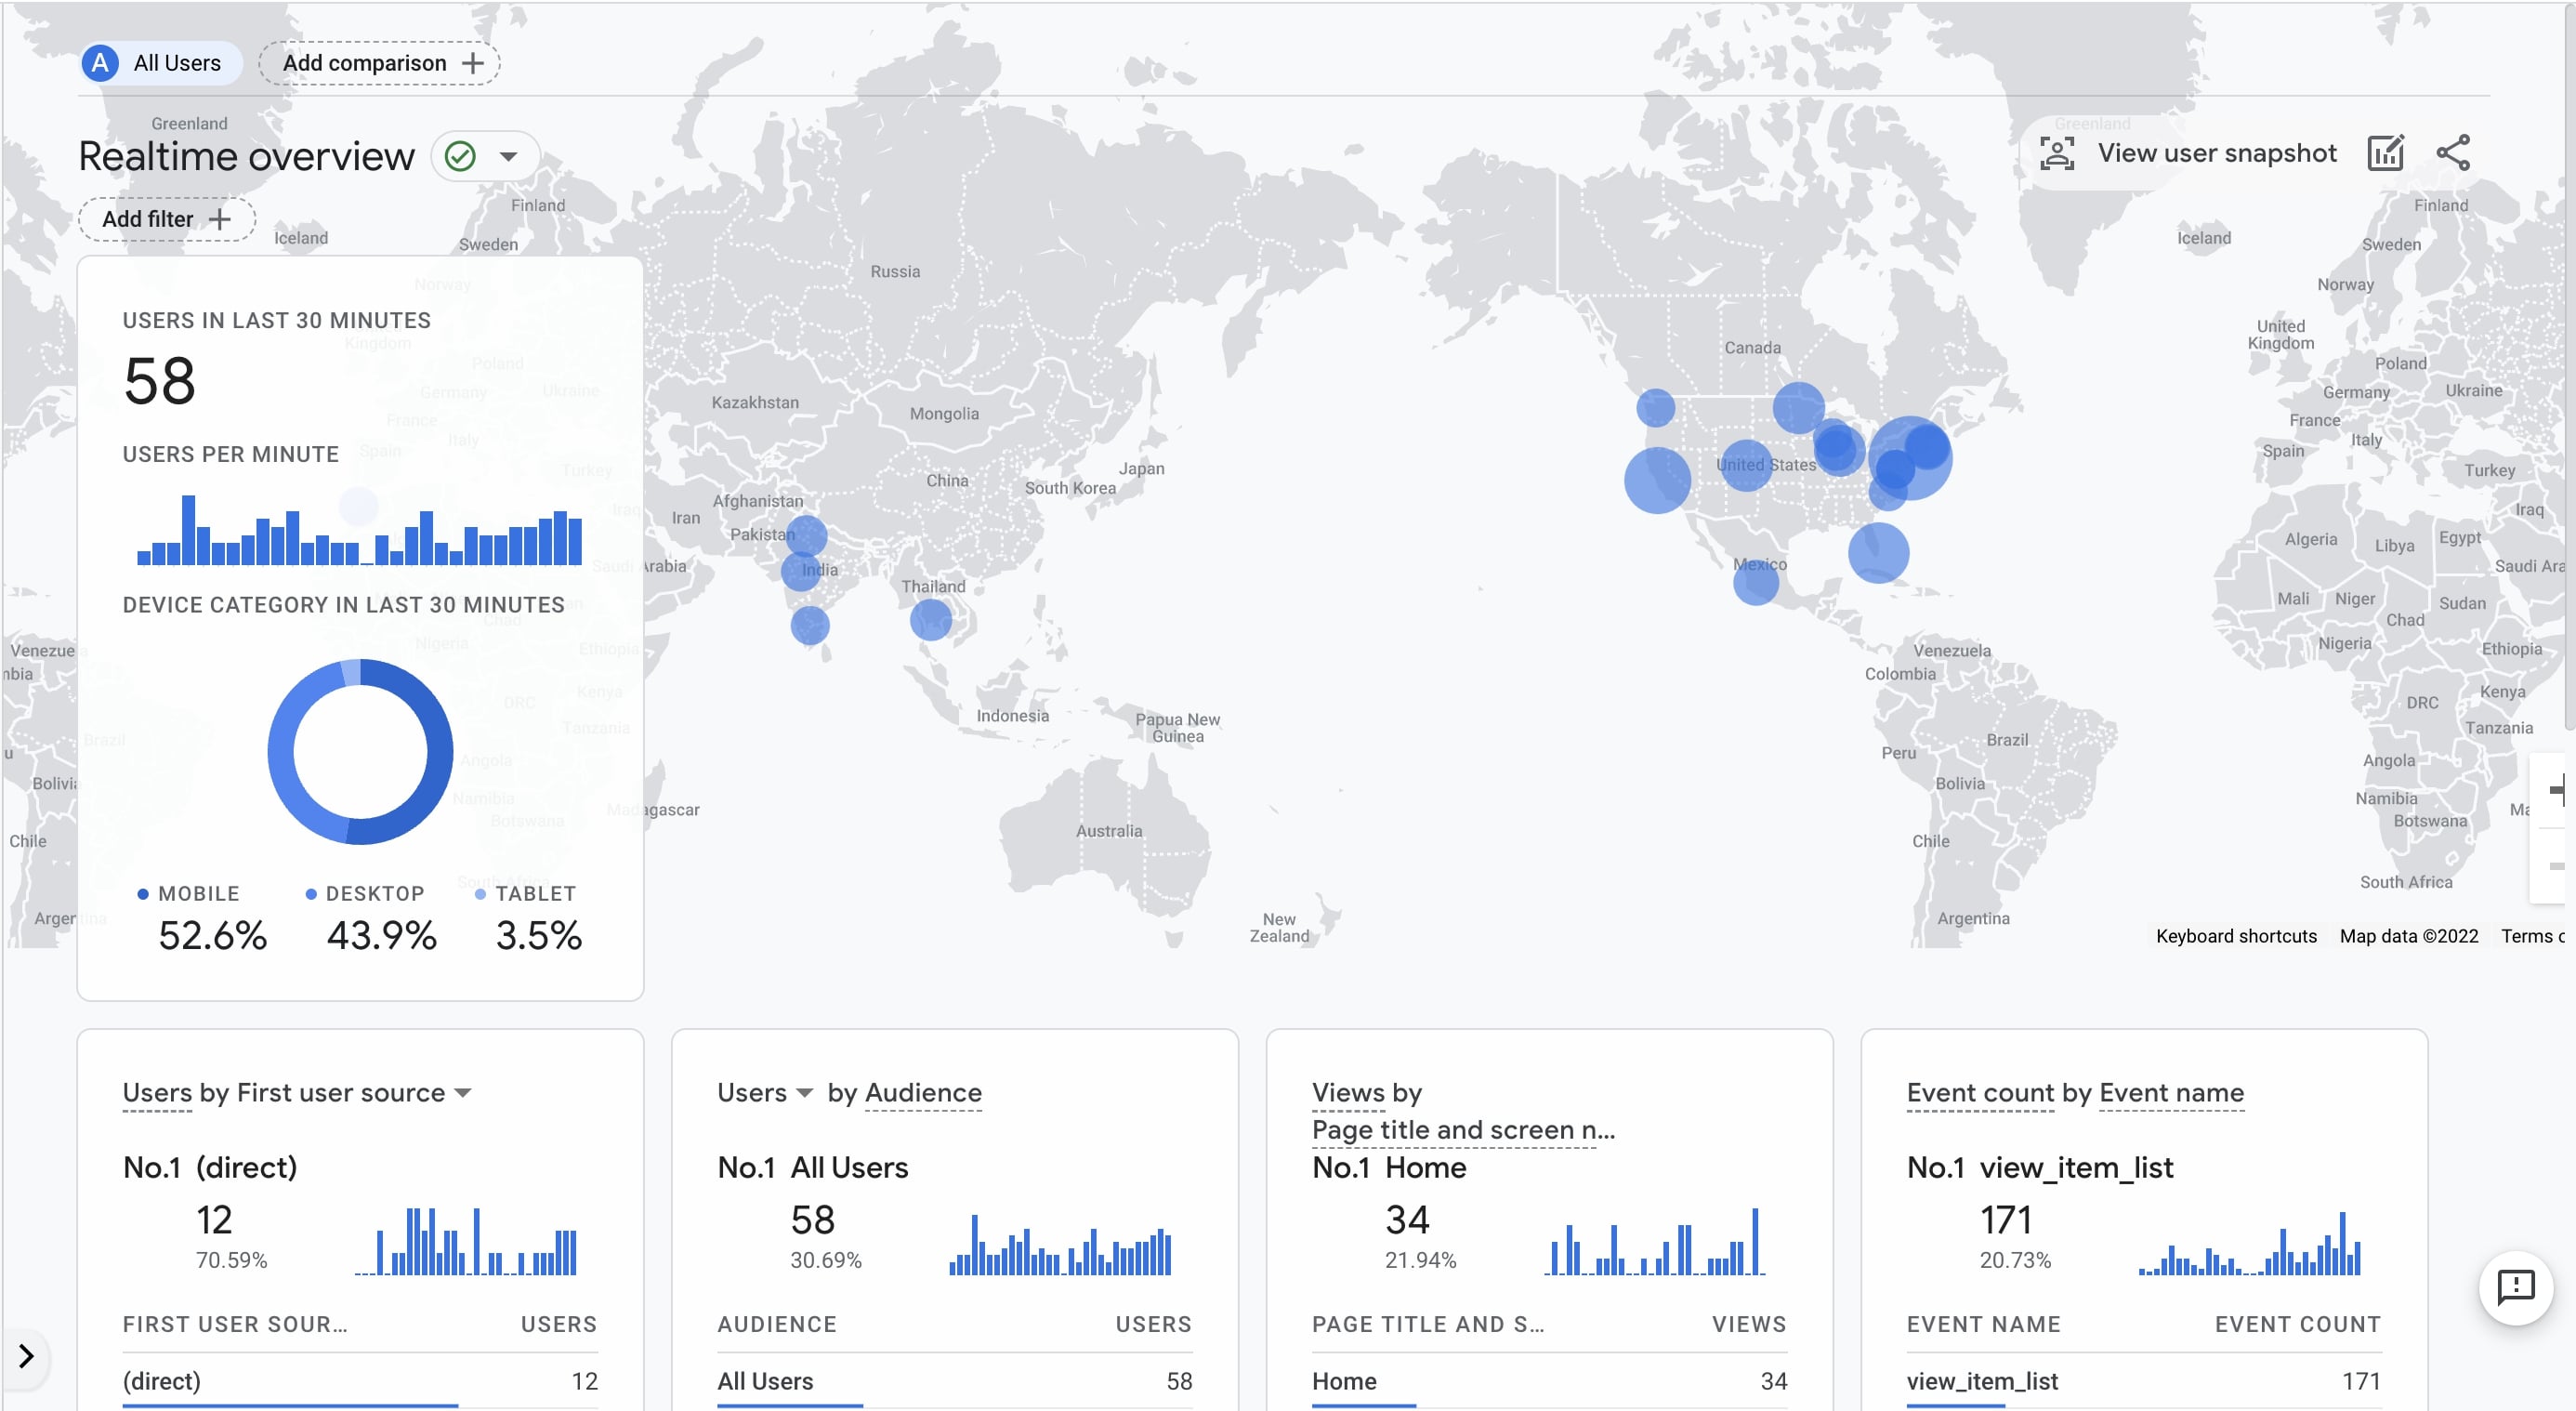
All this information is well-packed & designed in cards delivering instant snapshots of data flowing to your properties.
You can use real time to measure the performance of your marketing campaigns & efforts as it helps you see what drives more traffic to your website very quickly. You can make decisions about your strategies based on engagement and conversions.
Also, realtime can allow you to troubleshoot your campaign tagging. If you don’t see traffic coming in via realtime reporting for your newly launched campaigns right away, it can be easier for you to detect the source of the problem in order to fix it.
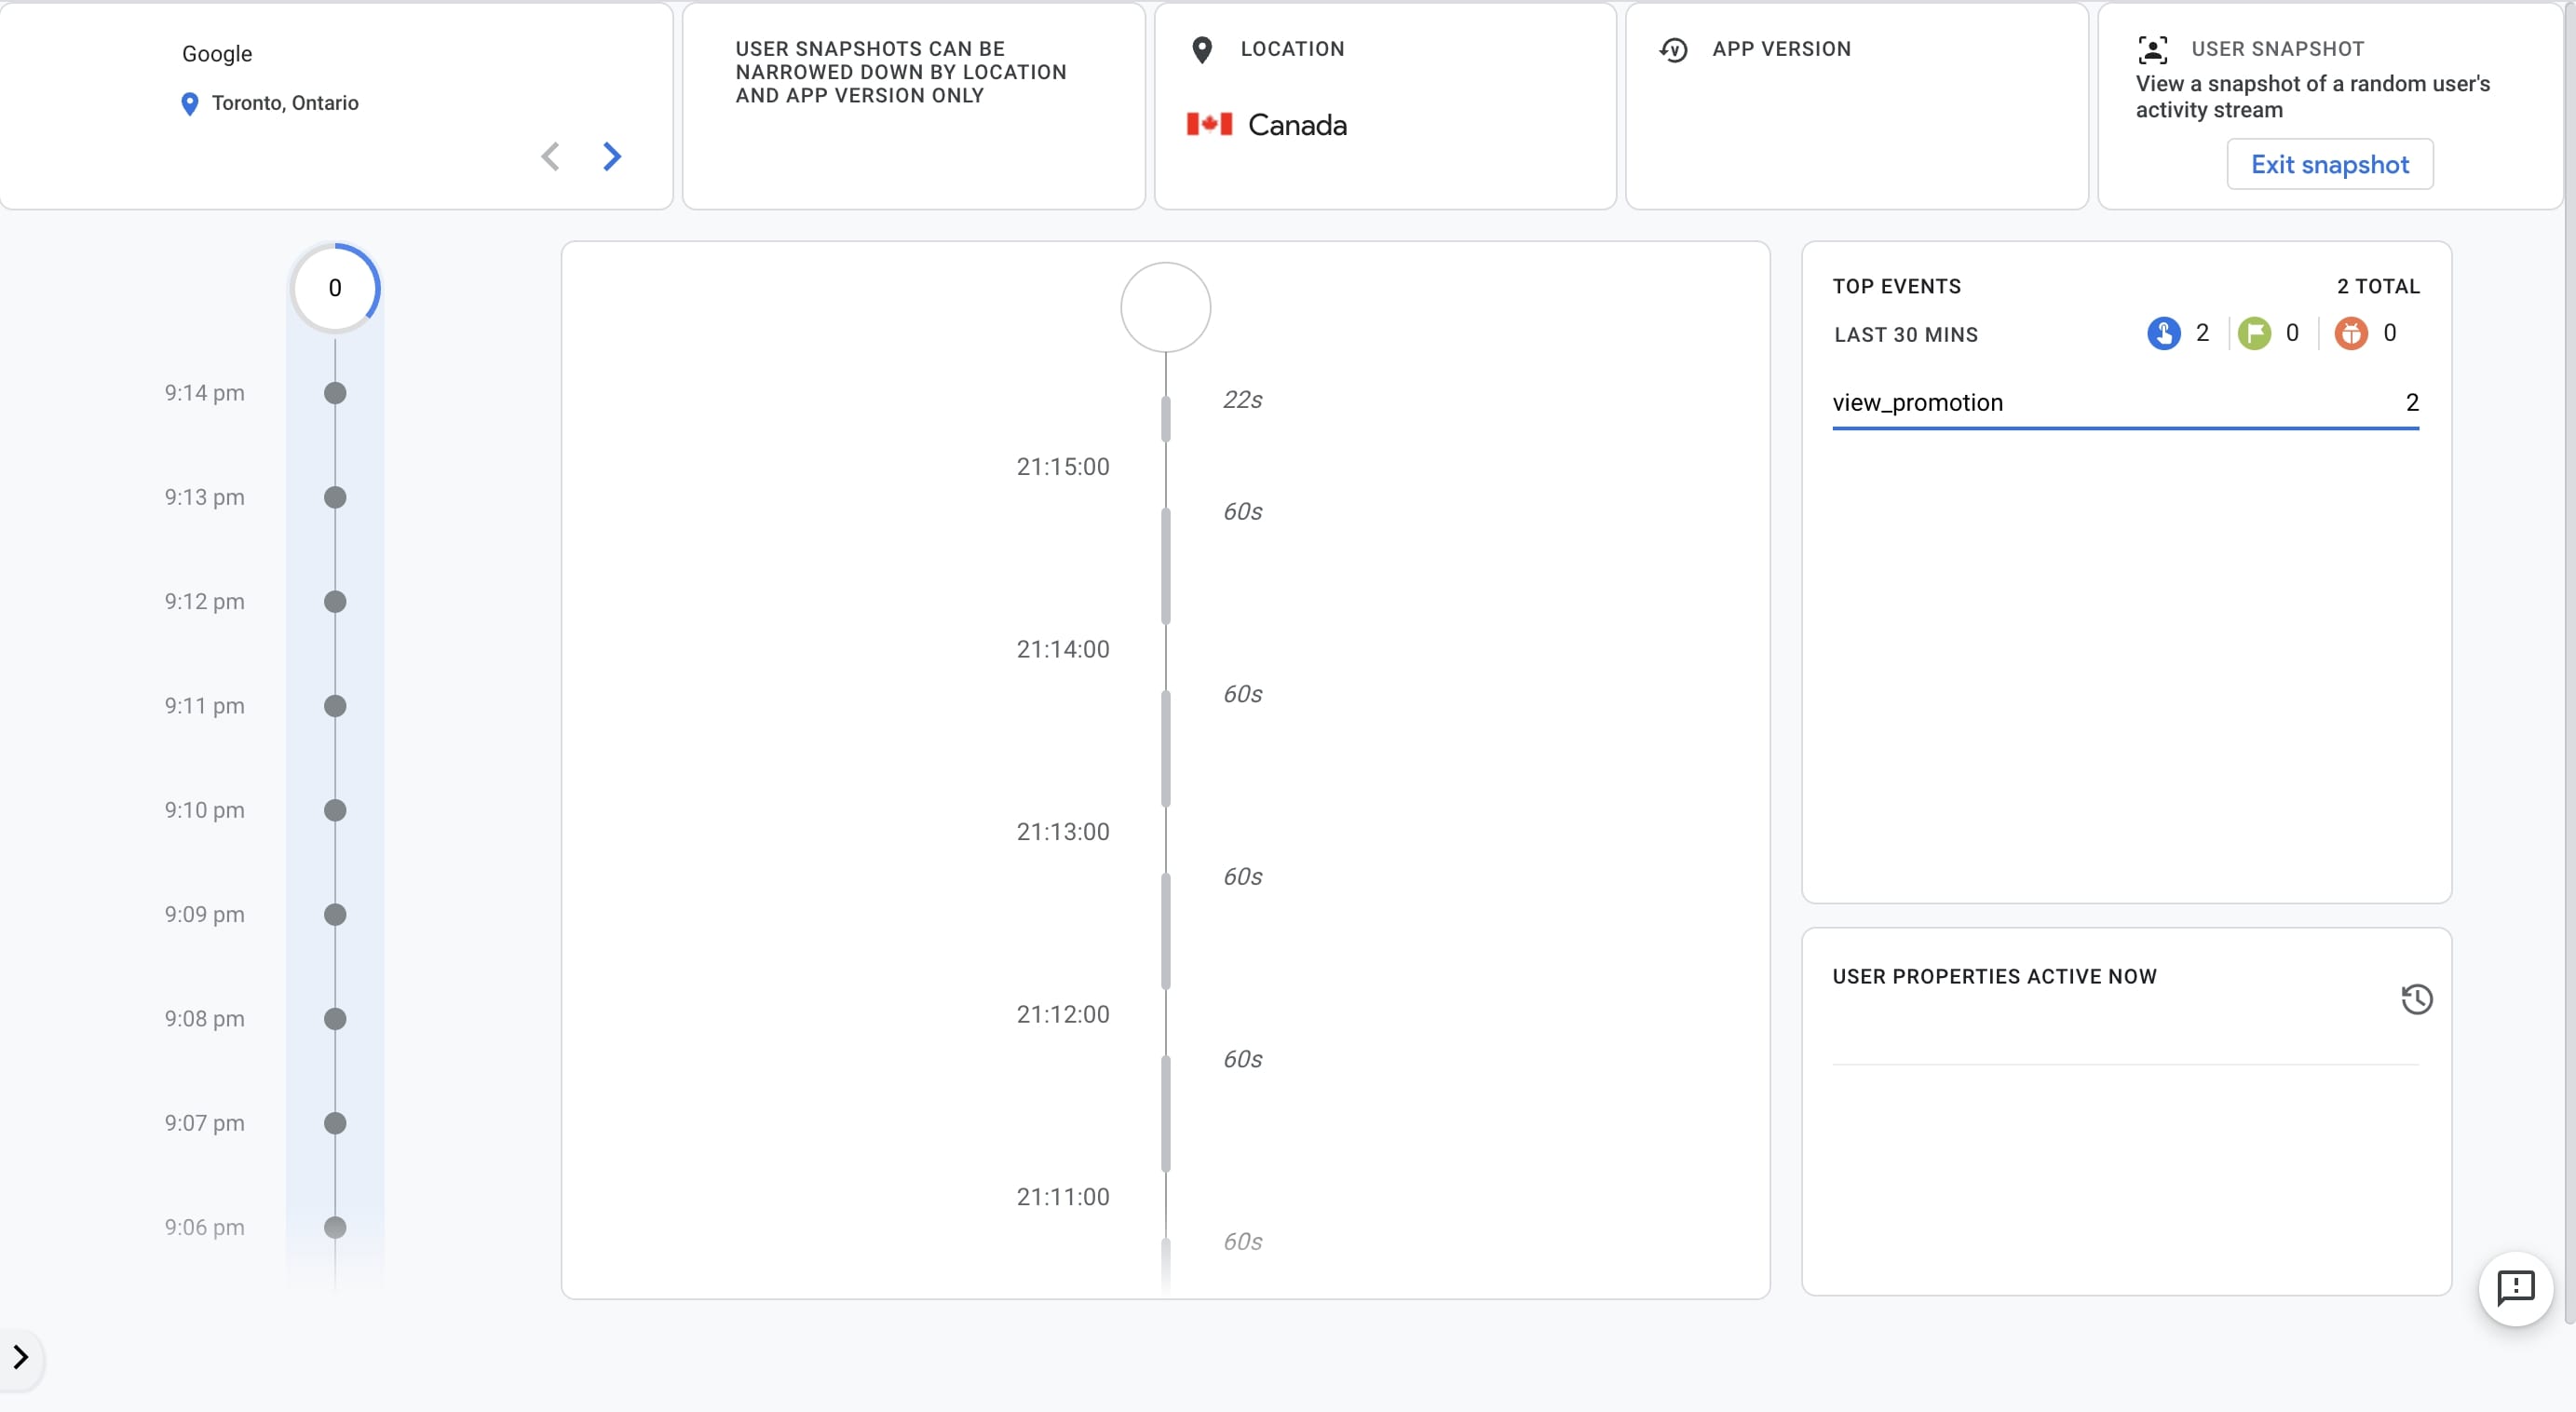
By using the View user snapshot field, you can see the events triggered by the user and the actions taken instantly.
Life Cycle
The life cycle collection provides you with a closer look at user activity through different stages under Acquisition, Engagement, Monetization, and Retention. Reports generated here create an overview of visitors’ journeys on your website, offering answers to questions such as:
How does a user enter your conversion funnel?
What is the user behavior when inside the funnel?
Here, you can also see user reports about demographic data, technology, events, and conversions.
Acquisition
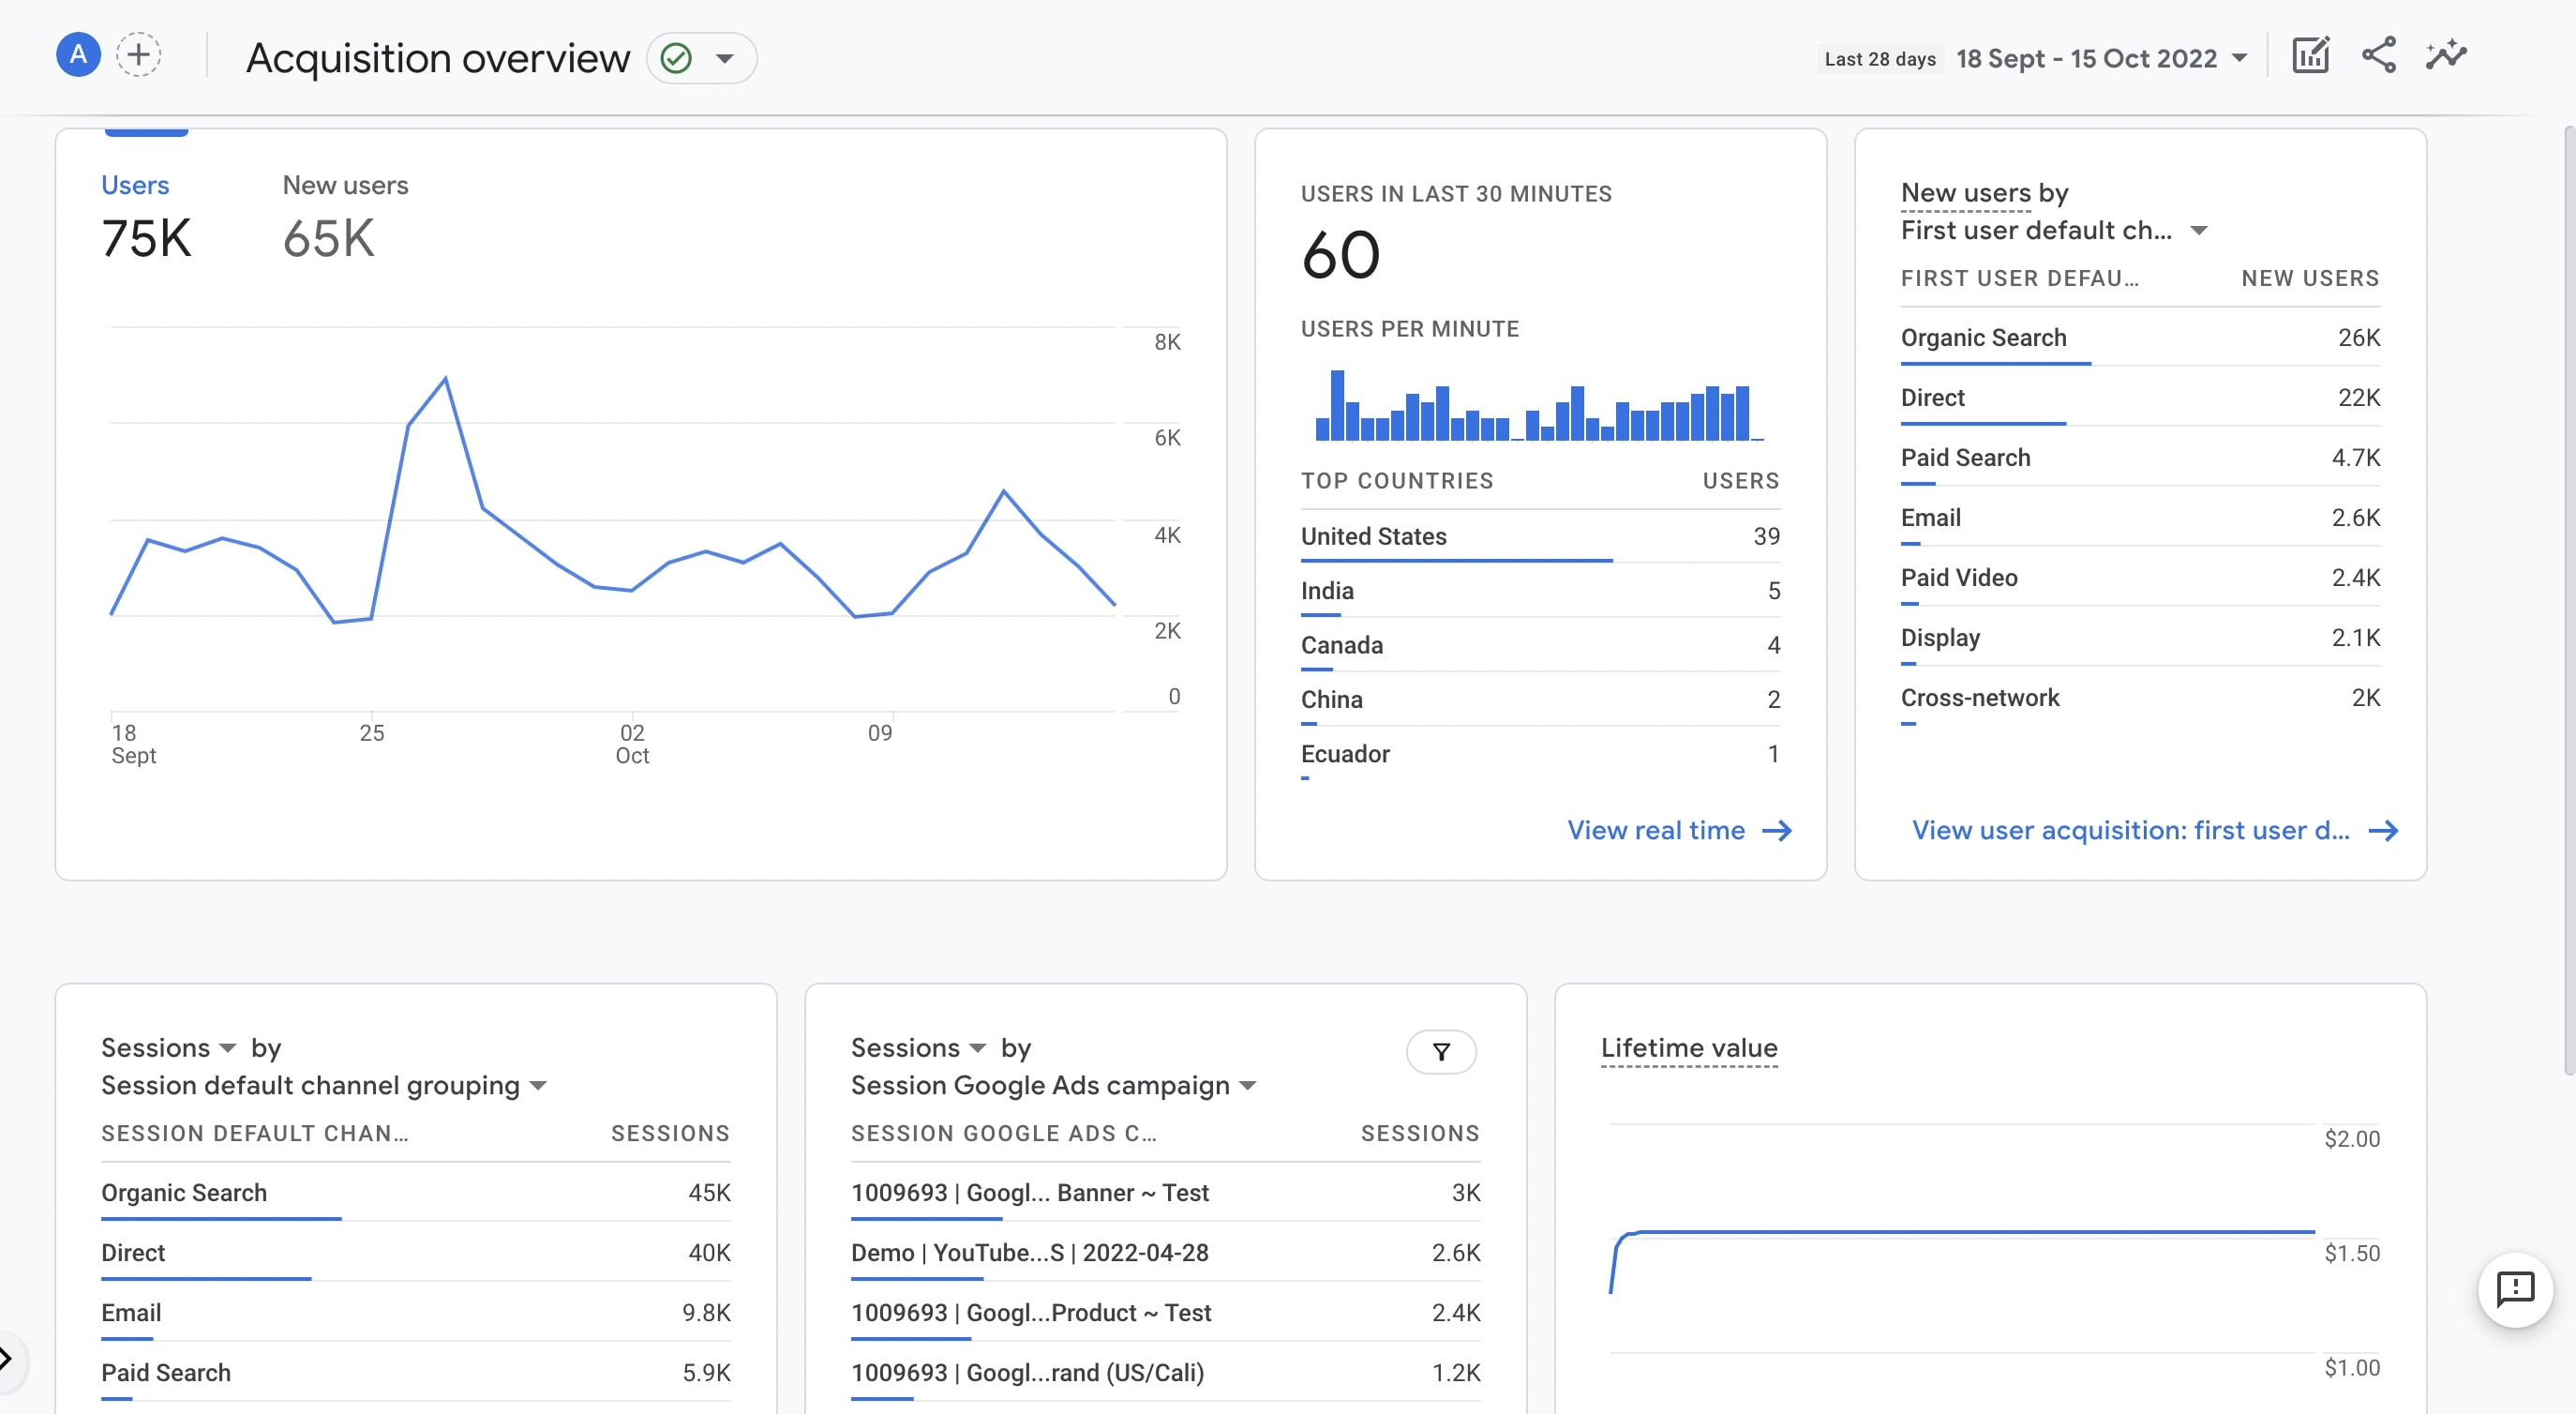
Reports and graphics under this section bring your traffic sources under the spotlight. Divided into three sub-sections such as Overview, User Acquisition, and Traffic Acquisition, this collection lets you get where your traffic originates, the methods users use to land on your website, and the marketing efforts you use to drive traffic.
Overview
It monitors your acquisition data to let you know where your traffic comes from. You can get platform-specific summary cards to see the performance of your marketing campaigns.
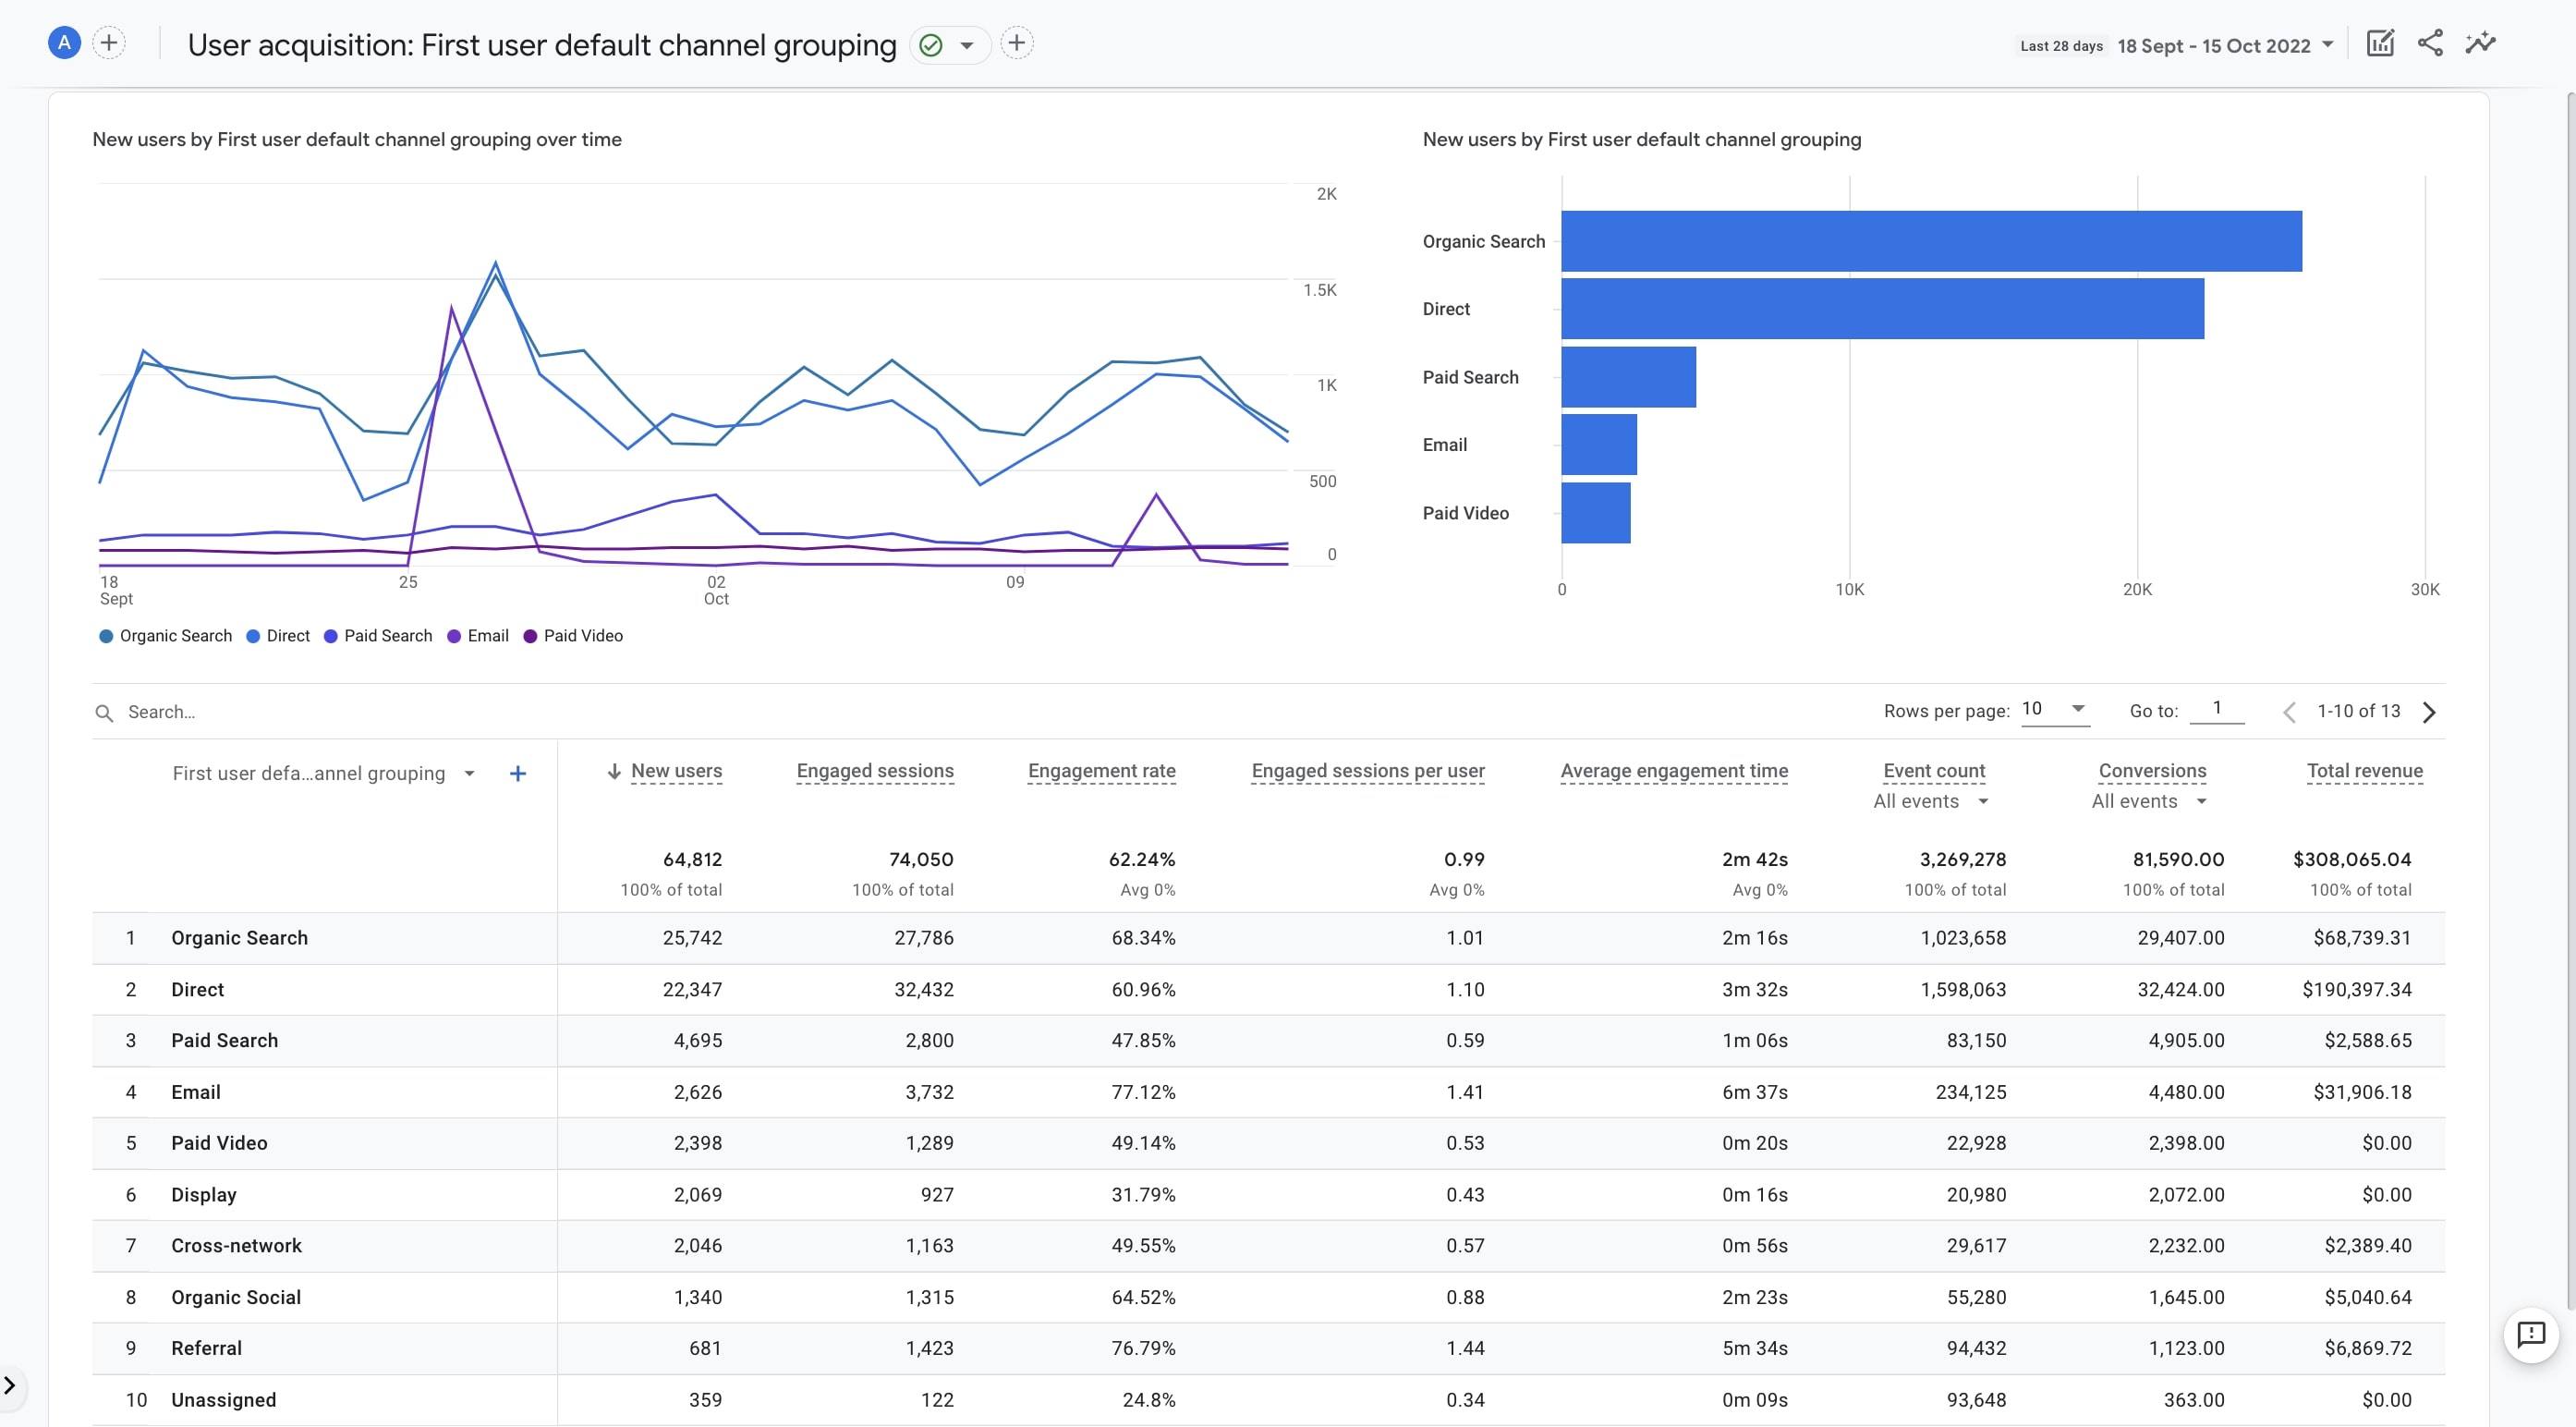
User Acquisition
You can analyze where your new users come from under this section. It works based on "first user".
Traffic Acquisition
Here, you are presented with information about the source of the new sessions. It works based on "session".
Engagement
Engagement reports serve well to help you see how users engage with your website. By checking out engagement which is based on the events and conversion events, you can monitor the pages and screens that have the most user engagement.
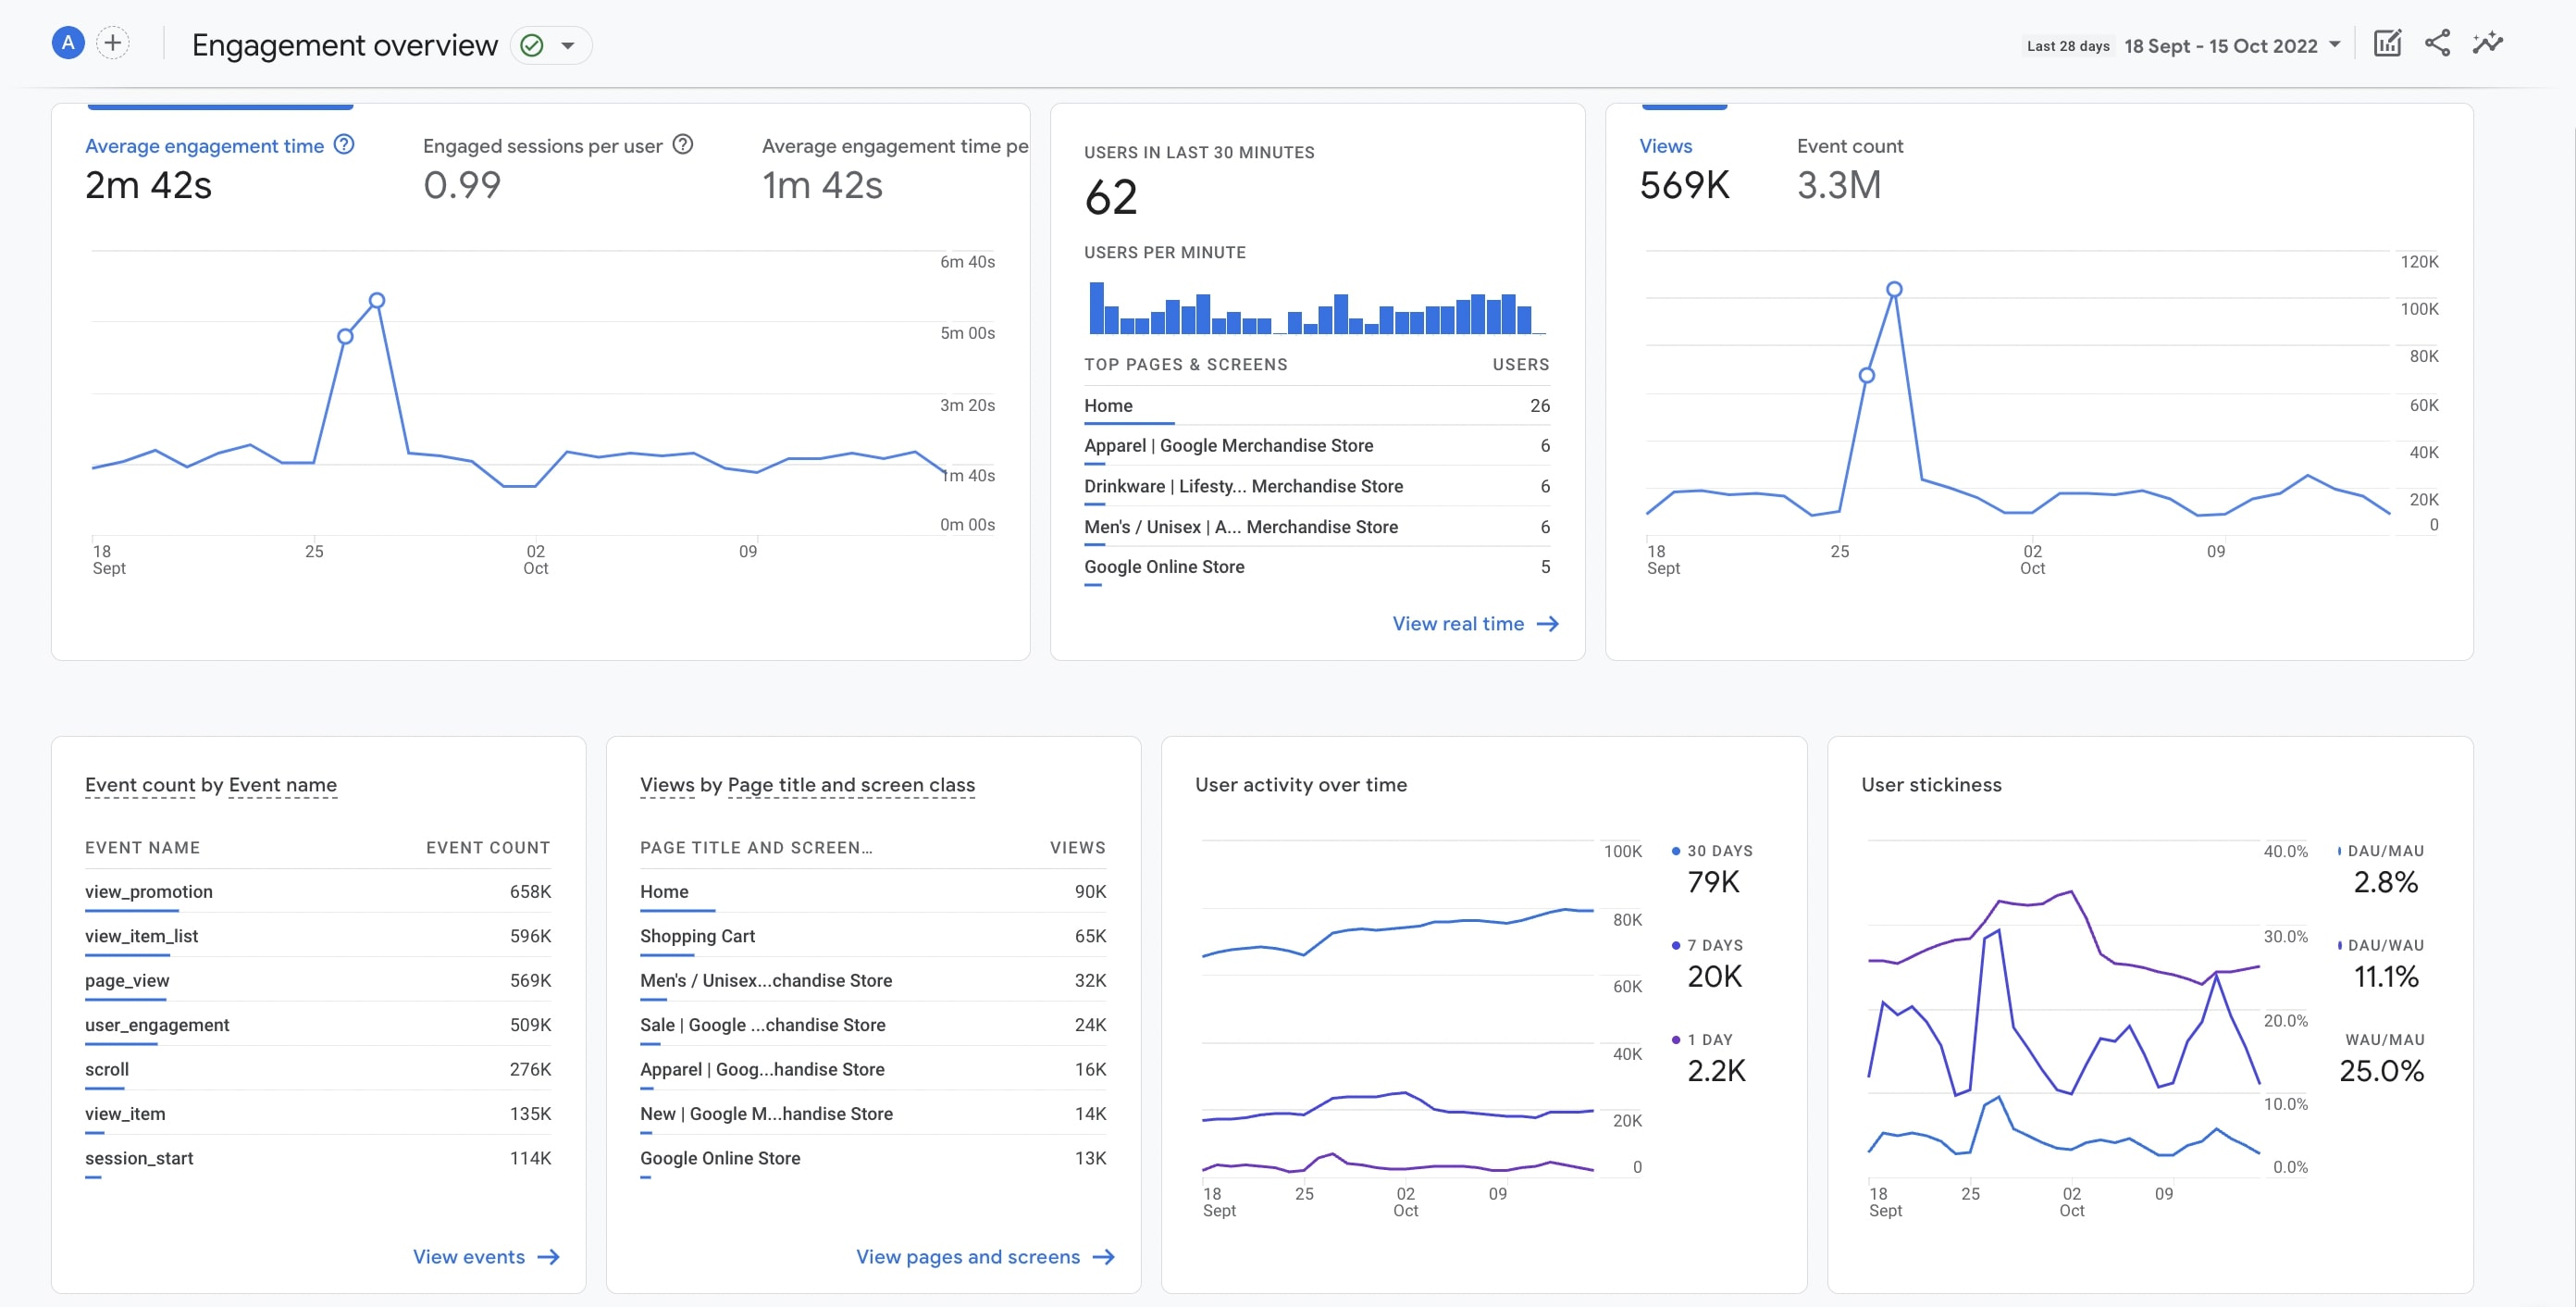
Overview
This sums up the engagement data within the other reports under the same category. Engagement Overview can provide you with an all-inclusive look at engagement on your websites.
Events
Here, you can find how many users trigger the events on your website or mobile app as well as how frequently they are triggered. The reports here include the automatically collected events and the enhanced measurement events - if you enable them when you first set up your GA4.
However, you can add your own custom events to get more details in your reports.
Conversions
The reports found under this category display only the events marked as conversions. If you mark an event as a conversion, you see the data and the related reports in the Conversions report once it is triggered by any user.
If you'd like to get more detailed information, you can check out conversions in Google Analytics 4.
You can see how you can set an event as a conversion in the Configure -> Conversion area.
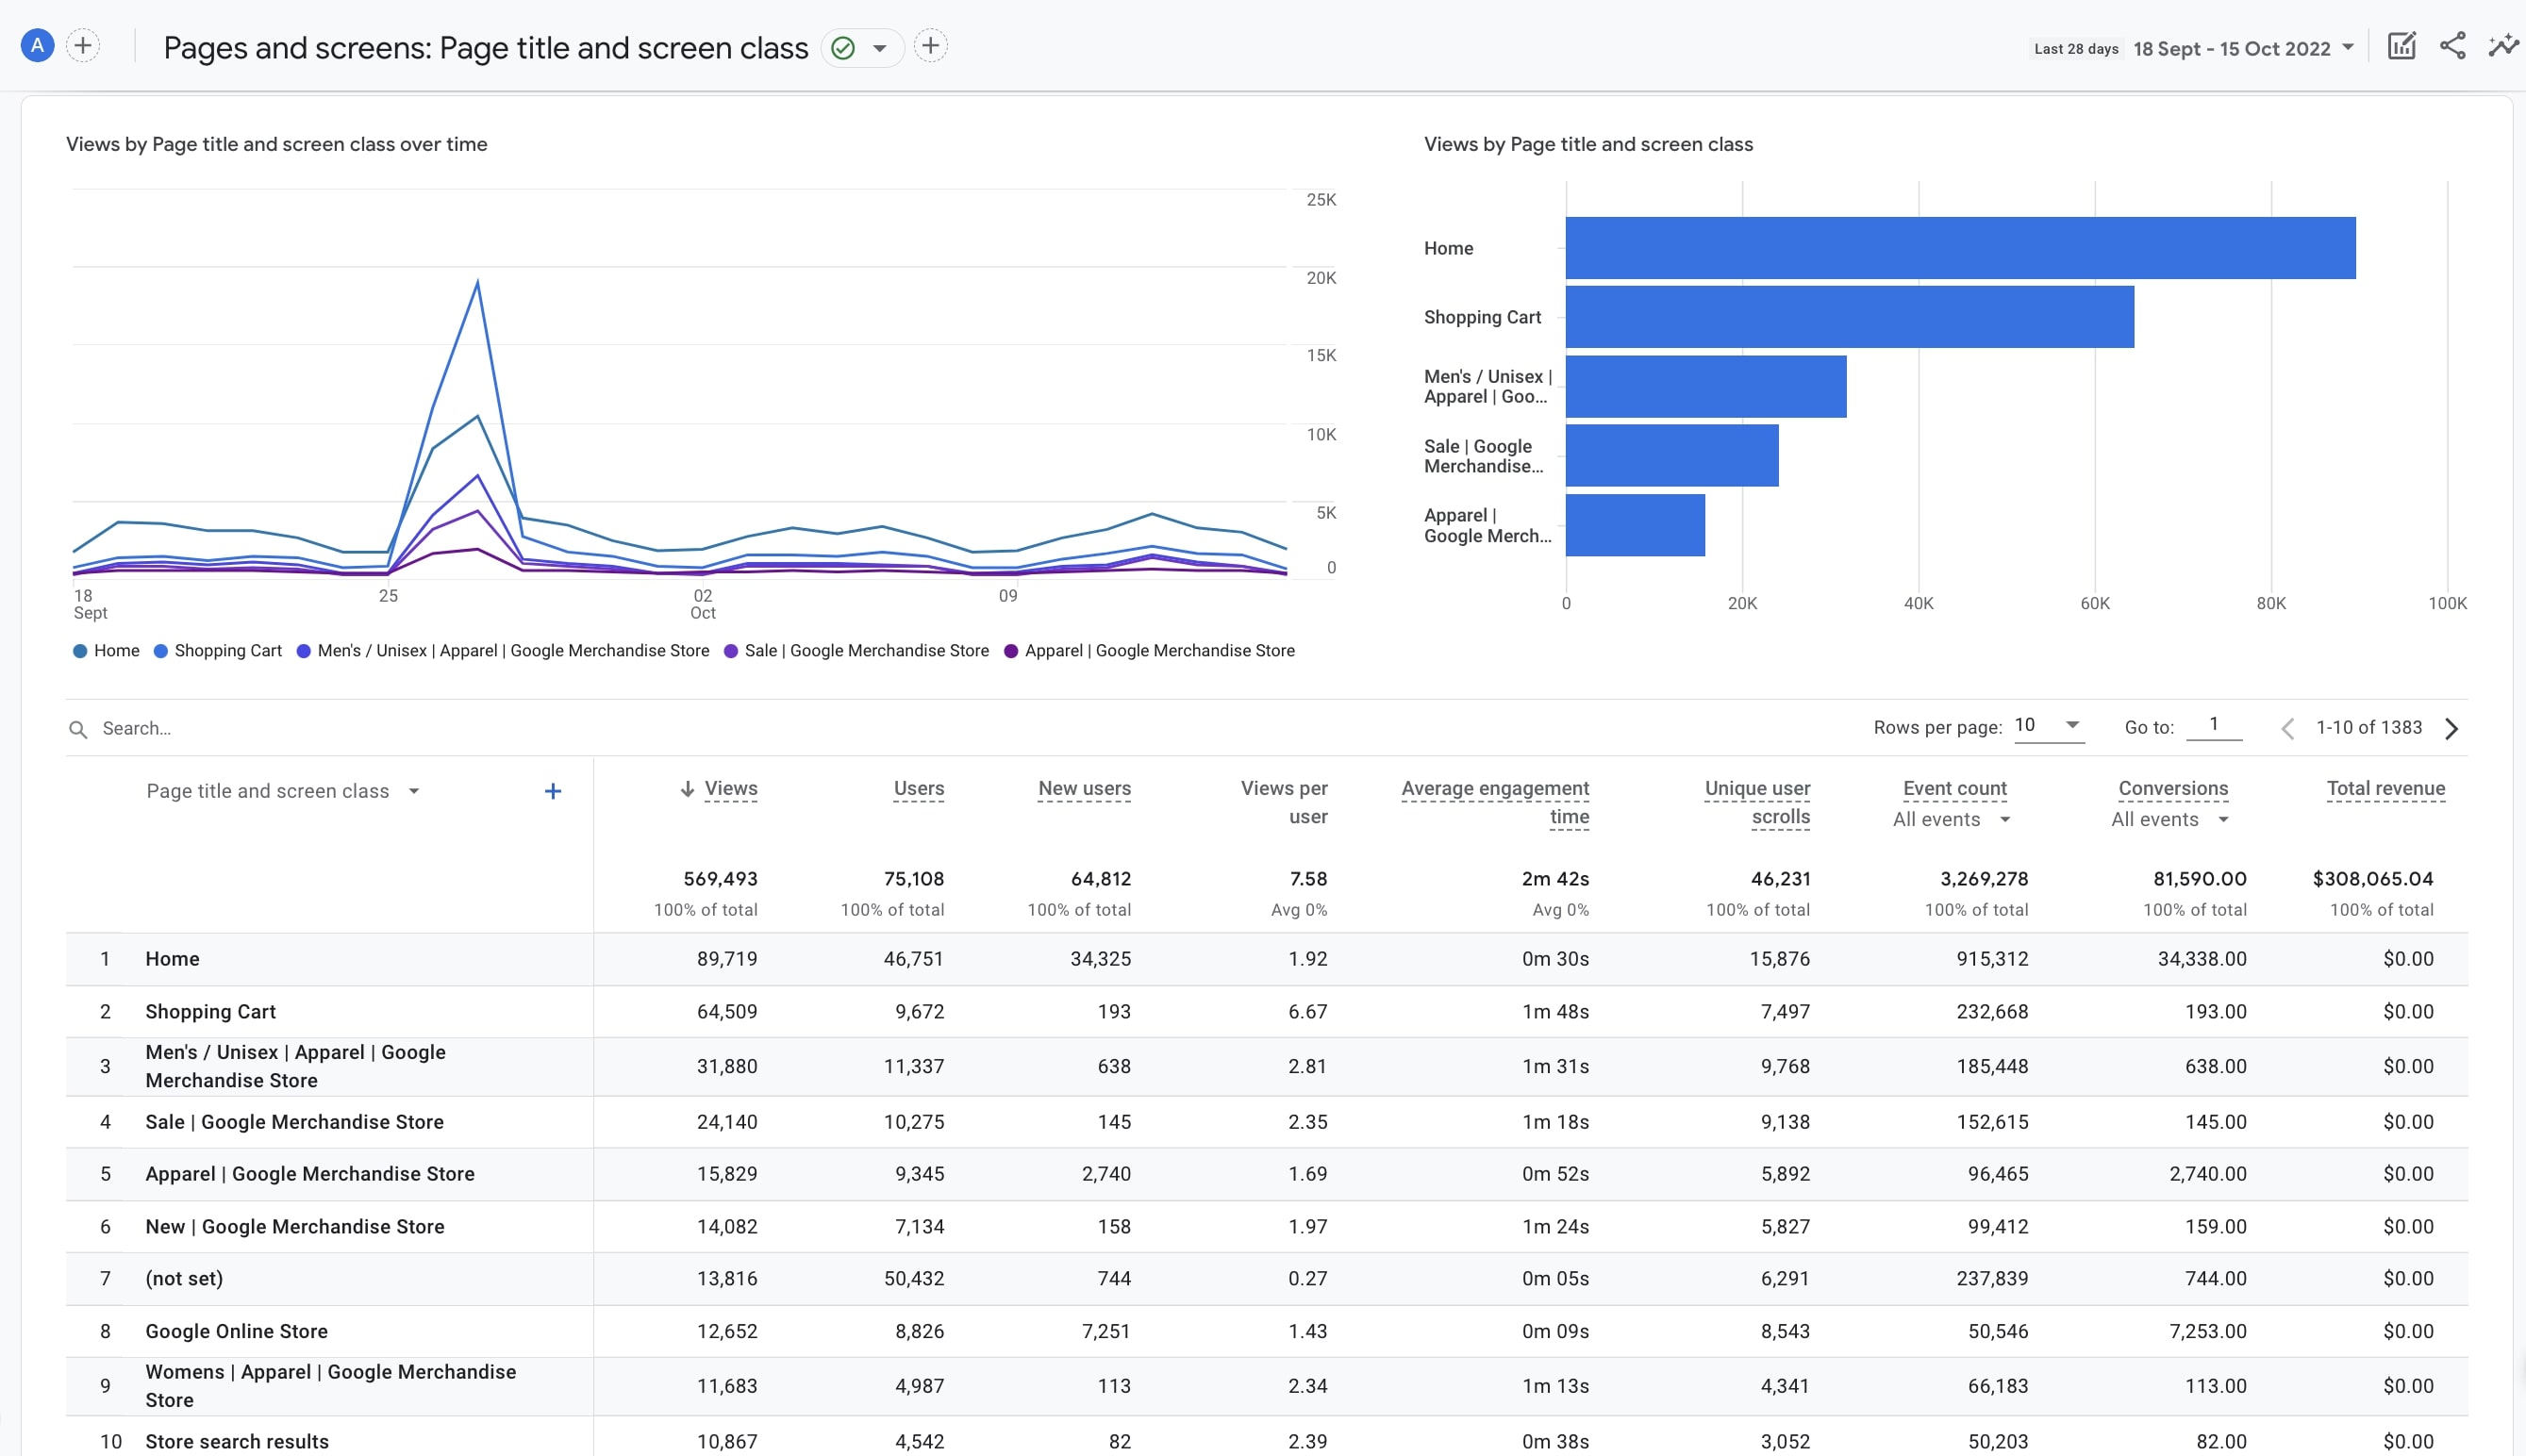
Pages and Screens
You can find the most visited pages and screens on your website here. This gives you an idea of how popular your pages and screens are among users.
Monetization
Reports under this section offer in-depth details about revenue-based events such as e-commerce and in-app purchases, ads, and subscriptions. You can get to see who views items you sell, the number of ad impressions in your apps, and generally the sources that provide revenue for you.
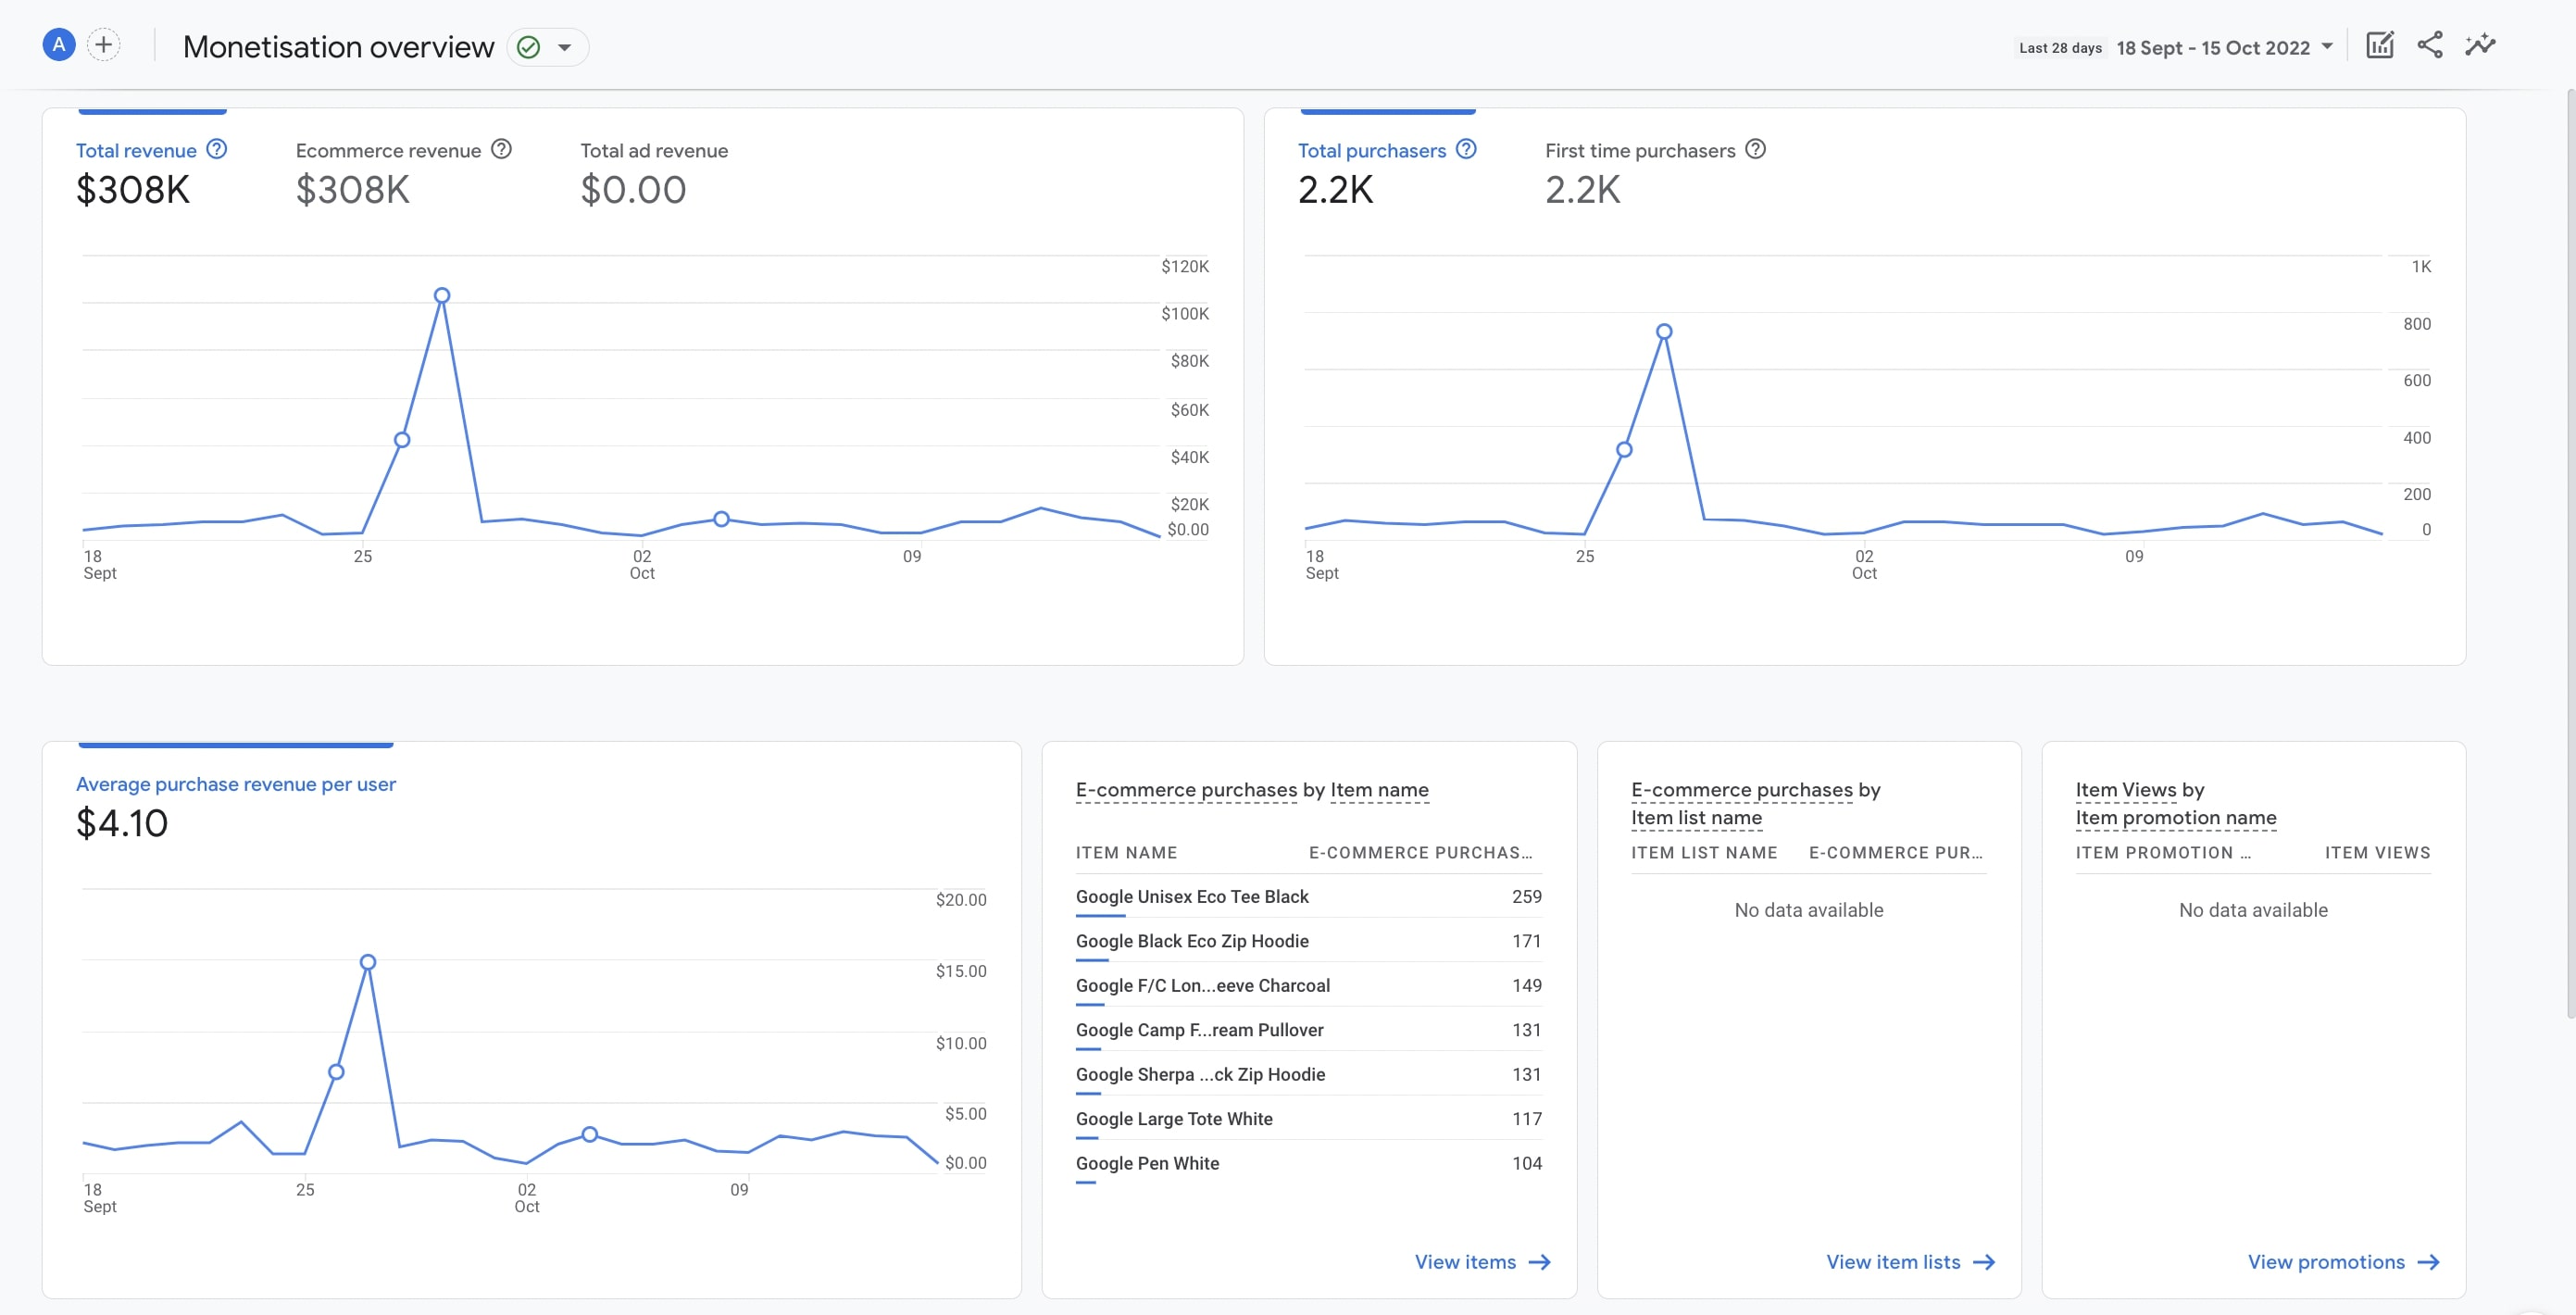
Overview
You can see the summary of the data across the other reports under Monetization, here. This helps you have a general view of how well your website or app is performing in terms of generating revenue.
E-commerce Purchases
These reports help you analyze your income from the items you sell, and the user interactions with those items. You need to add the required parameters for e-commerce events to view the related the in the purchases report.
If you want to analyze with different parameters, you can make related changes.
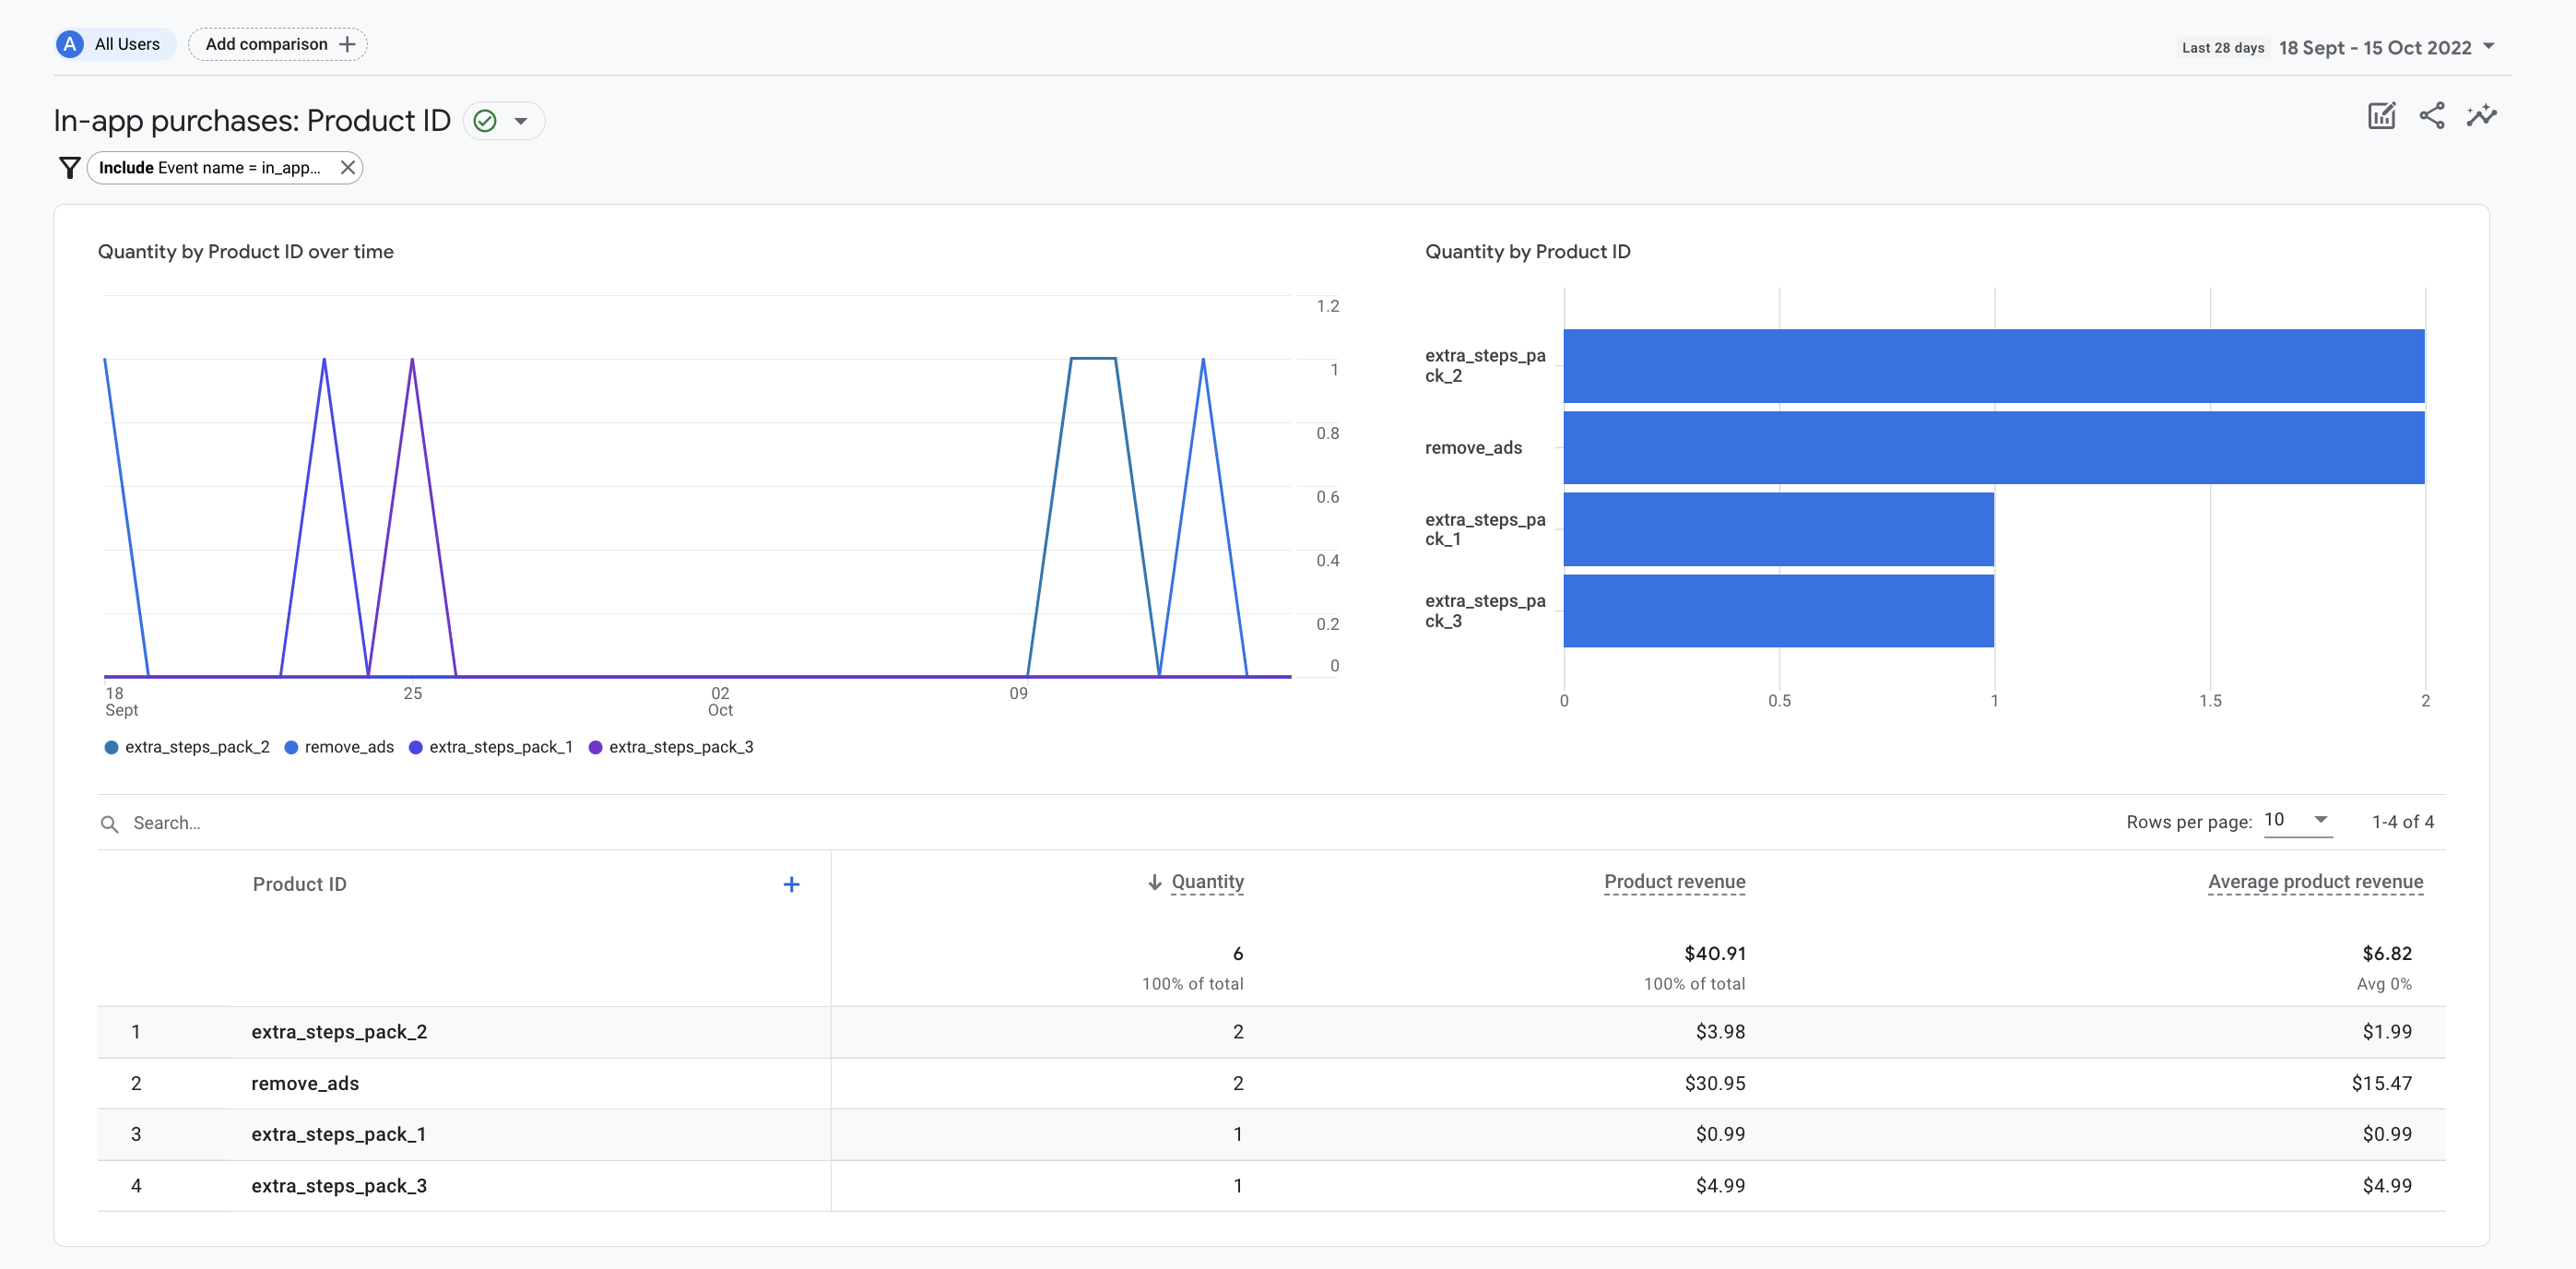
In-app Purchases
The reports you can see here let you check out the revenue generated from in-app purchases grouped by product ID. You need to make sure that in_app_purchase and subscription events are sent to Analytics so that it can create the reports you needed.
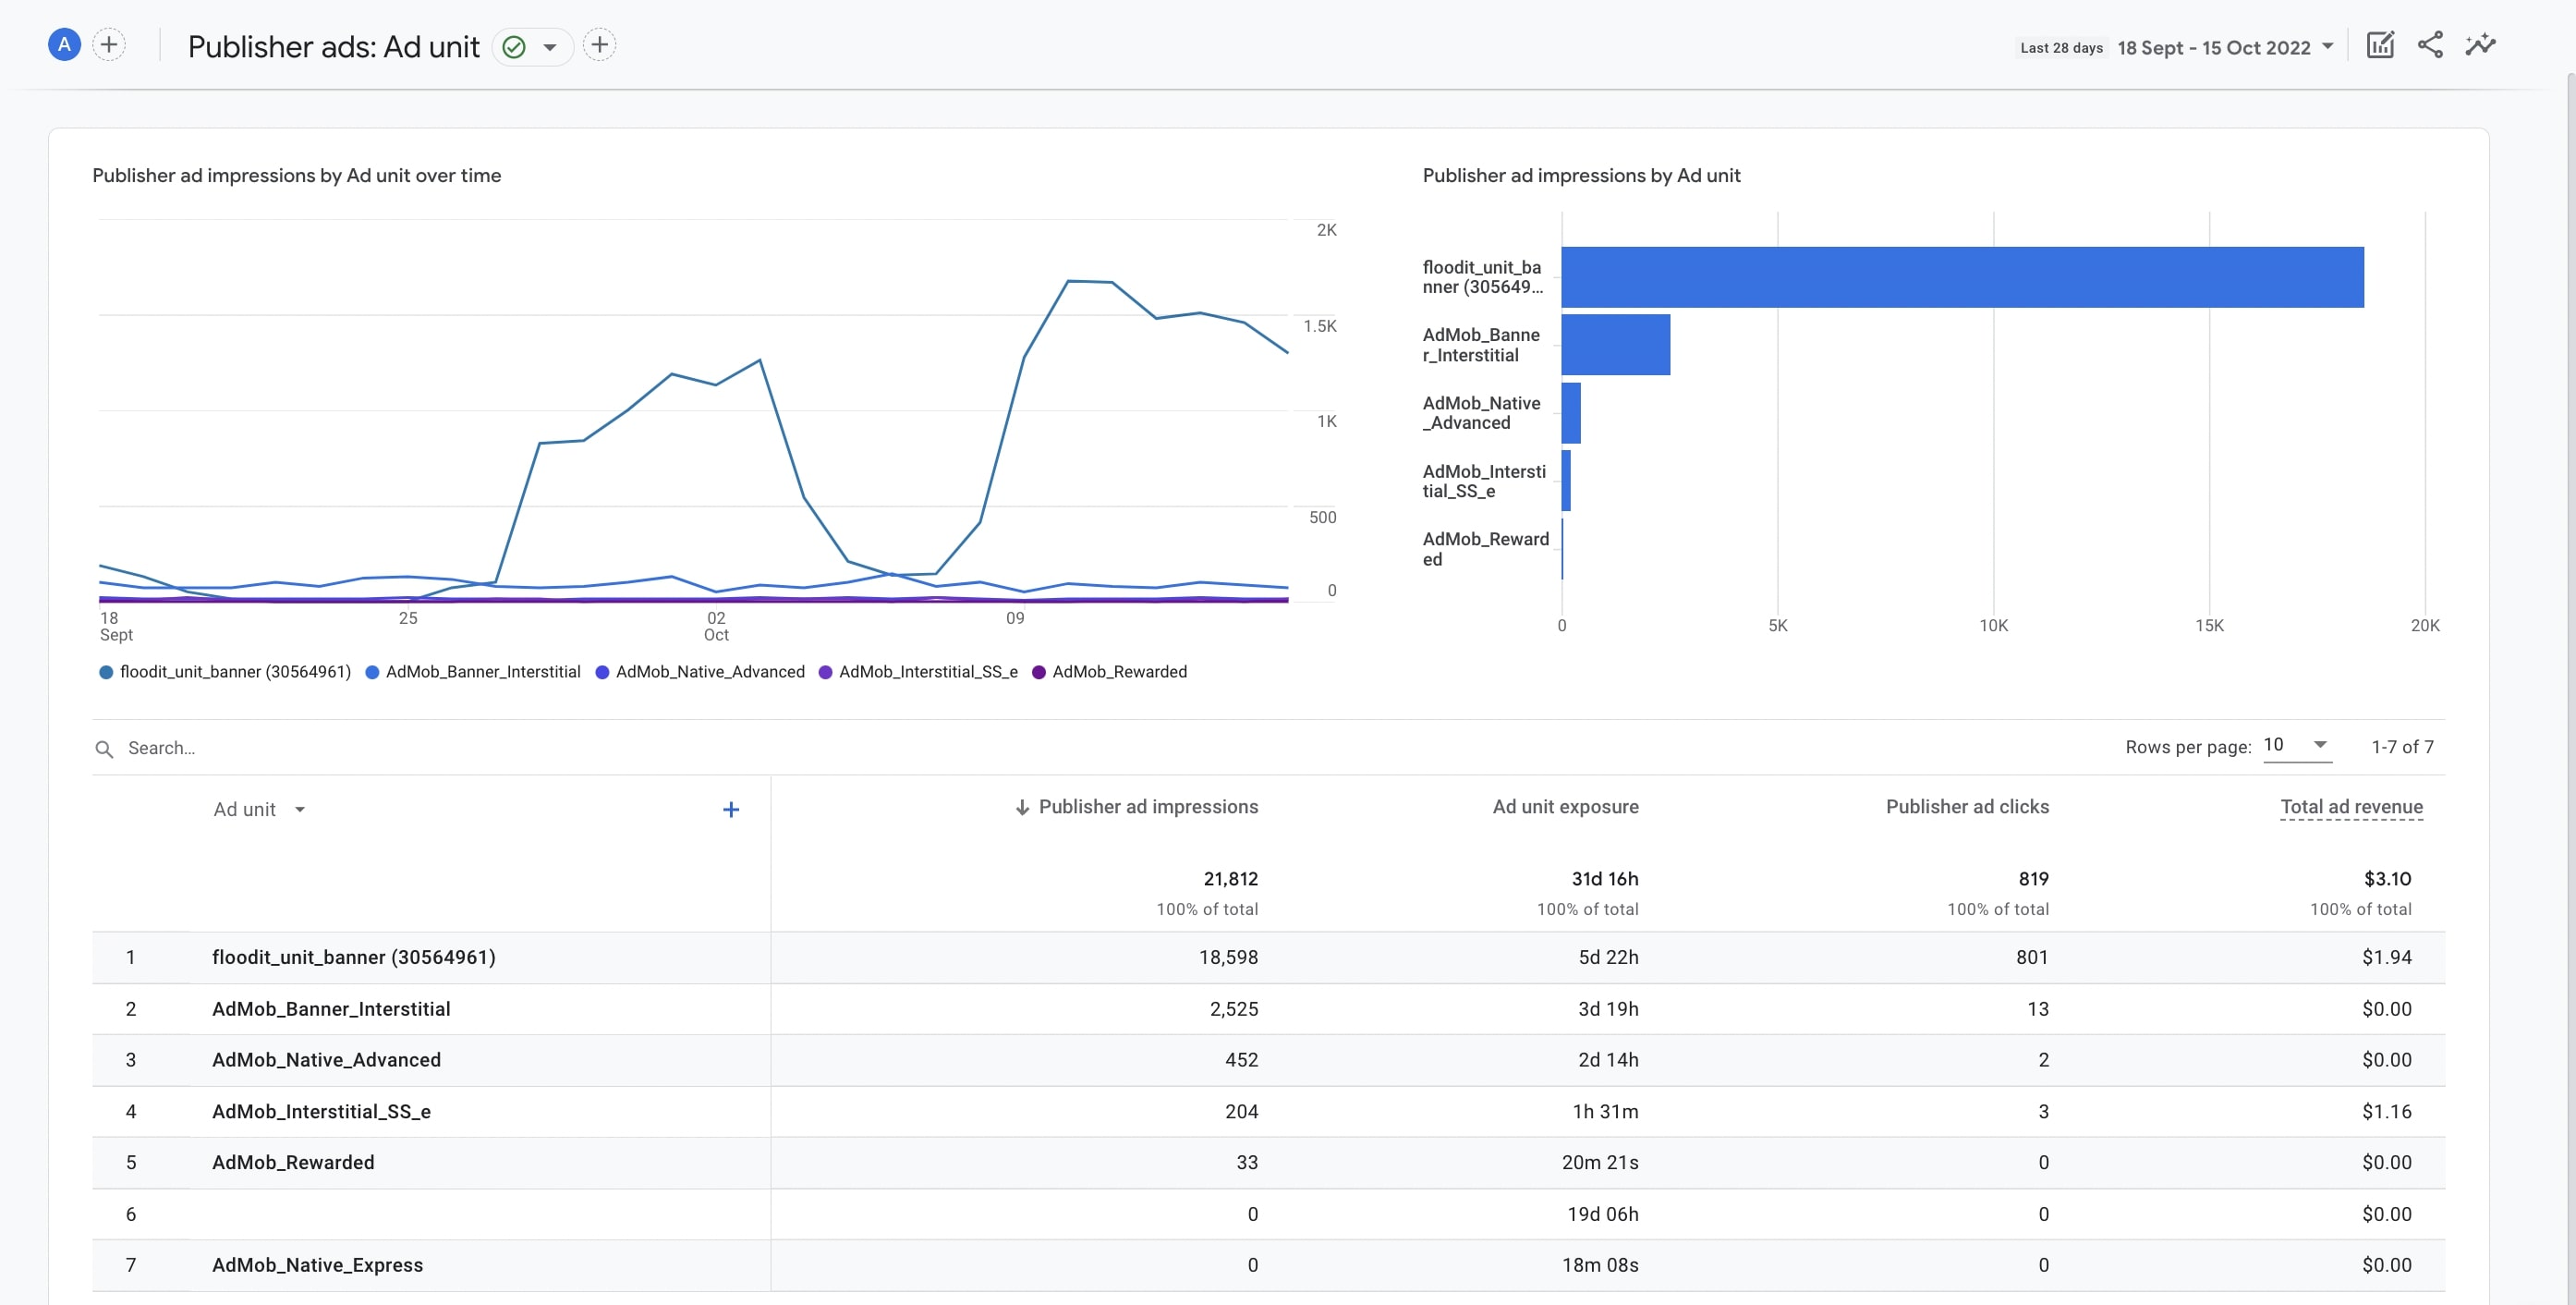
Publisher Ads
Here, you can have a look at the revenue you get from the ads in your mobile app. It would be wise to note that these reports do not currently show the revenue of ads on your website. You should set up ad-revenue measurement to get the ad revenue reported in this section.
Retention
You can learn about how frequently and how long people interact with your website or mobile app after their initial visit by using the Retention report. These reports let you see the percentage of users that re-visit your website each day in the first 42 days after the first visit.
User
The user collection consists of two sections: the Demographics, and the Tech. These reports help you have a better understanding of your users by providing information about who they are and what type of device they use.
Demographics
Reports found under this section offer insights into your users, presenting detailed information with interactive charts, diagrams, and tables. You need to enable Google Signals before you can see the data here.
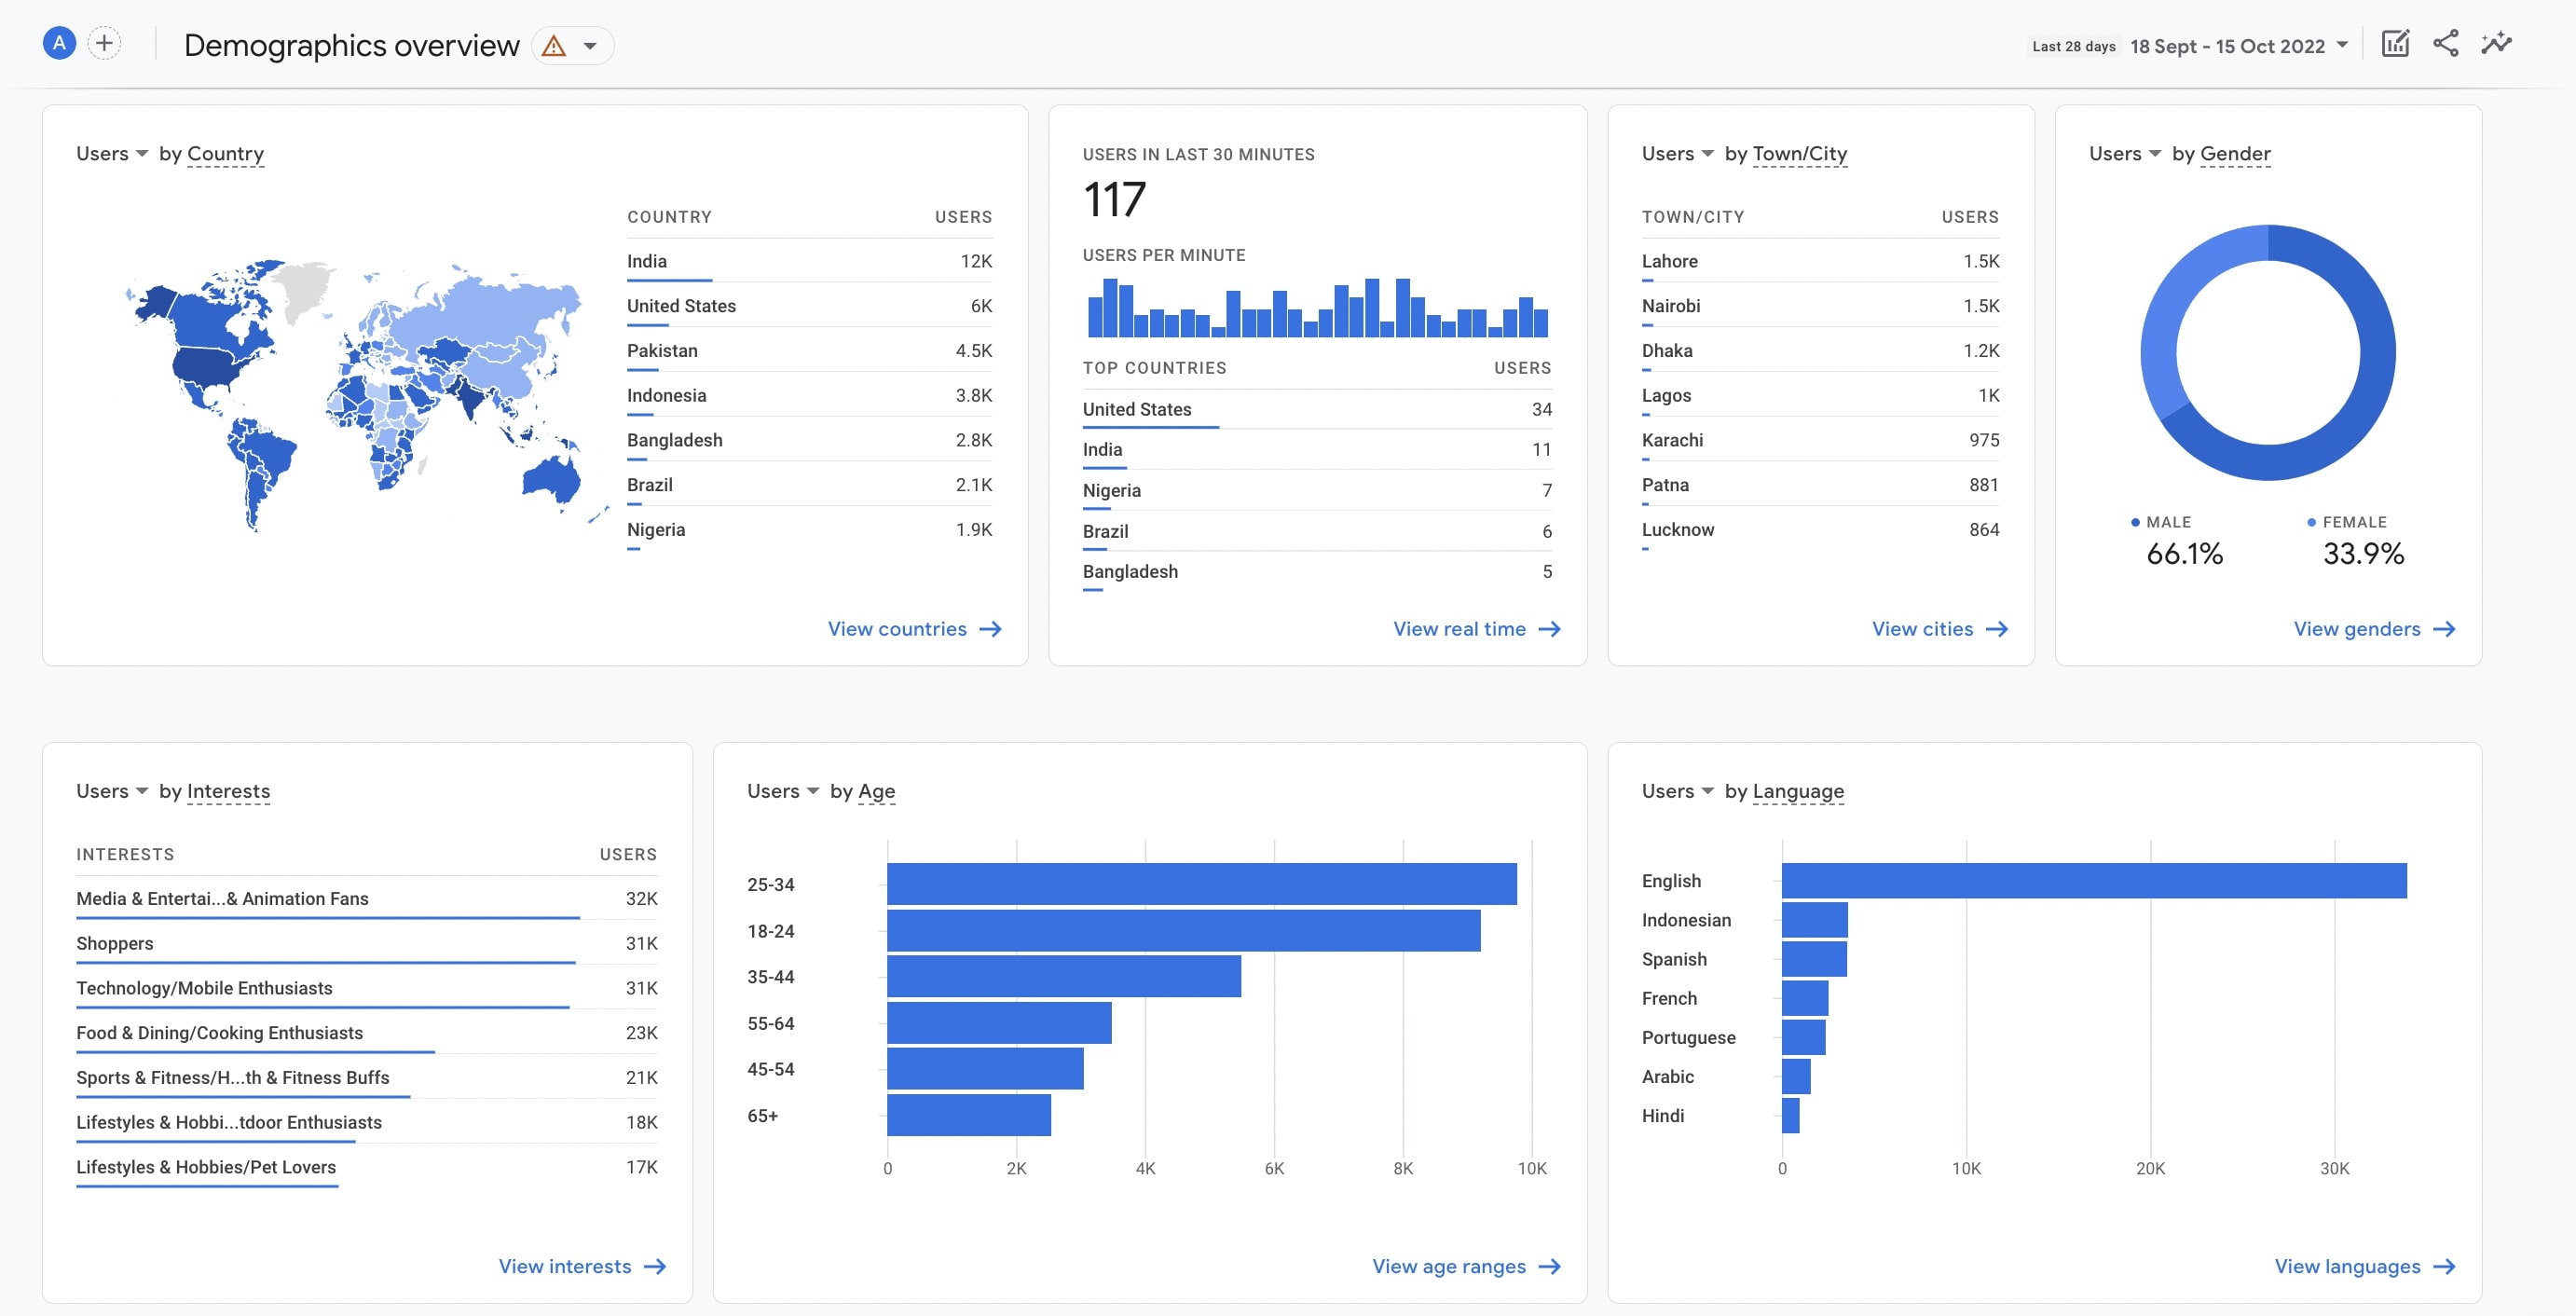
Overview
This section gives you a general view of your users’ average age, country, city, language, interests and gender.
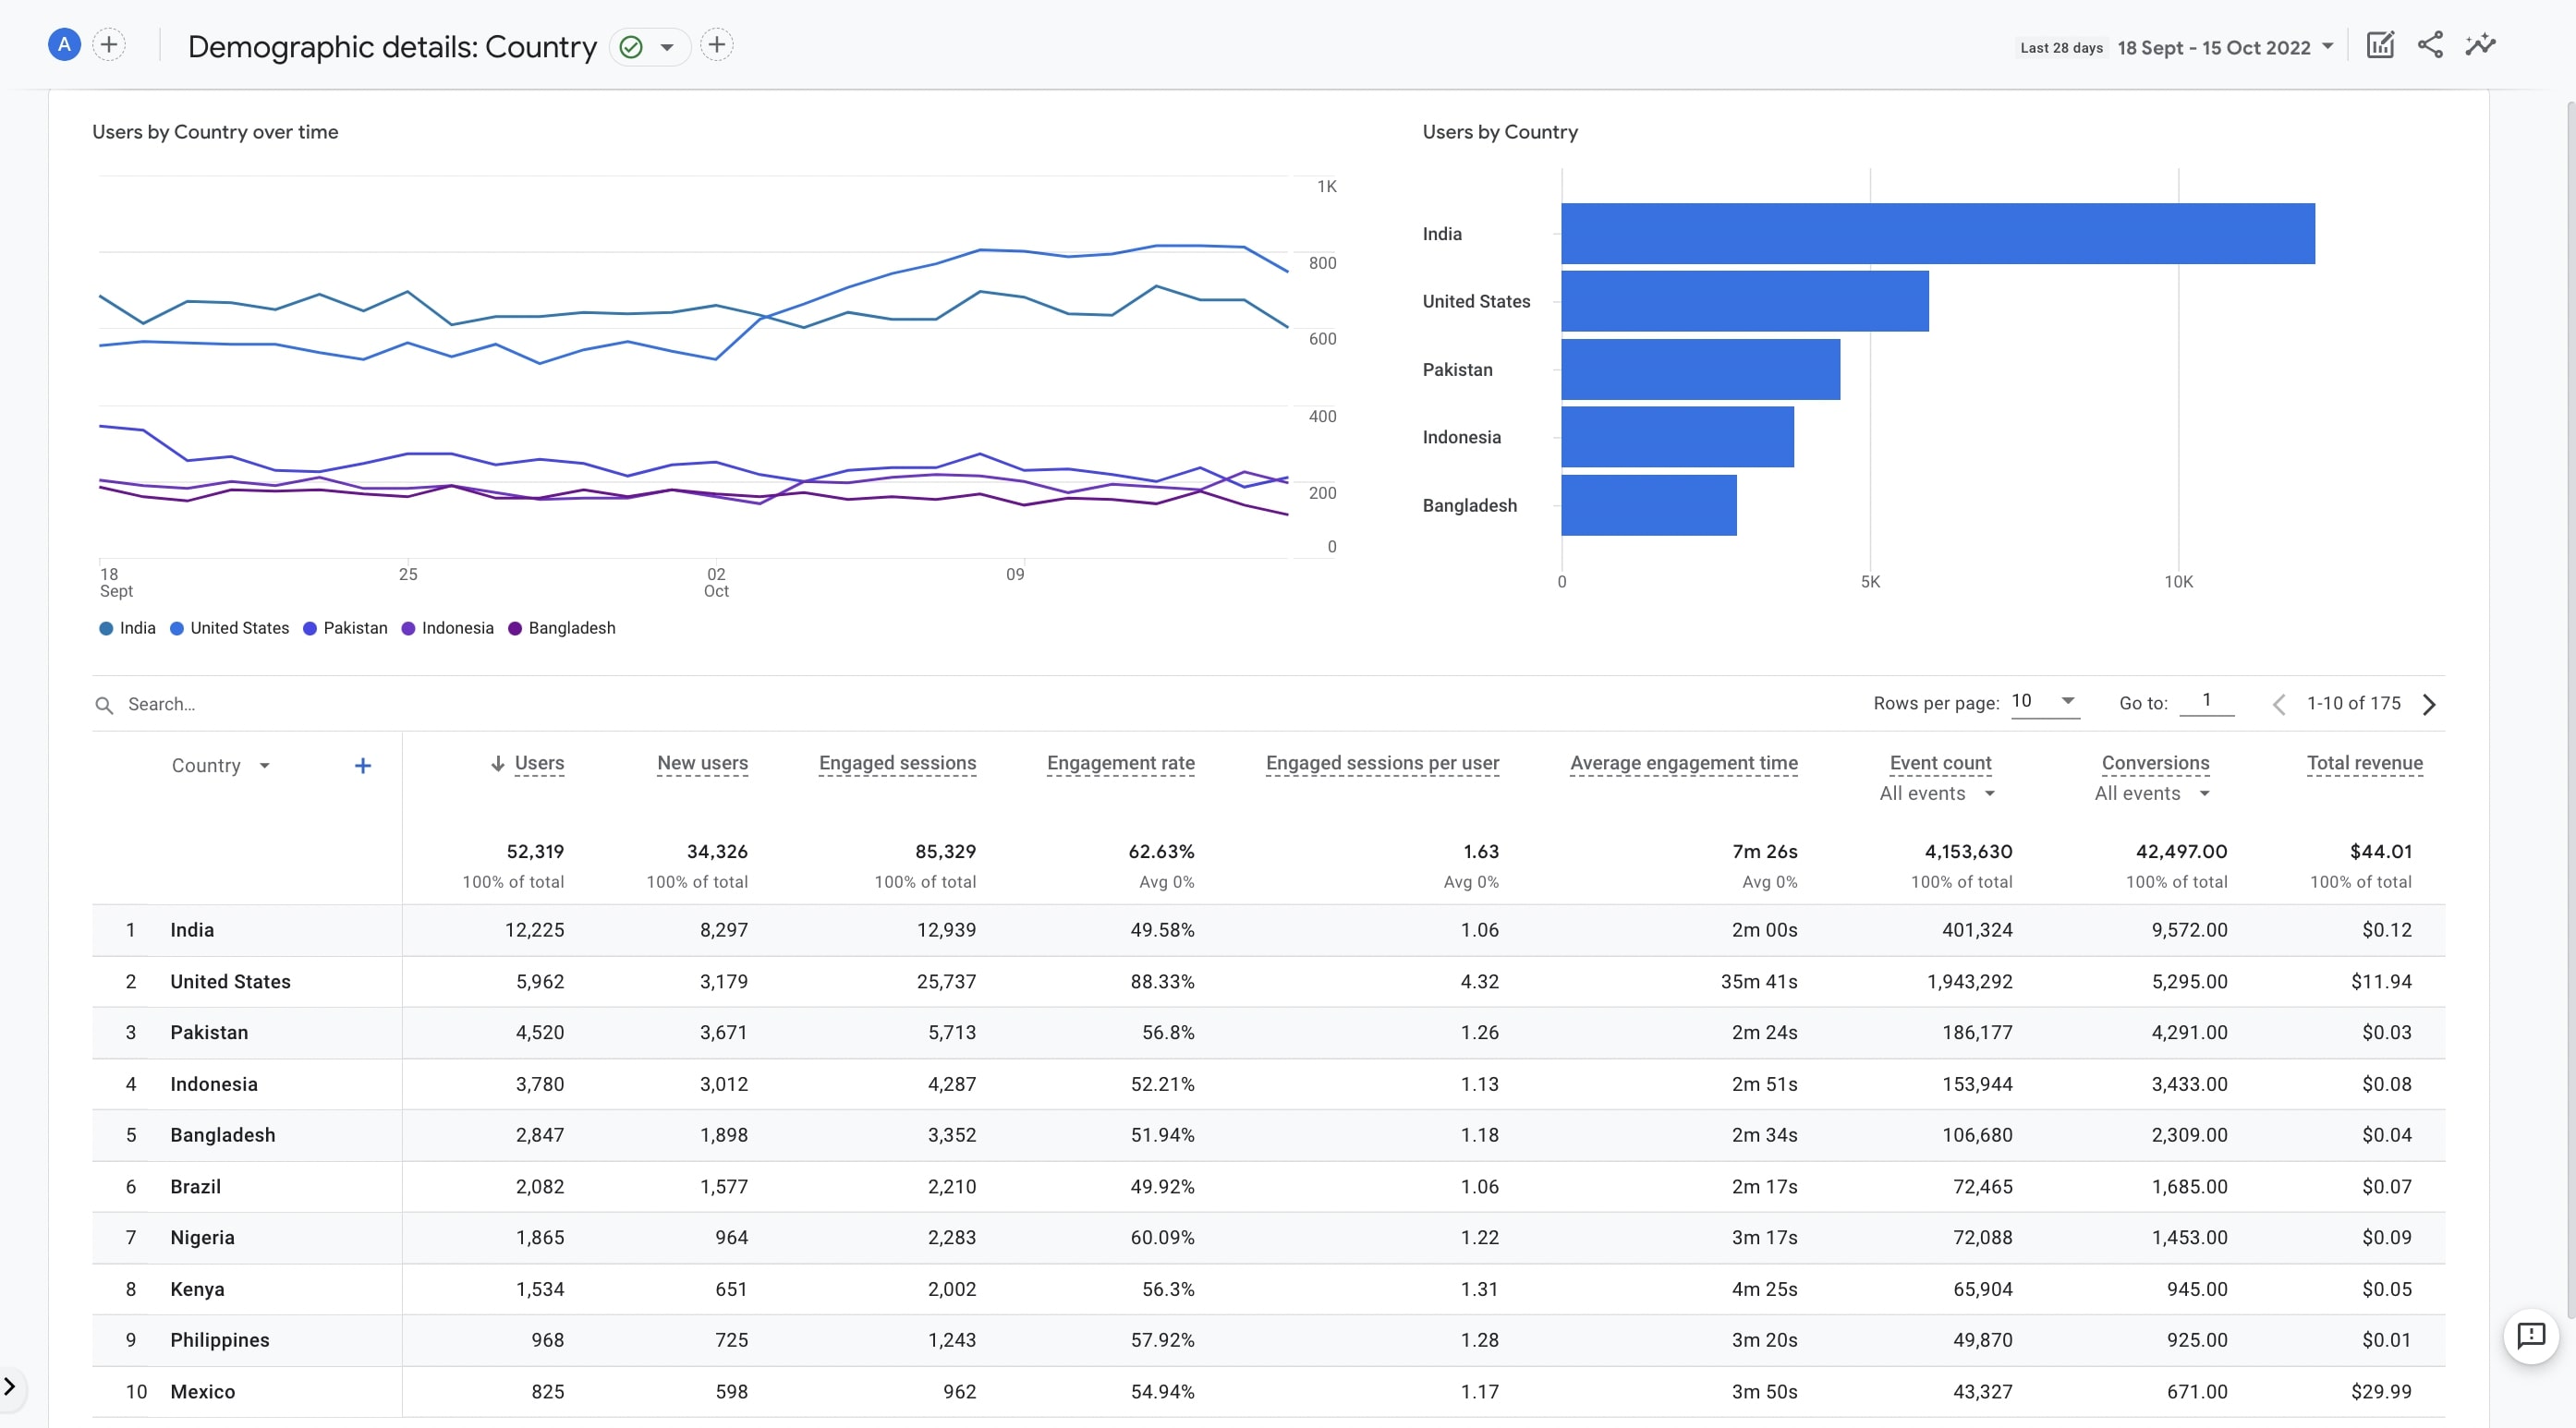
Demographic Details
Here, you can check out the demographics in further detail as you can add many filters and secondary dimensions to get a granular view of user demographics.
Tech
Tech reports help you understand the technologies your visitors use to engage with your content.
Overview
Here, you can have a thorough look at the details of your users in terms of technology used such as platform, operating system, screen resolution, and app version. For instance, you can see the percentage of users that consume your content using the iOS, or the Android operating system.
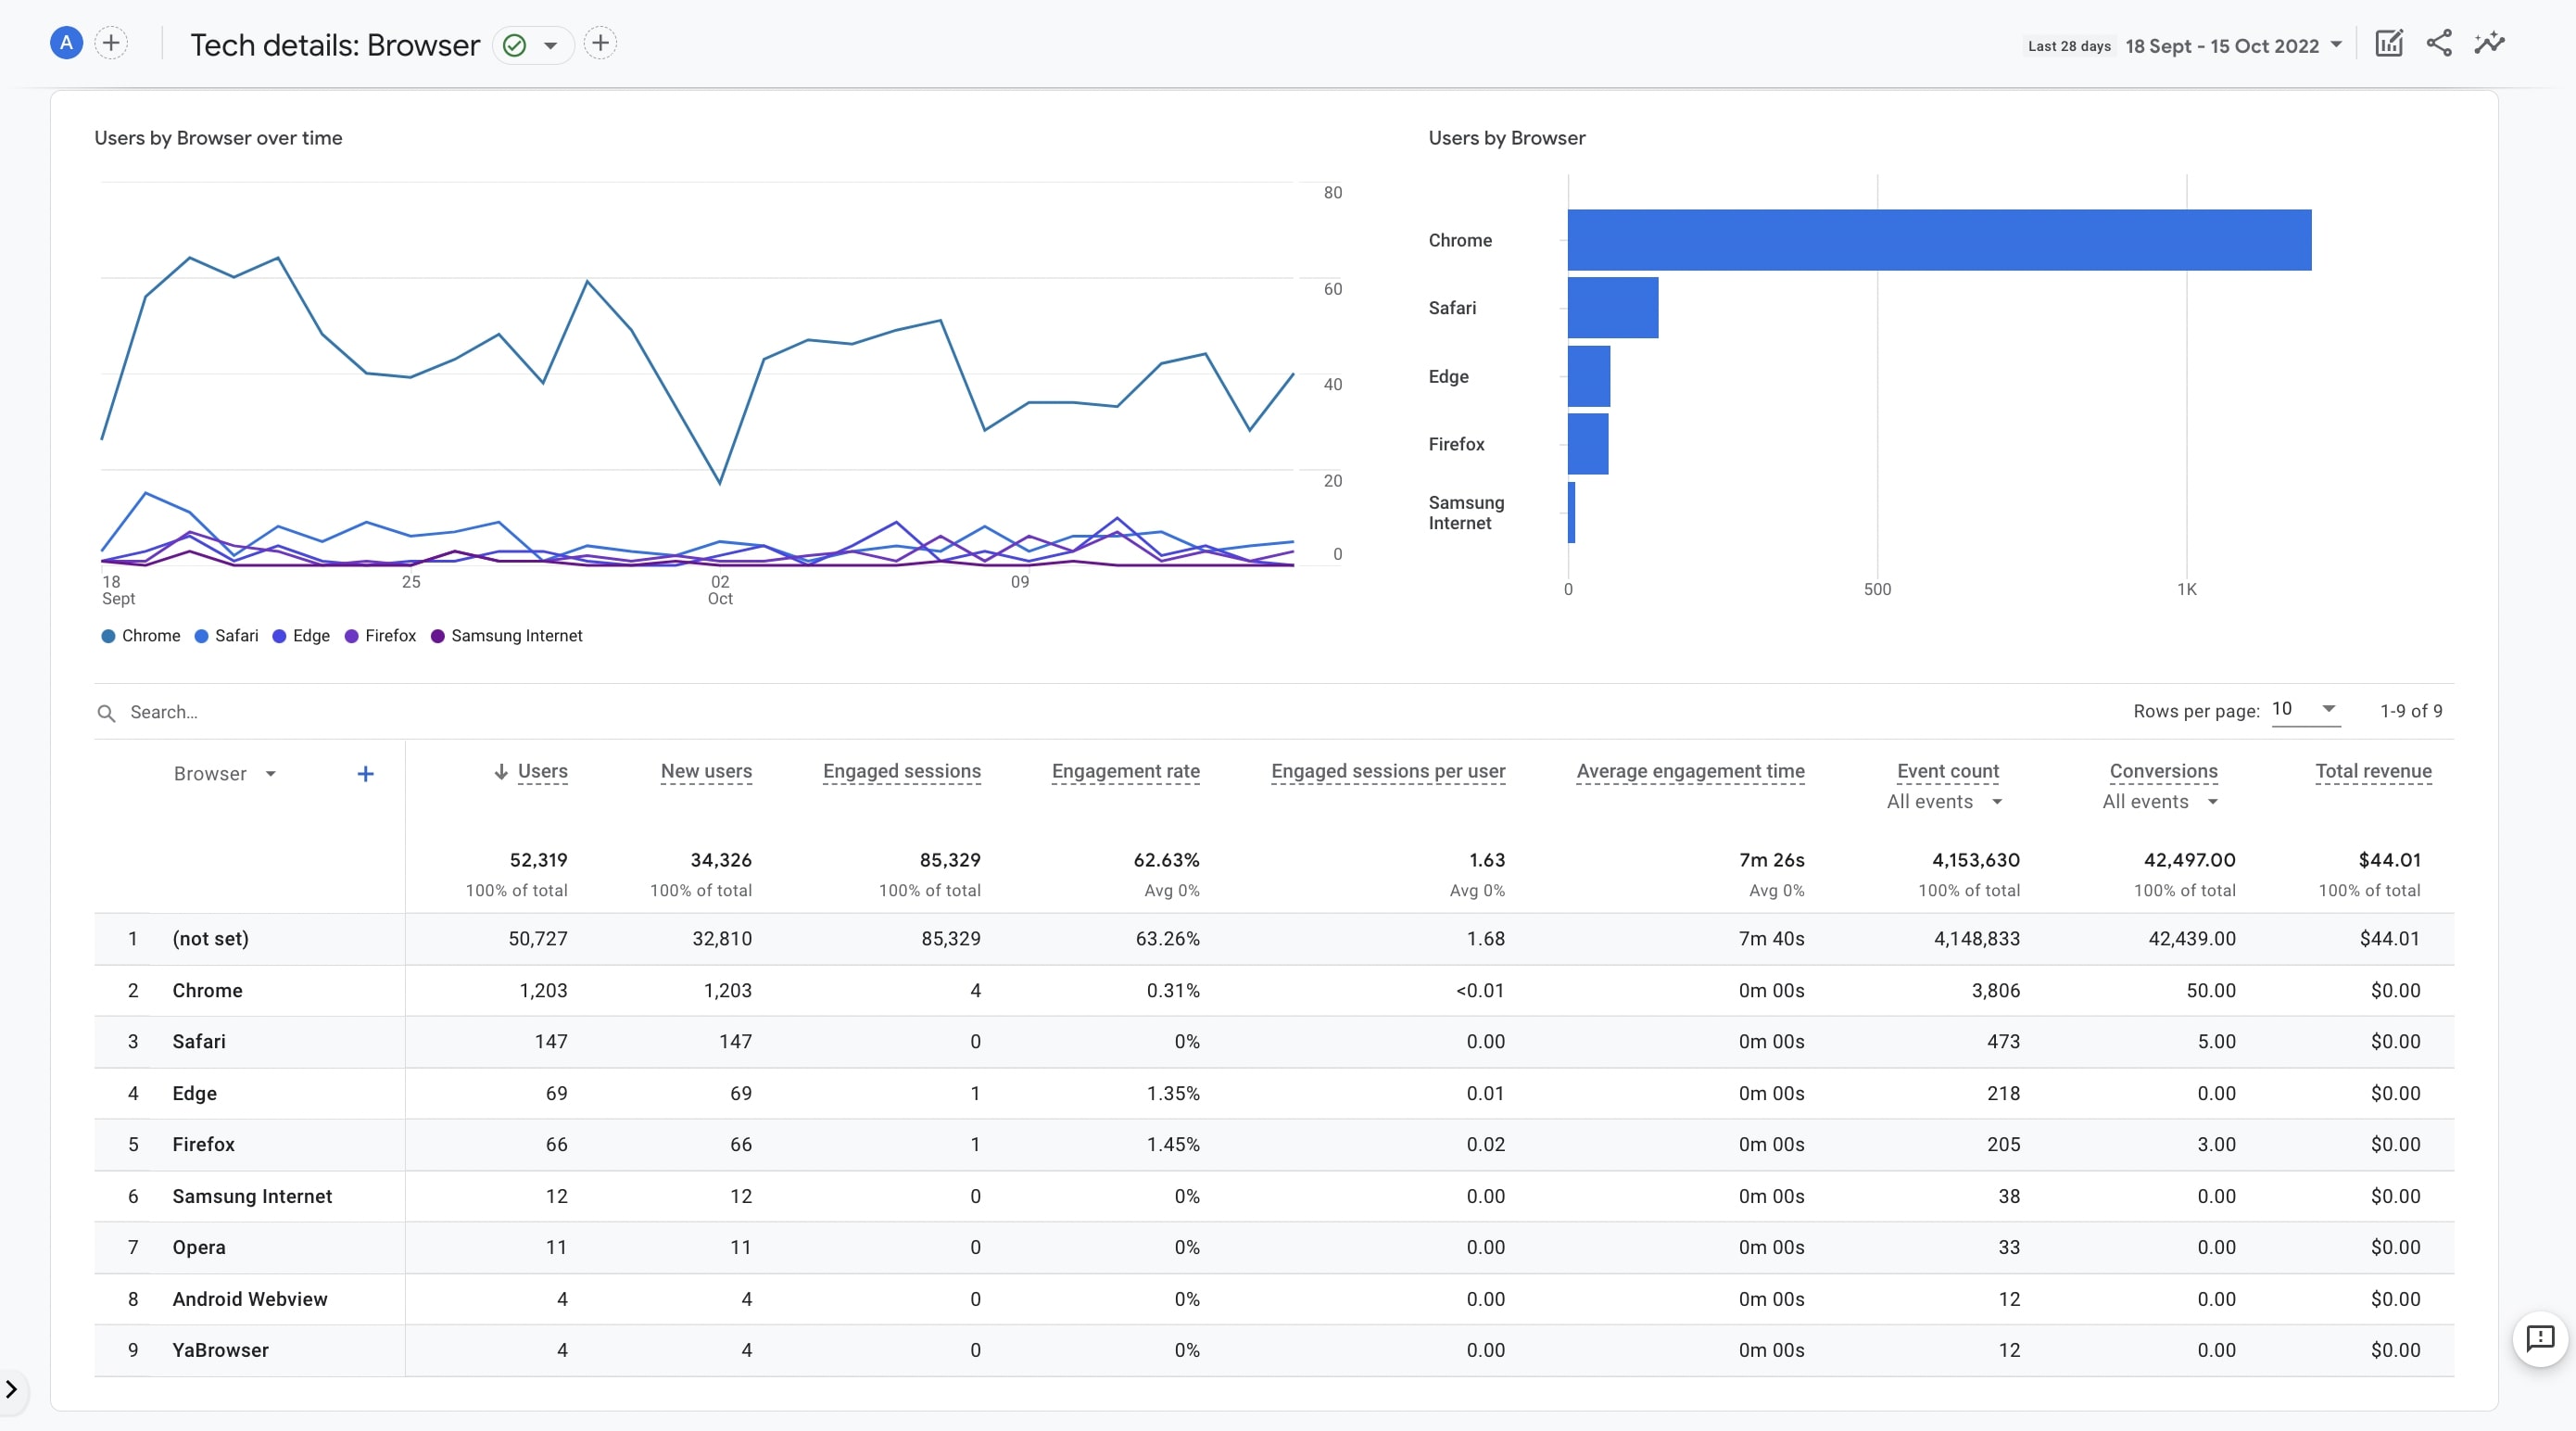
Tech Details
Reports and visuals here give you a better idea of user technology by letting you get more specific details. For example, you can benefit from additional dimensions and filters to understand what platform, browser, or device your visitors use.
Library
The Library serves as one of the most important features because customization lies at the heart of Google Analytics 4: Customization.
This section allows you to go ahead and create your own dashboard full of collections & reports that you need the most by simple drag & drop actions.
